E-submission
Articles
- Page Path
- HOME > J Pathol Transl Med > Volume 55(5); 2021 > Article
-
Original Article
Prognostic significance of viable tumor size measurement in hepatocellular carcinomas after preoperative locoregional treatment -
Yoon Jung Hwang1
 , Youngeun Lee2, Hyunjin Park3, Yangkyu Lee3, Kyoungbun Lee1, Haeryoung Kim,1
 -
Journal of Pathology and Translational Medicine 2021;55(5):338-348.
DOI: https://doi.org/10.4132/jptm.2021.07.26
Published online: September 2, 2021
1Department of Pathology, Seoul National University Hospital, Seoul National University College of Medicine, Seoul, Korea
2Department of Pathology, Seoul Medical Center, Seoul, Korea
3Department of Pathology, Gangnam Severance Hospital, Yonsei University College of Medicine, Seoul, Korea
- Corresponding Author: Haeryoung Kim, MD, PhD, Department of Pathology, Seoul National University College of Medicine, 103 Daehak-ro, Jongno-gu, Seoul 03080, Korea Tel: +82-2-740-8322, Fax: +82-2-765-5600, E-mail: 'haeryoung.kim@snu.ac.kr'
© 2021 The Korean Society of Pathologists/The Korean Society for Cytopathology
This is an Open Access article distributed under the terms of the Creative Commons Attribution Non-Commercial License (http://creativecommons.org/licenses/by-nc/4.0) which permits unrestricted non-commercial use, distribution, and reproduction in any medium, provided the original work is properly cited.
Abstract
-
Background
- Preoperative locoregional treatment (LRT) for hepatocellular carcinoma (HCC) often induces intratumoral necrosis without affecting the overall tumor size, and residual viable tumor size (VTS) on imaging is an important clinical parameter for assessing post-treatment response. However, for surgical specimens, it is unclear whether the VTS would be more relevant to prognosis compared to total tumor size (TTS).
-
Methods
- A total of 142 surgically resected solitary HCC cases were retrospectively reviewed. The TTS and VTS were assessed by applying the modified Response Evaluation Criteria in Solid Tumors method to the resected specimens, and correlated with the clinicopathological features and survival.
-
Results
- As applying VTS, 13/142 cases (9.2%) were down-staged to ypT1a. Although the survival analysis results for overall survival according to TTS or VTS were similar, VTS was superior to predict disease-free survival (DFS; p = .023) compared to TTS (p = .08). In addition, multivariate analysis demonstrated VTS > 2 cm to be an independent predictive factor for decreased DFS (p = .001). In the subpopulation of patients with LRT (n = 54), DFS in HCCs with TTS or VTS > 2 cm were significantly shorter than those with TTS or VTS ≤ 2 cm (p = .047 and p = .001, respectively). Interestingly, HCCs with TTS > 2 cm but down-staged to VTS ≤ 2 cm after preoperative LRT had similar survival to those with TTS ≤ 2 cm.
-
Conclusions
- Although the prognostic impact of tumor size was similar regardless of whether TTS or VTS was applied, reporting VTS may help to increase the number of candidates for surgery in HCC patients with preoperative LRT.
- Patient selection and clinicopathological analysis
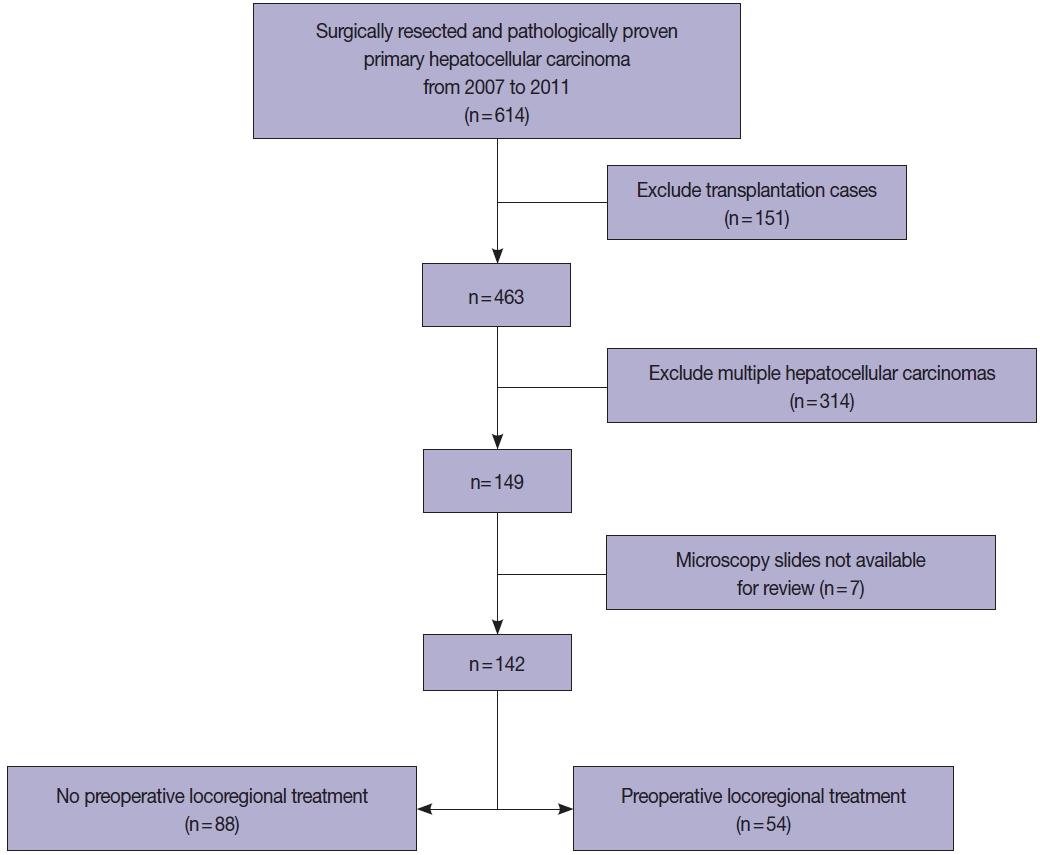
- All HCC cases that were surgically resected HCCs between 2007 and 2011 were retrieved from the pathology database of the Department of Pathology, Seoul National University Hospital, and retrospectively reviewed. To examine the prognostic significance of tumor size in this study, we excluded multiple HCCs, including those with satellite nodules or intrahepatic metastasis at the time of surgical resection. Liver explantation cases were also excluded from this study (Fig. 1). Only cases for which at least one entire cross-section of the tumor could be reconstructed with the slides (i.e., histological mapping) were included in this study. Clinical data including age, sex, underlying etiology, preoperative LRT details, and serum α-fetoprotein (AFP) and prothrombin induced by vitamin K absence-II (PIVKA-II) levels were retrieved from the electronic medical records. Pathological data were analyzed by reviewing pathology reports, gross images and glass slides, and included tumor size, gross type, histologic differentiation (Edmondson-Steiner grade), presence and extent (%) of necrosis, presence of microvascular invasion, major vessel invasion, or underlying cirrhosis, and the pathological T categories according to AJCC TNM staging system (8th edition). Gross types—according to the General Rules for the Study of Primary Liver Cancer by the Korean Liver Cancer Association [14]—were grouped as types 1 and 2, as previously described: type 1 HCCs consisted of expanding nodular and vaguely nodular types, and type 2 HCCs consisted of multinodular confluent, nodular with perinodular extension and infiltrative types [15]. The extent of necrosis was expressed as a percentage of the area of tumor necrosis over the total tumor area in a representative whole section. Major vessel invasion was defined as gross or microscopic invasion of main or first-order branches of the portal vein or hepatic vein, and microvascular invasion was defined as tumor invasion of microscopic vessels excluding the aforementioned major vessels. CK19 expression status was also assessed on representative whole tissue sections, when available. Follow-up data was obtained from the electronic medical records, including the status at last follow-up and the occurrence of extrahepatic metastasis or local recurrence.
- Tumor size assessment
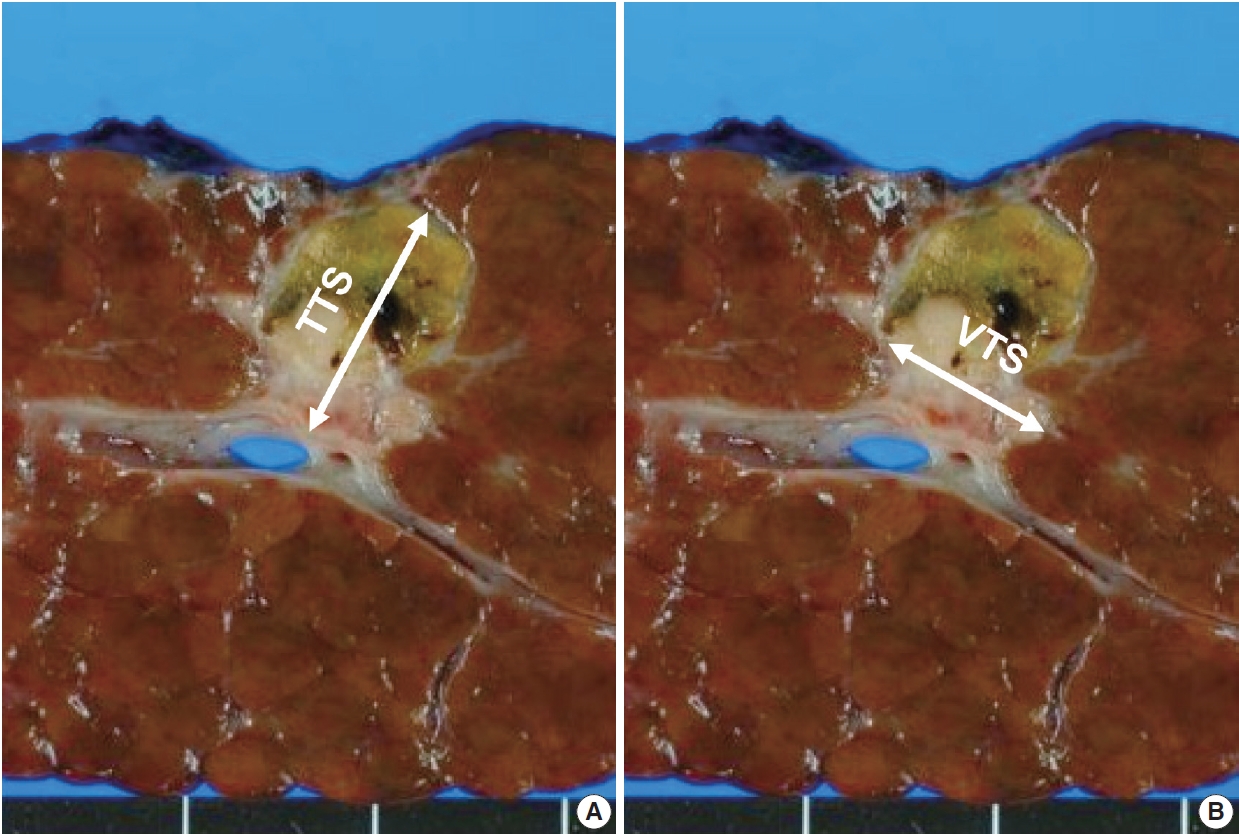
- The tumor size was assessed by reviewing the primarily the gross images of the representative section of the tumor, and the size measurement in the pathology reports. However, especially in HCCs with necrosis, it was often not possible to discriminate between viable and necrotic foci purely on gross morphology, and therefore the matching glass slides were reviewed for all cases to confirm the presence or absence of viable tumor. As previously mentioned, only cases where a full histological mapping of an entire cross-section was performed were included in this study. First, the greatest dimension of tumor was measured irrespective of the presence or absence of tumor necrosis, and this was designated as the TTS. Then, we applied the modified Response Evaluation Criteria in Solid Tumors (mRECIST) criteria for VTS evaluation, by measuring the greatest dimension of the viable tumor (Fig. 2) [16]. When there were multifocal viable areas within a single tumor, the greatest dimension of the largest viable focus was assessed.
- Statistical analysis
- All statistical analyses were performed using SPSS ver. 25.0 (IBM Corp., Armonk, NY, USA). Continuous data were presented as median with range and were analyzed by Mann-Whitney test, one-way analysis of variance (ANOVA) and Pearson’s correlation analysis. Categorical data were evaluated by chi-square test, Fisher exact test, and linear-by-linear association. Survival analyses for overall survival (OS) and disease-free survival (DFS) were carried out by the Kaplan-Meier method and log-rank test. OS was defined as the interval between the date of operation and the date of last hospital visit or death. DFS was defined as the interval between the date of operation and the date of the relapse (first post-operative recurrence or extrahepatic metastasis). To identify factors associated with TTS or VTS, univariate and multivariate logistic regression analyses were performed. Variables with p-values <.05 in univariate analysis were included in the multivariate analysis. p-value <.05 was considered to be statistically significant.
MATERIALS AND METHODS
- Patient characteristics
- A total of 142 cases of surgically resected solitary HCC were included in the study. The clinicopathological features of the study population are presented in Table 1. The median age was 60 years (range, 28 to 82 years), and 77.5% (110/142) of the patients were male. The majority of the cases (78.9%, 112/142) were associated with chronic hepatitis B virus (HBV) infection, and 38% (54/142) of the patients received preoperative LRT. The median tumor size was 5.1 cm (range, 0.4 to 16.7 cm), and 34.5% (49/142) of the cases showed intratumoral necrosis of any degree. CK19 expression was seen in 8.8% (10/142) of the HCCs. Pathologic T stages were pT1a in 12.7% (18/142), pT1b in 43.7% (62/142), pT2 in 29.6% (42/142), and pT4 in 14.1% (20/142) of cases. As only solitary HCCs were included in this study, there were no pT3 cases. Surgical resection margins were negative in 94.4% cases (134/142), positive in 4.9% cases (7/142), and not evaluable in one case.
- Relationship between the TTS and the clinicopathological characteristics
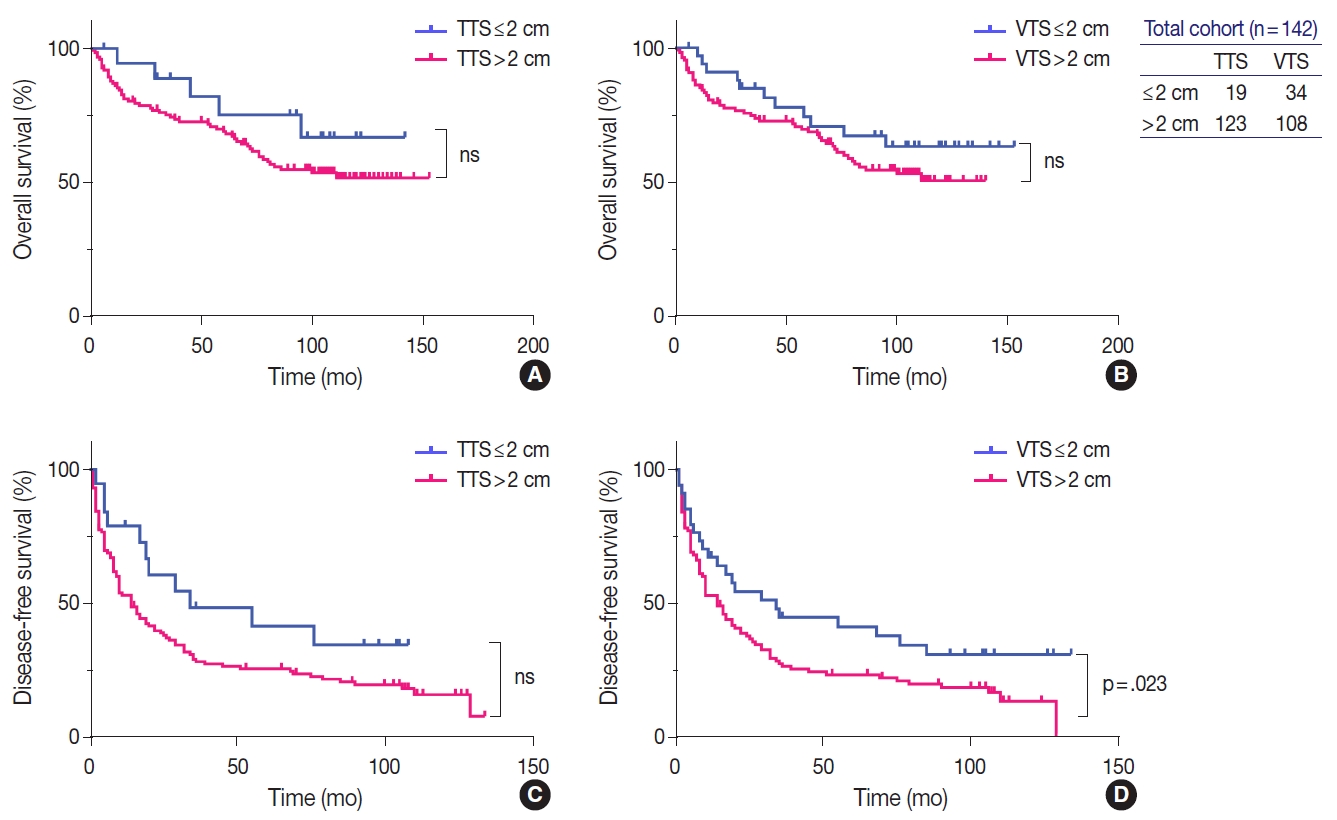
- The TTS of the HCCs were ≤2 cm in 19 cases (13.4%) and >2 cm in 123 cases (86.6%) (2–5 cm in 51 cases [35.9%], 5–10 cm in 52 cases [36.6%], and >10 cm in 20 cases [14.1%]) (Table 2, Supplementary Table S1). HCCs with TTS >2 cm were more frequently associated with high preoperative serum PIVKA-II level (p=.001) and microvascular invasion (p=.009). On further stratification with 2 cm, 5 cm and 10 cm cutoffs, larger HCCs were less frequently associated with an HBV etiology (p=.028), and were more frequently associated with high preoperative serum AFP and PIVKA-II levels (p=.013 and p< .001, respectively) (Supplementary Table S1). LRT was performed less frequently in the larger tumors (p=.038). On microscopy, larger tumors more frequently demonstrated microvascular invasion (p=.038), and major vascular invasion, although marginally significant (p=.071). Larger HCCs were less frequently associated with cirrhosis in the background liver (p=.005). TTS was not correlated with other clinicopathological factors, including age, sex, gross type, the presence of necrosis, Edmondson-Steiner grade, and CK19 positivity.
- Relationship between VTS and the clinicopathological characteristics after down-staging
- When the VTS was applied for all cases, 13/142 cases (9.2%) were down-staged according to the AJCC staging system. In detail, 10 cases that were initially pT1b and three cases that were initially pT2 by TTS were down-staged to ypT1a. Of the 13 cases, 12 patients (92.3%) had undergone LRT for HCC, while the remaining one patient did not receive LRT for HCC, but received chemotherapy for a concurrent rectal cancer. The median extent of tumor necrosis for the down-staged 13 cases was 90.0% with a range of 15%–99%. The median VTS for the total 142 cases was 4.3 cm with a range of 0.02–16.7 cm, and that for the 13 down-staged cases was 1.4 cm with a range of 0.02–2.0 cm.
- After applying the VTS, 34 patients (23.9%) had tumors of 2 cm or less and 108 (76.1%) had tumors of >2 cm (2–5 cm in 44 cases [31.0%], 5–10 cm in 50 cases [35.2%], and >10 cm in 14 cases [9.9%]) (Table 2, Supplementary Table S2). In addition to high preoperative serum PIVKA-II level (p<.001) and microvascular invasion (p=.021), high preoperative serum AFP level (p=.037) and poor histologic grade (p=.033) were more frequent in tumors with VTS >2 cm. LRT was less frequently performed in tumors with VTS >2 cm (p=.001). The presence and extent of necrosis were also more frequent and higher in tumors with VTS >2 cm (p=.010 and p=.023, respectively). On further stratification with 2 cm, 5 cm, and 10 cm cutoffs, larger tumors were less frequently associated underlying HBV infection (p=.020), were more frequently associated with high preoperative serum AFP and PIVKA-II levels (p=.016 and p<.001, respectively), and were less frequently treated preoperatively (p<.001) (Supplementary Table S2). Histopathologically, microvascular invasion was more frequently observed in larger tumors (p=.013), and larger HCCs were less frequently associated with cirrhosis in the background liver (p<.001). Tumor necrosis was less frequently seen in the larger tumors (p=.014). There was no significant difference in age, sex, gross type, and CK19 positivity according to VTS.
- Survival analysis results
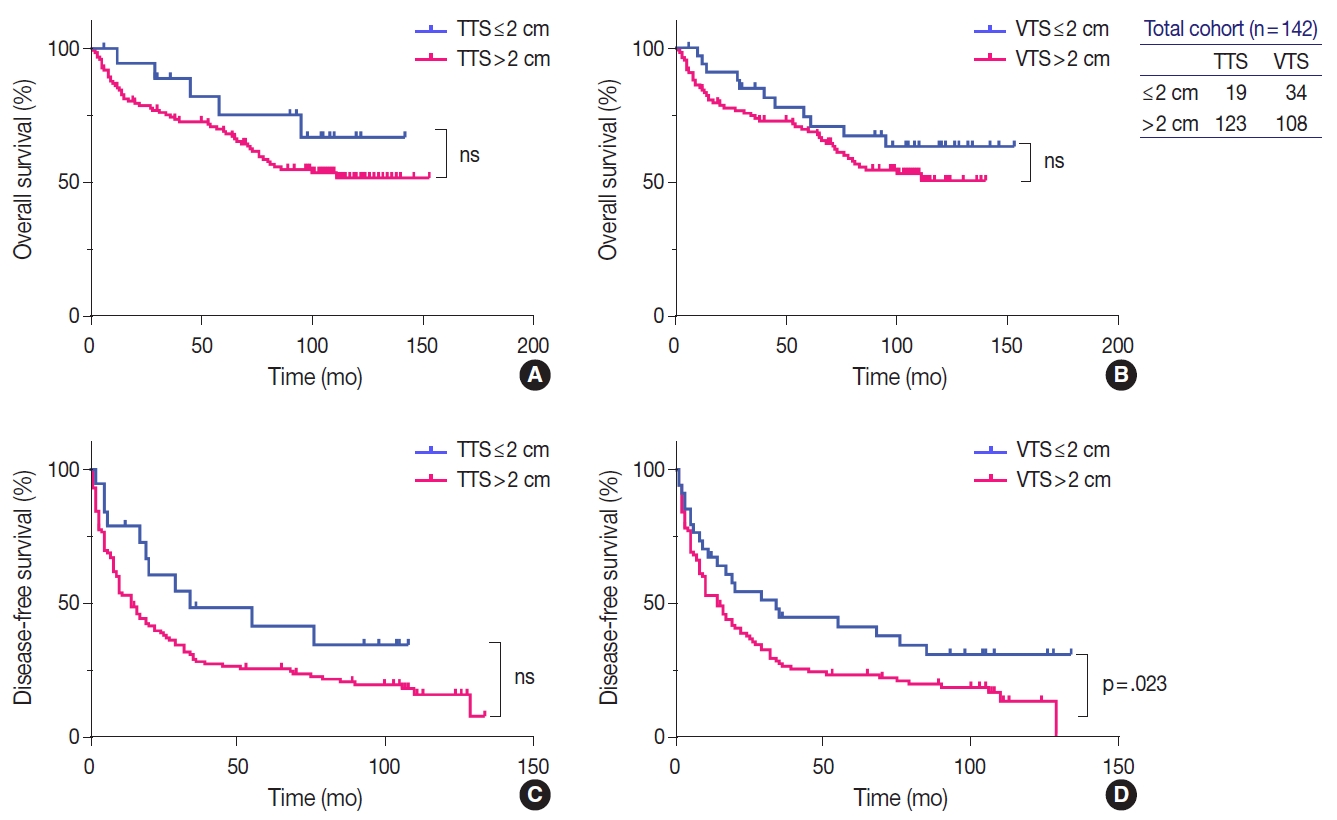
- For the entire cohort of 142 patients, the median OS was 80.5 months (range, 1 to 153 months), and the 5-year and 10-year survival rates were 67.6% and 53.8%, respectively. The median time to relapse was 14 months (range, 0 to 134 months) and DFS rates at 3 and 5 years were 75.3% and 59.6%, respectively.
- Univariate analysis showed that AFP level ≥1,000 ng/mL (p=.017), gross type 2 (p=.013), the presence of necrosis (p=.004), Edmondson-Steiner grade III or IV (p=.007), microvascular invasion (p=.014), major vessel invasion (p=.019), and CK19 expression (p=.005) were significantly associated with decreased OS (Table 3). Although there was a tendency for lower OS for HCCs with TTS >2 cm and VTS >2 cm, the results were not statistically significant (Fig. 3). For DFS, preoperative LRT (p=.029), PIVKA-II level ≥200 mAU/mL (p=.044), VTS >2 cm (p=.028), the presence of necrosis (p=.004), Edmonson-Steiner grade III or IV (p=.025), microvascular invasion (p=.006), and major vessel invasion (p<.001) were significantly associated with decreased DFS (Table 3, Fig. 3). Kaplan-Meier analysis demonstrated decreased DFS in HCCs with TTS >2 cm, although marginally significant (p=.051).
- On multivariate analysis, AFP level ≥1,000 ng/mL (hazard ratio [HR], 1.946; 95% confidence interval [CI], 1.023 to 3.701; p=.042) and necrosis (HR, 3.044; 95% CI, 1.662 to 5.574; p<.001) were identified as independent predictive factors for poor OS, and preoperative LRT (HR, 2.315; 95% CI, 1.456 to 3.682; p<.001), microvascular invasion (HR, 1.583; 95% CI, 1.012 to 2.476; p=.044), major vessel invasion (HR, 1.893; 95% CI, 1.054 to 3.400; p=.033), and, notably, VTS >2 cm (HR, 2.672; 95% CI, 1.502 to 4.755; p=.001) were independent predictive factors for decreased DFS.
- Subgroup analysis: preoperative LRT cohort
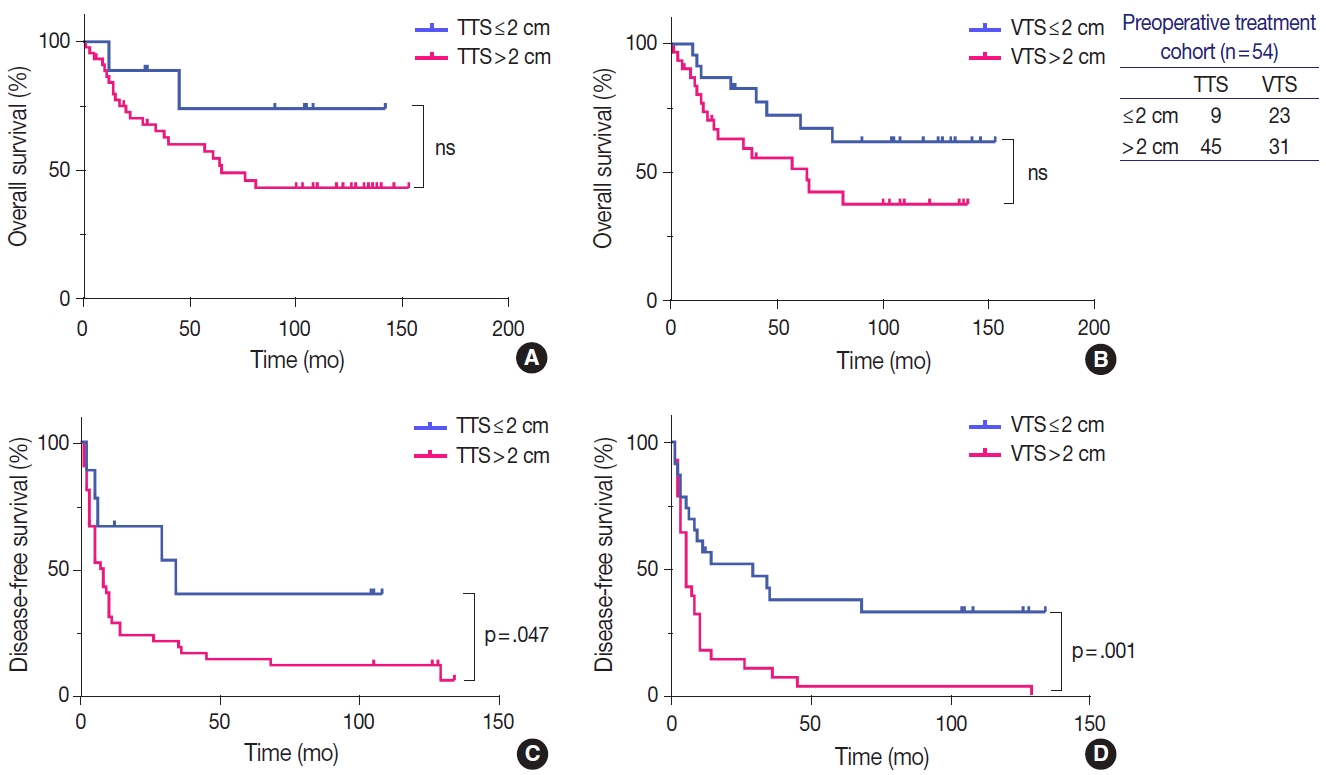
- The subgroup of HCC patients who received LRT (n=54) was analyzed separately, and the clinicopathological features are presented in Supplementary Table S3. The median period between the date of the most recent LRT and the operation date was 2 months (range, 0 to 96 months). The median tumor size was 3.8 cm (range, 0.4 to 11.9 cm), and 75.9% (41/54) of the cases showed intratumoral necrosis (extent of necrosis, 1%–99%). CK19 expression was seen in 11.5% (3/26), and there was no statistically significant difference in CK19 expression status in the HCCs according to preoperative treatment status (p=.594). According to TTS, nine patients (16.7%) had tumors with ≤2 cm, 23 patients (42.6%) had tumors 2–5 cm, 18 patients (33.3%) had tumors with size 5–10 cm, and four patients (7.4%) had tumors >10 cm. After applying the VTS, the number of HCCs ≤2 cm increased to 23 cases (42.6%); 17 and 14 cases (31.5 and 25.9%) had tumor sizes of 2–5 cm and 5–10 cm, respectively, and none of the cases were larger than 10 cm. There was no significant correlation between VTS and the time elapsed from the most recent LRT.
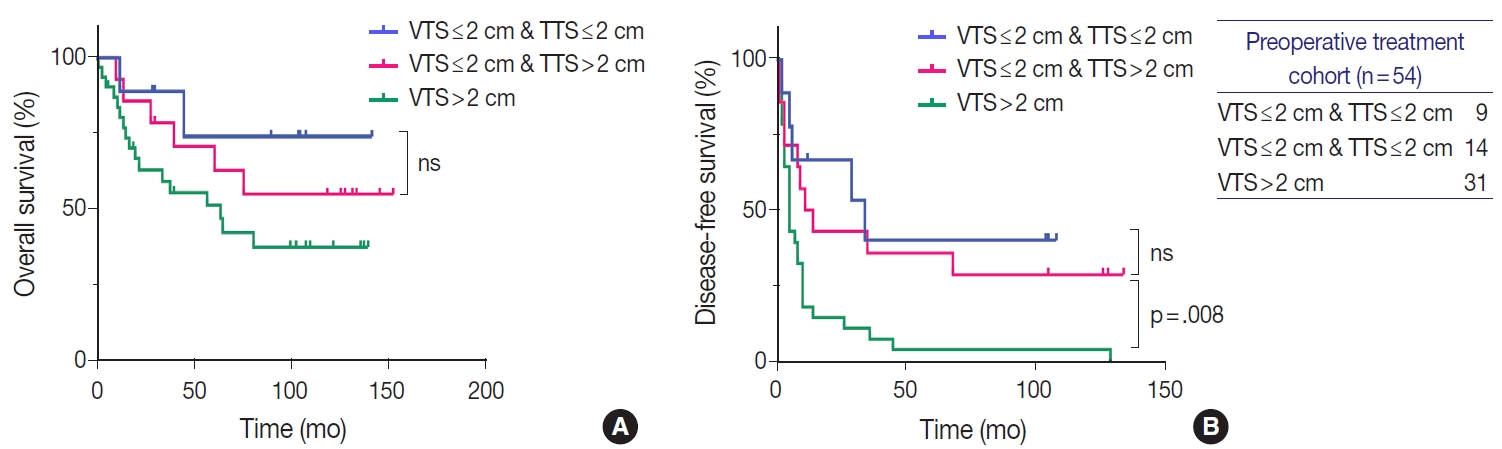
- Similarly to the total population, larger tumors in the LRT cohort demonstrated worse OS and DFS. OS in HCCs with TTS or VTS >2 cm were shorter than those with TTS or VTS ≤ 2 cm, although marginally significant (Fig. 4). DFS was significantly lower for HCCs >2 cm for both TTS and VTS (p=.047 and p= .001, respectively). Interestingly, when we further stratified the 23 VTS ≤2 cm cases into HCCs that were originally VTS ≤2 cm (i.e., TTS ≤2 cm, n=9) and those that were originally TTS >2 cm but down-staged to VTS ≤2 cm after preoperative treatment (n=14), there was no difference in the DFS between the two groups (Fig. 5).
RESULTS
- The extent of residual viable tumor after neoadjuvant treatment is a prognostic factor for various malignant neoplasms, including esophageal, gastric, pancreatic, lung, and colorectal cancers [17-21]. For example, for pancreatic ductal adenocarcinoma, the maximal dimension of the residual tumor is used for assigning the ypT stage according to the TNM system, and although there is still no worldwide consensus on what grading system should be used to evaluate response to neoadjuvant therapy, the degree of tumor response is reported in surgical pathology practice along with the ypT stage [13,22].
- As with tumors of most other organs, tumor size is an important prognostic factor for HCC. It is one of the main parameters for HCC staging, and is included in various different staging systems for HCC [6-9]. For example, in the AJCC TNM staging system, single tumors are staged as pT1a or pT1b using a size cut-off of 2 cm, and multiple tumors are assigned as pT2 or pT3 using a cutoff value of 5 cm [3,23]. In the BCLC staging system, solitary HCCs <2 cm are categorized as very early stage HCCs (stage 0) [4,24]. However, it is still unclear how the tumor size should be measured in the setting of HCCs after LRT, especially if there is extensive intratumoral necrosis as a result of the LRT: unlike many other tumors that show shrinkage in tumor size after neoadjuvant treatment, the TTS of HCC often remains unaltered after LRT, and therefore may not exactly reflect the actual tumor burden [11,12].
- The concept of VTS assessment in HCC after LRT by imaging was initially proposed by a panel of HCC experts convened by the European Association for the Study of the Liver (EASL) in 2000 [25]. This panel considered the reduction of VTS—measured by the size of the enhancing tumor on contrast-enhanced dynamic computed tomography or magnetic resonance imaging—to be the optimal method for assessing response to treatment. This concept was further endorsed by the American Association for the Study of Liver Diseases (AASLD) in 2005, and subsequently, the AASLD and Journal of the National Cancer Institute (AASLD-JNCI) guidelines formally modified the RECIST (sum of diameters of target lesions) criteria so that VTS (enhancing tumor size by imaging), rather than TTS, is used to assess treatment response in HCCs [26]. Objective tumor response to treatment as measured by the mRECIST criteria was found to be a good predictor of survival in HCC patients treated by LRT or systemic targeted therapy [11,27-29]. In addition, the mRECIST assessment has been shown to have prognostic value even after liver transplantation; one recent study demonstrated that incorporating the mRECIST assessment into the Metroticket 2.0 model for post-liver transplantation HCC-related death prediction could improve its predictive ability [30]. However, there is no study to date on the significance of VTS evaluation by pathology on HCCs. Therefore, we postulated that a measurement of the residual (viable) tumor size (VTS) may be more relevant for prognostication purposes, and questioned whether applying the VTS had any effect on the clinicopathological features and/or prognosis of HCC patients.
- We found that the VTS was not superior to TTS in predicting survival of HCC patients; there was no significant prognostic difference between TTS and VTS in both total population and the LRT subgroup. However, we found that VTS exceeding 2 cm was significantly predictive of a poor DFS on both univariate and multivariate analyses, and that among the group of patients who received preoperative LRT, HCCs with VTS ≤2 cm demonstrated significantly longer DFS compared to HCCs with VTS >2 cm. Moreover, HCCs that were originally larger than 2 cm (TTS >2 cm) but down-staged to VTS ≤2 cm after LRT showed significantly longer DFS compared to HCCs with VTS >2 cm, and the DFS of the down-staged tumors were similar to that of HCCs that were originally (TTS) ≤ 2 cm. This suggests that VTS ≤2 cm could be considered ypT1a regardless of the original TTS before LRT. This may have important clinical implications, as patients with HCCs that are down-staged to ypT1a based on the VTS could become potential candidates for surgical resection or transplantation, providing a chance for curative therapy for patients who were originally deemed as being ineligible for surgery.
- From the practical point of view, measuring tumor size may be difficult when there are multifocally scattered residual tumors in treated HCCs. In this study, we adapted the mRECIST method (maximum diameter of enhancing tumor by imaging) to the surgical specimens (maximum diameter of the viable tumor by macroscopic and microscopic evaluation) [16]; therefore, the size of the largest viable tumor was measured in the case of multifocally scattered viable tumors. However, we did experience difficulties with accurately measuring the VTS in some of our cases, especially when there was an irregular geographic distribution of intratumoral necrosis. For example, in one case, the VTS (1.2 cm) was considerably lower than the TTS (8.5 cm), although the percentage of tumor necrosis was only 30%. On the other hand, in another case with 95% necrosis, there was only a small decrease in tumor size, from 3.5 cm (TTS) to 1.9 cm (VTS). Nevertheless, measurement of the VTS was feasible for the majority of cases, and actually easier to assess compared to estimating the extent of intratumoral necrosis, especially for tumors with near total necrosis. Another problem with the TTS is that the TTS may not accurately measure the actual tumor size, as the peritumoral hepatic parenchyme is often infarcted as a result of TACE or RFA, and the infarcted non-neoplastic parenchyme may be misinterpreted as being part of the HCC, potentially resulting in an overestimation of the tumor size.
- The VTS measurement used in this study could by no means be an accurate surrogate of the actual viable tumor volume. Measuring the tumor volume and the change in tumor volume after LRT could theoretically reflect the tumor response and prognosis better than this simple one-dimensional VTS measurement. In this aspect, digital pathology may potentially play a role in accurate tumor size or volume assessment in the near future.
- This study has its limitations. It is a retrospective cohort study of archival cases, and therefore the gross photographs taken at the time of accession (and their corresponding slides) were reviewed for TTS and VTS measurement. Therefore, it is possible that the representative cross sections in the photographs did not reflect the exact tumor size. However, we selected only those cases in which histological mapping was performed for at least one whole cross section to ensure an accurate size measurement in the available cross section. This resulted in the smaller number of HCC cases enrolled, which is another limitation of this study.
- In conclusion, although the impact on patient survival according to VTS or TTS measurement was not significantly different, HCCs that were down-staged to VTS ≤2 cm after preoperative LRT had similar outcomes to HCCs that were originally smaller than 2 cm, suggesting that such tumors may be assigned as ypT1a by the AJCC TNM system and that reporting the VTS may help to increase the number of HCC patients that are eligible for surgery after LRT.
DISCUSSION
Supplementary Materials
Supplementary Table. S1.
Supplementary Table. S2
Supplementary Table. S3
-
Supplementary Information
The Data Supplement is available with this article at https://doi.org/10.4132/jptm.2021.07.26.
-
Ethics Statement
This study was approved by the Institutional Review Board of Seoul National University Hospital and informed consent was waived due to the retrospective nature of this study (IRB number H-2003-035-1107).
-
Availability of Data and Material
The datasets generated or analyzed during the study are available from the corresponding author on reasonable request.
-
Code Availability
Not applicable.
-
Author Contributions
Conceptualization: YJH, HK. Data curation: YJH, YL, HP, YL, HK. Investigation: YJH, HK. Methodology: YJH, HK. Supervision: HK. Writing—original draft: YJH, HK. Writing—review & editing: YJH, YL, HP, YL, KL. Approval of final manuscript: YJH, YL, HP, YL, KL.
-
Conflicts of Interest
H.K., a contributing editor of the Journal of Pathology and Translational Medicine, was not involved in the editorial evaluation or decision to publish this article. All remaining authors have declared no conflicts of interest.
-
Funding Statement
This work was supported by the National Research Foundation of Korea (NRF) grant funded by the Korea government (NRF-2019R1A2C2010056, NRF-2016R1D1A1A09919042).
Notes


Values are presented as number (%) or median (range).
HBV, hepatitis B virus; HCV, hepatitis C virus; TACE, trans-arterial chemoembolization; RFA, radiofrequency ablation; PEI, percutaneous ethanol injection; AFP, α-fetoprotein; PIVKA-II, prothrombin induced by vitamin K absence-II; CK19, cytokeratin 19.
- 1. Bray F, Ferlay J, Soerjomataram I, Siegel RL, Torre LA, Jemal A. Global cancer statistics 2018: GLOBOCAN estimates of incidence and mortality worldwide for 36 cancers in 185 countries. CA Cancer J Clin 2018; 68: 394–424. ArticlePubMed
- 2. Kamarajah SK, Frankel TL, Sonnenday C, Cho CS, Nathan H. Critical evaluation of the American Joint Commission on Cancer (AJCC) 8th edition staging system for patients with Hepatocellular Carcinoma (HCC): a Surveillance, Epidemiology, End Results (SEER) analysis. J Surg Oncol 2018; 117: 644–50. ArticlePubMed
- 3. Chun YS, Pawlik TM, Vauthey JN. 8th edition of the AJCC cancer staging manual: pancreas and hepatobiliary cancers. Ann Surg Oncol 2018; 25: 845–7. ArticlePubMed
- 4. European Association for the Study of the Liver; European Organisation for Research and Treatment of Cancer. EASL-EORTC clinical practice guidelines: management of hepatocellular carcinoma. J Hepatol 2012; 56: 908–43. ArticlePubMed
- 5. Yau T, Tang VY, Yao TJ, Fan ST, Lo CM, Poon RT. Development of Hong Kong Liver Cancer staging system with treatment stratification for patients with hepatocellular carcinoma. Gastroenterology 2014; 146: 1691–700. ArticlePubMed
- 6. Subramaniam S, Kelley RK, Venook AP. A review of hepatocellular carcinoma (HCC) staging systems. Chin Clin Oncol 2013; 2: 33.PubMed
- 7. Huang WJ, Jeng YM, Lai HS, Sheu FY, Lai PL, Yuan RH. Tumor size is a major determinant of prognosis of resected stage I hepatocellular carcinoma. Langenbecks Arch Surg 2015; 400: 725–34. ArticlePubMed
- 8. Goh BK, Teo JY, Chan CY, et al. Importance of tumor size as a prognostic factor after partial liver resection for solitary hepatocellular carcinoma: Implications on the current AJCC staging system. J Surg Oncol 2016; 113: 89–93. ArticlePubMed
- 9. Wu G, Wu J, Wang B, Zhu X, Shi X, Ding Y. Importance of tumor size at diagnosis as a prognostic factor for hepatocellular carcinoma survival: a population-based study. Cancer Manag Res 2018; 10: 4401–10. ArticlePubMedPMC
- 10. Rhee H, Kim H, Park YN. Clinico-radio-pathological and molecular features of hepatocellular carcinomas with keratin 19 expression. Liver Cancer 2020; 9: 663–81. ArticlePubMedPMC
- 11. Lencioni R, Montal R, Torres F, et al. Objective response by mRECIST as a predictor and potential surrogate end-point of overall survival in advanced HCC. J Hepatol 2017; 66: 1166–72. ArticlePubMed
- 12. Jiang T, Zhu AX, Sahani DV. Established and novel imaging biomarkers for assessing response to therapy in hepatocellular carcinoma. J Hepatol 2013; 58: 169–77. ArticlePubMed
- 13. Chatterjee D, Katz MH, Foo WC, et al. Prognostic significance of new AJCC tumor stage in patients with pancreatic ductal adenocarcinoma treated with neoadjuvant therapy. Am J Surg Pathol 2017; 41: 1097–104. ArticlePubMedPMC
- 14. Jang JY, Lee JS, Kim HJ, et al. The general rules for the study of primary liver cancer. J Liver Cancer 2017; 17: 19–44. Article
- 15. Lee Y, Park H, Lee H, et al. The clinicopathological and prognostic significance of the gross classification of hepatocellular carcinoma. J Pathol Transl Med 2018; 52: 85–92. ArticlePubMed
- 16. Lencioni R, Llovet JM. Modified RECIST (mRECIST) assessment for hepatocellular carcinoma. Semin Liver Dis 2010; 30: 52–60. ArticlePubMed
- 17. Fanelli GN, Loupakis F, Smyth E, et al. Pathological tumor regression grade classifications in gastrointestinal cancers: role on patients’ prognosis. Int J Surg Pathol 2019; 27: 816–35. ArticlePubMed
- 18. Becker K, Langer R, Reim D, et al. Significance of histopathological tumor regression after neoadjuvant chemotherapy in gastric adenocarcinomas: a summary of 480 cases. Ann Surg 2011; 253: 934–9. PubMed
- 19. Rizk NP, Venkatraman E, Bains MS, et al. American Joint Committee on Cancer staging system does not accurately predict survival in patients receiving multimodality therapy for esophageal adenocarcinoma. J Clin Oncol 2007; 25: 507–12. ArticlePubMed
- 20. Schneider PM, Baldus SE, Metzger R, et al. Histomorphologic tumor regression and lymph node metastases determine prognosis following neoadjuvant radiochemotherapy for esophageal cancer: implications for response classification. Ann Surg 2005; 242: 684–92. PubMedPMC
- 21. Pataer A, Kalhor N, Correa AM, et al. Histopathologic response criteria predict survival of patients with resected lung cancer after neoadjuvant chemotherapy. J Thorac Oncol 2012; 7: 825–32. ArticlePubMedPMC
- 22. Amin MB, Edge S, Greene F, et al. AJCC cancer staging manual. 8th ed. New York: Springer, 2017.
- 23. Shinkawa H, Tanaka S, Takemura S, Ishihara T, Yamamoto K, Kubo S. Tumor size drives the prognosis after hepatic resection of solitary hepatocellular carcinoma without vascular invasion. J Gastrointest Surg 2020; 24: 1040–8. ArticlePubMed
- 24. Marrero JA, Kulik LM, Sirlin CB, et al. Diagnosis, staging, and management of hepatocellular carcinoma: 2018 practice guidance by the American Association for the Study of Liver Diseases. Hepatology 2018; 68: 723–50. ArticlePubMed
- 25. Bruix J, Sherman M, Llovet JM, et al. Clinical management of hepatocellular carcinoma: conclusions of the Barcelona-2000 EASL conference. European Association for the Study of the Liver. J Hepatol 2001; 35: 421–30. PubMed
- 26. Bruix J, Sherman M; Practice Guidelines Committee; American Association for the Study of Liver Diseases. Management of hepatocellular carcinoma. Hepatology 2005; 42: 1208–36. ArticlePubMed
- 27. Gillmore R, Stuart S, Kirkwood A, et al. EASL and mRECIST responses are independent prognostic factors for survival in hepatocellular cancer patients treated with transarterial embolization. J Hepatol 2011; 55: 1309–16. ArticlePubMed
- 28. Kim BK, Kim SU, Kim KA, et al. Complete response at first chemoembolization is still the most robust predictor for favorable outcome in hepatocellular carcinoma. J Hepatol 2015; 62: 1304–10. ArticlePubMed
- 29. Vincenzi B, Di Maio M, Silletta M, et al. Prognostic relevance of objective response according to EASL criteria and mRECIST criteria in hepatocellular carcinoma patients treated with loco-regional therapies: a literature-based meta-analysis. PLoS One 2015; 10: e0133488.ArticlePubMedPMC
- 30. Cucchetti A, Serenari M, Sposito C, et al. Including mRECIST in the Metroticket 2.0 criteria improves prediction of hepatocellular carcinoma-related death after liver transplant. J Hepatol 2020; 73: 342–8. ArticlePubMed
References
Figure & Data
References
Citations
- Construction and validation of a novel signature based on epithelial-mesenchymal transition–related genes to predict prognosis and immunotherapy response in hepatocellular carcinoma by comprehensive analysis of the tumor microenvironment
Biao Gao, Yafei Wang, Shichun Lu
Functional & Integrative Genomics.2023;[Epub] CrossRef - Cellular senescence affects energy metabolism, immune infiltration and immunotherapeutic response in hepatocellular carcinoma
Biao Gao, Yafei Wang, Shichun Lu
Scientific Reports.2023;[Epub] CrossRef
 PubReader
 ePub Link
-
 Cite this Article
- Cite this Article
-
- Close
- Download Citation
- Close
- Figure
-