E-submission
Articles
- Page Path
- HOME > J Pathol Transl Med > Volume 48(3); 2014 > Article
-
Original Article
Expression of CD99 in Multiple Myeloma: A Clinicopathologic and Immunohistochemical Study of 170 Cases - Su-Jin Shin1, Hyangsin Lee2, Geunyoung Jung1, Minchan Gil3, Hosub Park1, Young Soo Park1, Dok Hyun Yoon4, Cheolwon Suh4, Chan-Jeoung Park5, Jooryung Huh1, Chan-Sik Park1,2,3
-
Korean Journal of Pathology 2014;48(3):209-216.
DOI: https://doi.org/10.4132/KoreanJPathol.2014.48.3.209
Published online: June 26, 2014
1Department of Pathology, Asan Medical Center, University of Ulsan College of Medicine, Seoul, Korea.
2Asan Institute for Life Sciences, Asan Medical Center, University of Ulsan College of Medicine, Seoul, Korea.
3Cell Dysfunction Research Center, Asan Medical Center, University of Ulsan College of Medicine, Seoul, Korea.
4Department of Oncology, Asan Medical Center, University of Ulsan College of Medicine, Seoul, Korea.
5Department of Laboratory Medicine, Asan Medical Center, University of Ulsan College of Medicine, Seoul, Korea.
- Corresponding Author: Chan-Sik Park, M.D. Department of Pathology, Asan Medical Center, University of Ulsan College of Medicine, 88 Olympic-ro 43-gil, Songpa-gu, Seoul 138-736, Korea. Tel: +82-2-3010-5838, Fax: +82-2-472-7898, 'csikpark1@gmail.com'
© 2014 The Korean Society of Pathologists/The Korean Society for Cytopathology
This is an Open Access article distributed under the terms of the Creative Commons Attribution Non-Commercial License (http://creativecommons.org/licenses/by-nc/3.0/) which permits unrestricted non-commercial use, distribution, and reproduction in any medium, provided the original work is properly cited.
Abstract
-
Background
- Multiple myeloma (MM) is a heterogeneous and ultimately fatal disease. Risk stratification using prognostic biomarkers is crucial to individualize treatments. We sought to investigate the role of CD99, a transmembrane protein highly expressed in many hematopoietic cells including subpopulations of normal and neoplastic plasma cells, for MM risk stratification.
-
Methods
- CD99 expression was measured in paraffin samples of bone marrow and extramedullary biopsies of 170 patients with MM. Patients were divided into those with high score (moderately and strongly positive) and low score (negative and weakly positive), with all staining being cytoplasmic and/or membranous.
-
Results
- High anti-CD99 immunostaining was observed in 72 of 136 (52.9%) bone marrow biopsies and 24 of 87 (27.6%) extramedullary biopsies in MM. High CD99 expression of extramedullary specimens was associated with significantly longer overall survival (OS; p=.016). High CD99 expression of extramedullary specimens was also associated with better prognosis in the nonautologous stem cell transplantation group of MM patients (p=.044). In multivariate analysis, International Staging System stage was an independent prognostic factor, whereas CD99 expression was no longer statistically significant.
-
Conclusions
- Expression of CD99 in extramedullary specimens was correlated with longer OS, suggesting that CD99 may be a helpful immunohistochemical marker for risk stratification.
- Patients and samples
- Samples were collected from 170 patients diagnosed with multiple myeloma (plasma cell myeloma) and 15 patients diagnosed with plasmacytoma of extramedullary tissue at Asan Medical Center from 2001 to 2008. To minimize the effects of potential confounders, only specimens obtained at initial diagnosis were collected. The specimens included 136 bone marrow biopsy specimens and 102 extramedullary tissue biopsy specimens (87 cases of multiple myeloma and 15 cases of plasmacytoma) and both bone marrow and extramedullary biopsy specimens were available from 53 patients with multiple myeloma. Medical records were reviewed for clinical features, radiologic, laboratory, and pathologic findings, as well as treatment applied and clinical outcomes. Histologic morphology was considered to be of the plasmablastic type when >30% of tumor cells were plasmablastic (patient characteristics are summarized in Table 1).
- Immunohistochemistry and pathologic evaluation
- Paraffin-embedded tissue samples were immunohistochemically stained for CD99 using DAKO Envision-plus kits (Dako, Glostrup, Denmark) following manufacturer's protocols. Briefly, formalin-fixed, paraffin-embedded sections with 4-µm thickness were de-paraffinized and dehydrated through a graded alcohol series, and antigen was retrieved by incubation in citrate buffer for 1 hour at 95℃. The sections were incubated with hydrogen peroxide for 5 minutes and with Dako cytomation protein block for 5 minutes at room temperature. The tissue samples were subsequently incubated with anti-CD99 antibody (1:100, DN16, DiNonA, Suwon, Korea) for 1 hour at room temperature, washed, and incubated with secondary antibody for 1 hour. Antibody binding was visualized by incubation in diaminobenzidine solution for 1 minute, and the sections were counterstained with hematoxylin.
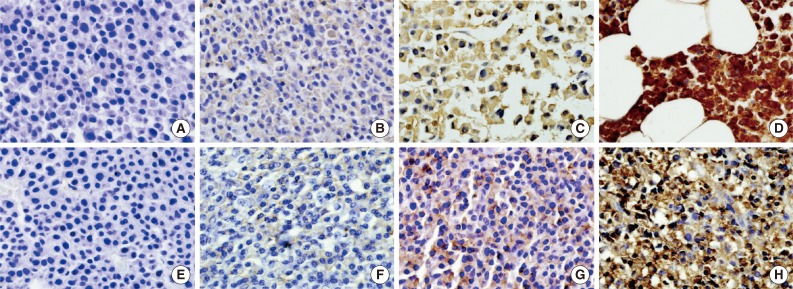
- Immunohistochemical staining for CD99 was evaluated semi-quantitatively by assessing both the intensity and percentage of positive cells. The intensity of membranous or cytoplasmic staining was scored as negative (0), weakly positive (1), moderately positive (2), and strongly positive (3) (Fig. 1). Scoring based on percentage of positive cells was categorized as 0 (<10%), 1 (10% to 40%), 2 (41% to 70%), and 3 (71% to 100%). The final score was obtained by adding the scores for intensity and percentage. Each sample (bone marrow specimen or extramedullary specimen) was subsequently divided into two groups: those with low CD99 expression (score, 0 to 2; negative and weakly positive) and those with high CD99 expression (score, 3 to 6; moderately and strongly positive).
- Statistical analysis
- Correlations between expression of CD99 and categorical variables (age, sex, ISS stage, laboratory results, and bone lesion) were analyzed using Pearson's χ-square test or Fisher's exact test. Survival was analyzed by the Kaplan-Meier method. OS was defined as the time from the date of diagnosis by bone marrow or extramedullary tissue biopsy to the date of death, and recurrence-free survival was defined as the time from the date of diagnosis to the date of first recurrence. Patients lost to follow up or who died of other causes were left out of the analysis. Survival curves of two or more groups were compared by the log-rank test and Cox proportional hazards model. A p<.05 was considered statistically significant. All statistical analyses were performed using SPSS ver. 18 (SPSS Inc., Chicago, IL, USA).
- Ethical permission
- The Institutional Review Board (IRB) of Asan Medical Center (Seoul, Korea) approved the study protocol and provided all necessary ethical permissions.
MATERIALS AND METHODS
- Patient characteristics in plasma cell neoplasm
- Of the 185 plasma cell neoplasms, 170 cases were multiple myelomas (plasma cell myeloma) and 15 cases were plasmacytoma, including nine extramedullary (extraosseous) plasmacytomas and six solitary plasmacytomas of the bone (solitary osseous plasmacytoma). The mean age of patients with multiple myeloma was 60 years (range, 29 to 84 years). The mean ages of patients with extramedullary (extraosseous) and solitary osseous plasmacytomas were 56 years (range, 28 to 74 years) and 57 years (range, 24 to 67 years), respectively. The male to female of patients with multiple myeloma was 1.09:1.
- The clinical characteristics of the 170 multiple myeloma patients are summarized in Table 1. Laboratory results, including serum calcium, protein, and β2-microglobulin concentrations and 24-hour urinary protein, differed widely.
- CD99 expression in plasma cell neoplasms
- Immunohistochemical staining for CD99 showed a membranous and/or cytoplasmic staining pattern. Most CD99 positive bone marrow biopsies showed both cytoplasmic and membranous patterns, whereas most extramedullary biopsies showed a membranous pattern. In multiple myeloma samples, high anti-CD99 immunostaining was observed in 72 of 136 (52.9%) bone marrow and 24 of 87 (27.6%) extramedullary biopsies and there was no significant difference in CD99 expression (p=.365). Both bone marrow and extramedullary biopsy specimens were available from 53 patients with multiple myeloma, and there was no significant distinction or concordance of CD99 expression pattern between consecutive extramedullary and bone marrow samples. In plasmacytoma samples, high anti-CD99 immunostaining was observed in six out of 15 (40%).
- CD99 expression and survival in multiple myeloma patients
- The median follow-up period was 999 days (range, 2 to 4,686 days). At the time of analysis, 129 patients (75.9%) with multiple myeloma had died. When the patients were divided into those with low (score, 0 to 2; negative and weakly positive) and high (score, 3 to 9; moderately and strongly positive) CD99 expression, high CD99 expression in extramedullary biopsies of patients with multiple myeloma tended to be associated with low ISS grade (p=.072). No other clinical prognostic markers were associated with CD99 expression in either bone marrow or extramedullary biopsies (Table 2).
- In the multiple myeloma patients with extramedullary biopsies (n=87), OS was significantly longer in the high CD99 expression (p=.016) group. However, OS was not associated with CD99 expression in multiple myeloma patients with bone marrow biopsies (n=136) (Fig. 2). Univariate analyses of multiple myeloma patients with extramedullary biopsy (n=87) showed that other factors related to poor OS included older age (p=.044), male sex (p=.022), plasmablastic morphology (p=.043), high ISS stage (p<.0001), and high Durie-Salmon stage (p<.0001). Multivariate analysis showed that ISS stage (serum β2-microglobulin) was an independent prognostic factor, whereas high CD99 expression in extramedullary biopsies was not statistically significant (p=.864) (Table 3).
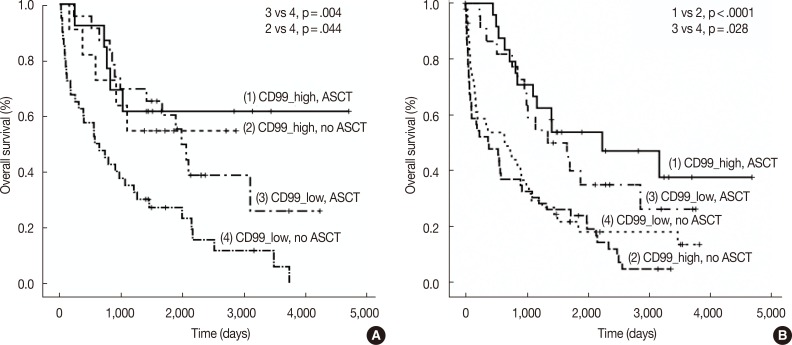
- We also assessed CD99 expression related to ASCT response. Subdivision of patients with low CD99 expression in extramedullary biopsies demonstrated that OS was significantly longer in patients who had undergone ASCT (p=.004). Among patients who did not undergo ASCT, those with high CD99 expression had better OS than those with low CD99 expression (p=.044). Of patients who underwent ASCT, those with high CD99 expression also showed longer OS, but this difference was not statistically significant (p=.476). In patients with high CD99 expression, there was no survival difference between patients who did and did not undergo ASCT (p=.710) (Fig. 3A).
- When we assessed OS in patients from whom we obtained bone marrow biopsies, we found that CD99 expression did not significantly affect patient survival, both in patients with (p=.419) and without (p=.332) ASCT. OS was significantly longer in patients who underwent ASCT than in those who did not, irrespective of CD99 expression (high CD99 group with ASCT vs high CD99 group with no ASCT, p<.0001; low CD99 group with ASCT vs low CD99 with no ASCT, p=.028) (Fig. 3B).
RESULTS
- Recently, the expression and prognostic impact of CD99 were demonstrated in hematolymphoid neoplasms, including DLBCL, Burkitt lymphoma, CD30 negative peripheral T-cell lymphoma, and ALCL.19 We have investigated the prognostic significance of CD99 expression in multiple myeloma and assessed the utility of CD99 immunostaining as a histologic marker for risk stratification. In evaluating the correlation of CD99 expression with various clinical parameters and patient prognosis, we found that OS in patients with multiple myeloma was significantly associated with high CD99 expression in extramedullary specimens, particularly in patients without ASCT. Further, low CD99 expression in extramedullary specimens was associated with high ISS stage.
- Our results partly correspond with previous studies. CD99 immunoreactivity has been associated with better prognosis or lower clinicopathological stages with urothelial carcinoma23 and neuroendocrine carcinomas of the pancreas, stomach, and lung.24,25 However, in lymphoid malignancy, CD99 positivity was reported to be associated with higher risks in patients with DLBCL21 and the non-germinal center B cell-like (GCB) subgroup of diffuse large B-cell lymphoma.26 This discrepancy may be due to several reasons. Multiple myelomas are indolent tumors that grow slowly, whereas DLBCLs are aggressive tumors that grow rapidly. The biological function of CD99 may therefore differ in these tumors, as the functions of CD99 are very diverse. CD99 expression was found to induce apoptosis,27 inhibit anchorage-independent growth, and result in anoikis resistance, and high expression of CD99 was found to contribute to the malignant properties of sarcomas by promoting growth.28 In hematopoietic cells, CD99 mediates T-cell interactions and induces apoptosis,29 whereas, in CD34+ progenitor cells, CD99 promotes cell proliferation and migration.30 Differences in the prognostic associations of CD99 may be due to differences in CD99 signaling pathways among cancer cell type. The function of CD99 and its signaling pathway are not completely understood, indicating the need for further studies of the function and biological significance of CD99 in multiple myeloma and plasma cells.
- We also observed that the association between CD99 expression and patient survival of multiple myeloma differed in bone marrow and extramedullary specimens. There was no significant association between CD99 expression and patient survival in bone marrow samples of multiple myeloma. Discordant prognostic association between CD99 expression and different cancer subtypes has been reported previously. For example, CD99 expression was found to correlate with OS in patients with the GCB subtype of DLBCL, but showed an inverse correlation in patients with the non-GCB subtype.26 According to 2008 World Health Organization (WHO) classification of plasma cell neoplasms, extramedullary involvement of multiple myeloma is generally a manifestation of advanced disease, possibly representing different biological properties.13 CD99 may be involved differently in myeloma-stromal interactions in medullary and extramedullary sites.
- Interestingly, we found that ASCT had no survival benefit in multiple myeloma patients with high CD99 expression in extramedullary specimens, whereas ASCT significantly improved OS in multiple myeloma patients with low CD99 expression in extramedullary specimens. By contrast, ASCT significantly enhanced OS in multiple myeloma patients with both high and low CD99 expression of bone marrow specimens. Aside from age, there are no criteria for selecting candidates for ASCT. Our finding that ASCT is associated with different survival outcomes in patients with high and low extramedullary expression of CD99 suggests that CD99 immunostaining in extramedullary specimens may be helpful in selecting patients for ASCT.
- In conclusion, we have shown that extramedullary CD99 expression in multiple myeloma correlates with good prognosis. CD99 may be a useful immunohistochemical marker in risk stratification.
DISCUSSION
Acknowledgments
Acknowledgments
- 1. Jemal A, Siegel R, Ward E, Murray T, Xu J, Thun MJ. Cancer statistics, 2007. CA Cancer J Clin 2007; 57: 43–66. PMID: 17237035. ArticlePubMed
- 2. Kumar L, Verma R, Radhakrishnan VR. Recent advances in the management of multiple myeloma. Natl Med J India 2010; 23: 210–218. PMID: 21192514. PubMed
- 3. Cavo M, Baccarani M. The changing landscape of myeloma therapy. N Engl J Med 2006; 354: 1076–1078. PMID: 16525146. ArticlePubMed
- 4. Kumar SK, Rajkumar SV, Dispenzieri A, et al. Improved survival in multiple myeloma and the impact of novel therapies. Blood 2008; 111: 2516–2520. PMID: 17975015. ArticlePubMedPMC
- 5. Bergsagel PL, Kuehl WM, Zhan F, Sawyer J, Barlogie B, Shaughnessy J Jr. Cyclin D dysregulation: an early and unifying pathogenic event in multiple myeloma. Blood 2005; 106: 296–303. PMID: 15755896. ArticlePubMedPMC
- 6. Zhan F, Huang Y, Colla S, et al. The molecular classification of multiple myeloma. Blood 2006; 108: 2020–2028. PMID: 16728703. ArticlePubMedPMC
- 7. Barlogie B, Shaughnessy J, Munshi N, Epstein J. Plasma cell myeloma. In : Beutler E, Lichtman M, Coller BS, Kipps TJ, Seligsohn U, eds. Williams hematology. 6th ed. New York: McGraw-Hill, 2001; 1279–1304.
- 8. Inamoto Y, Kurahashi S, Imahashi N, et al. Combinations of cytogenetics and international scoring system can predict poor prognosis in multiple myeloma after high-dose chemotherapy and autologous stem cell transplantation. Am J Hematol 2009; 84: 283–286. PMID: 19338045. ArticlePubMed
- 9. Kleber M, Ihorst G, Udi J, Koch B, Wäsch R, Engelhardt M. Prognostic risk factor evaluation in patients with relapsed or refractory multiple myeloma receiving lenalidomide treatment: analysis of renal function by eGFR and of additional comorbidities by comorbidity appraisal. Clin Lymphoma Myeloma Leuk 2012; 12: 38–48. PMID: 22054851. ArticlePubMed
- 10. Gutiérrez NC, Castellanos MV, Martín ML, et al. Prognostic and biological implications of genetic abnormalities in multiple myeloma undergoing autologous stem cell transplantation: t(4;14) is the most relevant adverse prognostic factor, whereas RB deletion as a unique abnormality is not associated with adverse prognosis. Leukemia 2007; 21: 143–150. PMID: 17024116. ArticlePubMed
- 11. Rajkumar S, Fonseca R, Lacy M, et al. Abnormal cytogenetics predict poor survival after high-dose therapy and autologous blood cell transplantation in multiple myeloma. Bone Marrow Transplant 1999; 24: 497–503. PMID: 10482933. ArticlePubMed
- 12. Fonseca R, Blood E, Rue M, et al. Clinical and biologic implications of recurrent genomic aberrations in myeloma. Blood 2003; 101: 4569–4575. PMID: 12576322. ArticlePubMed
- 13. Swerdlow SH, Campo E, Harris NL, et al. WHO classification of tumours of haematopoietic and lymphoid tissues. 4th ed. Lyon: IARC Press, 2008; 202.
- 14. Stewart AK, Bergsagel PL, Greipp PR, et al. A practical guide to defining high-risk myeloma for clinical trials, patient counseling and choice of therapy. Leukemia 2007; 21: 529–534. PMID: 17230230. ArticlePubMed
- 15. Hamilton G, Fellinger EJ, Schratter I, Fritsch A. Characterization of a human endocrine tissue and tumor-associated Ewing's sarcoma antigen. Cancer Res 1988; 48: 6127–6131. PMID: 2844401. PubMed
- 16. Pan Y, Liu WP, Li JF, et al. A clinicopathological study of 96 cases of lymphoblastic lymphoma. Zhonghua Xue Ye Xue Za Zhi 2005; 26: 218–222. PMID: 15949264. PubMed
- 17. Riopel M, Dickman PS, Link MP, Perlman EJ. MIC2 analysis in pediatric lymphomas and leukemias. Hum Pathol 1994; 25: 396–399. PMID: 8163272. ArticlePubMed
- 18. Zhang PJ, Barcos M, Stewart CC, Block AW, Sait S, Brooks JJ. Immunoreactivity of MIC2 (CD99) in acute myelogenous leukemia and related diseases. Mod Pathol 2000; 13: 452–458. PMID: 10786814. ArticlePubMed
- 19. Buxton D, Bacchi CE, Gualco G, et al. Frequent expression of CD99 in anaplastic large cell lymphoma: a clinicopathologic and immunohistochemical study of 160 cases. Am J Clin Pathol 2009; 131: 574–579. PMID: 19289593. ArticlePubMed
- 20. Sung CO, Ko YH, Park S, Kim K, Kim W. Immunoreactivity of CD99 in non-Hodgkin's lymphoma: unexpected frequent expression in ALK-positive anaplastic large cell lymphoma. J Korean Med Sci 2005; 20: 952–956. PMID: 16361803. ArticlePubMedPMC
- 21. Lee SP, Park S, Park J, Hong J, Ko YH. Clinicopathologic characteristics of CD99-positive diffuse large B-cell lymphoma. Acta Haematol 2011; 125: 167–174. PMID: 21196719. ArticlePubMed
- 22. Park CK, Shin YK, Kim TJ, Park SH, Ahn GH. High CD99 expression in memory T and B cells in reactive lymph nodes. J Korean Med Sci 1999; 14: 600–606. PMID: 10642936. ArticlePubMedPMC
- 23. Xuan Y, Kim S, Lin Z. Protein expression and gene promoter hypermethylation of CD99 in transitional cell carcinoma of urinary bladder. J Cancer Res Clin Oncol 2011; 137: 49–54. PMID: 20217126. ArticlePubMed
- 24. Goto A, Niki T, Terado Y, Fukushima J, Fukayama M. Prevalence of CD99 protein expression in pancreatic endocrine tumours (PETs). Histopathology 2004; 45: 384–392. PMID: 15469477. ArticlePubMed
- 25. Pelosi G, Fraggetta F, Sonzogni A, Fazio N, Cavallon A, Viale G. CD99 immunoreactivity in gastrointestinal and pulmonary neuroendocrine tumours. Virchows Arch 2000; 437: 270–274. PMID: 11037347. ArticlePubMed
- 26. Hong J, Park S, Park J, et al. CD99 expression and newly diagnosed diffuse large B-cell lymphoma treated with rituximab-CHOP immunochemotherapy. Ann Hematol 2012; 91: 1897–1906. PMID: 22864685. ArticlePubMed
- 27. Scotlandi K, Baldini N, Cerisano V, et al. CD99 engagement: an effective therapeutic strategy for Ewing tumors. Cancer Res 2000; 60: 5134–5142. PMID: 11016640. PubMed
- 28. Kreppel M, Aryee DN, Schaefer KL, et al. Suppression of KCMF1 by constitutive high CD99 expression is involved in the migratory ability of Ewing's sarcoma cells. Oncogene 2006; 25: 2795–2800. PMID: 16314831. ArticlePubMed
- 29. Kim MK, Choi YL, Kim MK, et al. MHC class II engagement inhibits CD99-induced apoptosis and up-regulation of T cell receptor and MHC molecules in human thymocytes and T cell line. FEBS Lett 2003; 546: 379–384. PMID: 12832073. ArticlePubMed
- 30. Imbert AM, Belaaloui G, Bardin F, Tonnelle C, Lopez M, Chabannon C. CD99 expressed on human mobilized peripheral blood CD34+ cells is involved in transendothelial migration. Blood 2006; 108: 2578–2586. PMID: 16825498. ArticlePubMed
References

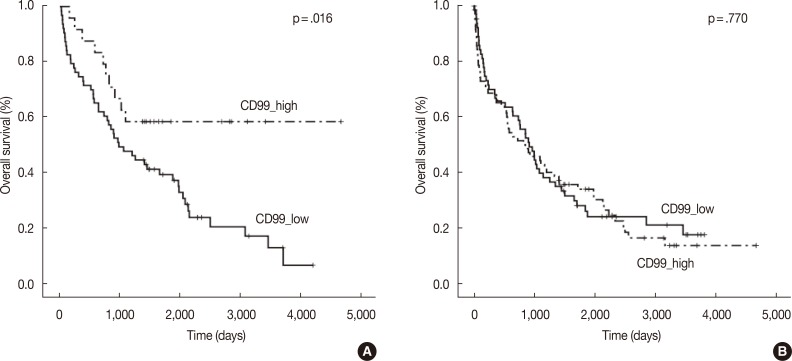

Figure & Data
References
Citations
- Cell Adhesion Molecule CD99 in Cancer Immunotherapy
Feng Yu, Guodong Liu, Hailing Zhang, Xiaoyan Wang, Zhi Wu, Qinggang Xu, Yan Wu, Dongfeng Chen
Current Molecular Medicine.2023; 23(10): 1028. CrossRef - Detection of Circulating Tumor Plasma Cells in Monoclonal Gammopathies: Methods, Pathogenic Role, and Clinical Implications
Luzalba Sanoja-Flores, Juan Flores-Montero, Martín Pérez-Andrés, Noemí Puig, Alberto Orfao
Cancers.2020; 12(6): 1499. CrossRef - Tumor suppressor CD99 is downregulated in plasma cell neoplasms lacking CCND1 translocation and distinguishes neoplastic from normal plasma cells and B-cell lymphomas with plasmacytic differentiation from primary plasma cell neoplasms
Qi Gao, Venkata Yellapantula, Maly Fenelus, Janine Pichardo, Lu Wang, Ola Landgren, Ahmet Dogan, Mikhail Roshal
Modern Pathology.2018; 31(6): 881. CrossRef - EWSR1 fusion proteins mediate PAX7 expression in Ewing sarcoma
Gregory W Charville, Wei-Lien Wang, Davis R Ingram, Angshumoy Roy, Dafydd Thomas, Rajiv M Patel, Jason L Hornick, Matt van de Rijn, Alexander J Lazar
Modern Pathology.2017; 30(9): 1312. CrossRef - Activation of the polycomb repressive complex pathway in the bone marrow resident cells of diffuse large B-cell lymphoma patients
Eun Ji Oh, Eun Kyung Kim, Woo Ick Yang, Sun Och Yoon
Leukemia & Lymphoma.2016; 57(8): 1921. CrossRef - CD99 Is Strongly Expressed in Basal Cells of the Normal Adult Epidermis and Some Subpopulations of Appendages: Comparison with Developing Fetal Skin
Gawon Choi, Jin Roh, Chan-Sik Park
Journal of Pathology and Translational Medicine.2016; 50(5): 361. CrossRef - Towards Stratified Medicine in Plasma Cell Myeloma
Philip Egan, Stephen Drain, Caroline Conway, Anthony Bjourson, H. Alexander
International Journal of Molecular Sciences.2016; 17(10): 1760. CrossRef - Human Myeloma Cell Lines Induce Osteoblast Downregulation of CD99 Which Is Involved in Osteoblast Formation and Activity
Angela Oranger, Giacomina Brunetti, Claudia Carbone, Graziana Colaianni, Teresa Mongelli, Isabella Gigante, Roberto Tamma, Giorgio Mori, Adriana Di Benedetto, Marika Sciandra, Selena Ventura, Katia Scotlandi, Silvia Colucci, Maria Grano
Journal of Immunology Research.2015; 2015: 1. CrossRef - CD99 regulates CXCL12-induced chemotaxis of human plasma cells
Minchan Gil, Hyo-Kyung Pak, A-Neum Lee, Seo-Jung Park, Yoonkyung Lee, Jin Roh, Hyunji Lee, Yoo-Sam Chung, Chan-Sik Park
Immunology Letters.2015; 168(2): 329. CrossRef
 PubReader
 Cite this Article