E-submission
Articles
- Page Path
- HOME > J Pathol Transl Med > Volume 48(4); 2014 > Article
-
Original Article
Differential Features of Microsatellite-Unstable Colorectal Carcinomas Depending on EPCAM Expression Status - Jung Ho Kim1, Jeong Mo Bae2, Kyung-Ju Kim2, Ye-Young Rhee2, Younghoon Kim2, Nam-Yun Cho3, Hye Seung Lee4, Mee Soo Chang1,2, Gyeong Hoon Kang2,3
-
Korean Journal of Pathology 2014;48(4):276-282.
DOI: https://doi.org/10.4132/KoreanJPathol.2014.48.4.276
Published online: August 26, 2014
1Department of Pathology, SMG-SNU Boramae Medical Center, Seoul, Korea.
2Department of Pathology, Seoul National University College of Medicine, Seoul, Korea.
3Laboratory of Epigenetics, Cancer Research Institute, Seoul National University College of Medicine, Seoul, Korea.
4Department of Pathology, Seoul National University Bundang Hospital, Seongnam, Korea.
- Corresponding Author: Gyeong Hoon Kang, M.D. Department of Pathology, Seoul National University College of Medicine, 103 Daehak-ro, Jongno-gu, Seoul 110-799, Korea. Tel: +82-2-740-8263, Fax: +82-2-765-5600, 'ghkang@snu.ac.kr'
• Received: May 27, 2014 • Revised: June 24, 2014 • Accepted: June 25, 2014
© 2014 The Korean Society of Pathologists/The Korean Society for Cytopathology
This is an Open Access article distributed under the terms of the Creative Commons Attribution Non-Commercial License (http://creativecommons.org/licenses/by-nc/3.0/) which permits unrestricted non-commercial use, distribution, and reproduction in any medium, provided the original work is properly cited.
Abstract
-
Background
- Recent studies have revealed that a small subset of Lynch syndrome-associated colorectal carcinomas (CRCs) is caused by a germline EPCAM deletion-induced MSH2 epimutation. Based on the finding of this genetic alteration, we investigated the implications of EPCAM expression changes in microsatellite instability-high (MSI-H) CRCs.
-
Methods
- Expression of EPCAM and DNA mismatch repair proteins was assessed by immunohistochemistry in 168 MSI-H CRCs. Using DNA samples of these tumors, MLH1 promoter methylation status was also determined by methylation-specific real-time polymerase chain reaction method (MethyLight).
-
Results
- Among 168 MSI-H CRCs, complete loss (CL) and focal loss (FL) of EPCAM expression was observed in two (1.2%) and 22 (13.1%) cases, respectively. Both of the EPCAM-CL cases were found in MSH2-negative tumors without MLH1 promoter methylation. However, only nine of the 22 EPCAM-FL tumors had MSH2 deficiency. Of the 22 EPCAM-FL tumors, 13 showed MLH1 loss, and among them, nine cases were determined to have MLH1 methylation. EPCAM-FL was significantly associated with advanced stage (p=.043), distant metastasis (p=.003), poor differentiation (p=.001), and signet ring cell component (p=.004).
-
Conclusions
- Loss of EPCAM expression is differentially associated with clinicopathological and molecular features, depending on the completeness of the loss, in MSI-H CRCs.
- Study samples
- Tissue collection and MSI analysis were conducted as previously described.12 Formalin-fixed, paraffin-embedded (FFPE) tissues of 168 MSI-H CRC cases were retrieved from the pathology archives of our hospitals. All tissue samples originated from patients who received curative surgery for CRC between 2004 and 2007, and were previously diagnosed as MSI-H through DNA testing using microsatellite markers recommended in the Bethesda guidelines (BAT-25, BAT-26, D5S346, D17S250, and D2S123).13 Microsatellite length alteration of two or more markers in a tumor determined MSI-H status. This study was approved by the Institutional Review Board (IRB No. H-1203-072-402).
- Clinicopathological data
- Collection and assessment of clinicopathological data were carried out as previously described.12 Clinical data including age, gender, tumor location, gross tumor type, tumor multiplicity, and TNM stage were collected from the medical records. Histopathological data, including lymphovascular invasion, perineural invasion, tumor grade (histological differentiation based on gland formation), extracellular mucin component, signet ring cell carcinoma component, and medullary carcinoma component, were evaluated by microscopic review of hematoxylin and eosin-stained tissue slides of the 168 MSI-H CRCs.
- Immunohistochemistry
- A tissue microarray (TMA) was constructed as previously described.12 Three different areas of tumor from each MSI-H CRC tissue were extracted as tissue cores for the construction of TMA blocks (Superbiochips Laboratories, Seoul, Korea). Immunostaining with antibodies against MLH1 (DAKO, Glostrup, Denmark), MSH2 (Invitrogen, Camarillo, CA, USA), PMS2 (Ventana Medical Systems, Tucson, AZ, USA), MSH6 (Ventana Medical Systems), and EPCAM (Ber-EP4 clone, Ventana Medical Systems) was performed on the TMA blocks. An automated IHC method was applied using the BenchMark XT immunostainer (Ventana Medical Systems) according to the manufacturer's protocol. The expression of MLH1/MSH2/PMS2/MSH6 proteins was interpreted as negative (loss) or positive (retained). Nuclear staining in tumor cells should be observed for the determination of positivity of MLH1/MSH2/PMS2/MSH6 proteins. EPCAM protein expression status was assessed to be negative (loss) or positive (retained). The normal expression pattern of the EPCAM protein is cytoplasmic and membranous staining. Complete loss of EPCAM expression (EPCAM-CL) was determined when negative staining was observed in 100% of tumor cells in all three tissue cores of an individual case. Focal loss of EPCAM expression (EPCAM-FL) was determined when negative staining was observed in 10% to 99% of tumor cells in all three tissue cores of an individual case. A case showing negative staining of EPCAM in less than 10% of tumor cells was determined to have retained EPCAM expression. All of the EPCAM-CL cases, which were initially determined by EPCAM IHC on TMA blocks, were confirmed by EPCAM IHC on the original FFPE tissue blocks (at least two representative tumor sections).
- Genomic DNA extraction and bisulfite modification
- DNA isolation from FFPE tissues and bisulfite modification of the extracted DNA were performed as previously described.14 Briefly, manually microdissected tumor tissues of the 168 MSI-H CRCs were digested in lysis buffer (proteinase K 3 mg/mL) and digestion solution (50 mM Tris, 1 mM EDTA, pH 8.0, and 1% Tween-20), and incubated at 55℃ overnight (up to 48 hours). The samples were then incubated at 95℃ to inactivate the proteinase K. The extracted genomic DNA was stored at -20℃ until use. Next, as a preparative stage for DNA methylation analysis, sodium bisulfite modification of genomic DNA was performed using the EZ DNA methylation kit (Zymo Research, Orange, CA, USA) according to the manufacturer's protocol.
- MLH1 methylation analysis
- MLH1 methylation analysis was conducted as previously described.14 Briefly, a methylation-specific real-time polymerase chain reaction method (MethyLight assay) was used for the precise quantitative measurement of promoter CpG island methylation of the MLH1 gene in bisulfite-modified DNA samples from each of the 168 MSI-H CRCs. Primers and probes used for the MLH1-MethyLight assay were designed according to a previous study.15 Hypermethylation of a CpG island locus in the promoter of the MLH1 gene was defined when the percentage of the methylated reference value was >4.
- Statistical analysis
- SPSS ver. 20 (IBM SPSS Statistics, Armonk, NY, USA) was used for all statistical analyses. Comparisons of the categorical variables were analyzed using a chi-square test or Fisher's exact test. All p-values were two-sided, and statistical significance was established at p<.05.
MATERIALS AND METHODS
- EPCAM loss and clinicopathological features in MSI-H CRCs
- Among the 168 MSI-H CRCs, the frequencies of EPCAM-CL and EPCAM-FL tumors were two (1.2%) and 22 (13.1%) cases, respectively. Completely negative EPCAM IHC was also observed in whole tumor sections of the two EPCAM-CL cases. The clinicopathological features of the 168 MSI-H CRCs according to EPCAM expression status are summarized in Table 1. Notably, EPCAM-FL tumors were significantly associated with higher stage (stage III/IV, p=.043), distant metastasis (p=.003), poor tumor differentiation (p=.001), and a signet ring cell carcinoma component (p=.004) (Table 1). In addition, although there was a lack of statistical significance, EPCAM-FL tumors demonstrated a tendency toward the presence of lymph node metastasis (pN1/pN2; p=.064) (Table 1).
- EPCAM loss and molecular features in MSI-H CRCs
- The molecular features of the 168 MSI-H CRCs, according to EPCAM expression status, are summarized in Table 2. Both of the EPCAM-CL tumors demonstrated a loss of MSH2/MSH6 expression, retained MLH1/PMS2 expression, and absence of MLH1 promoter methylation (Table 2, Fig. 1). In contrast, only 41% of EPCAM-FL tumors showed loss of MSH2 expression (nine of 22) (Table 2). Alternatively, a substantial number of EPCAM-FL tumors demonstrated loss of MLH1/PMS2 expression with retained MSH2 expression (13 of 22, 59%) (Table 2, Fig. 2). Among the 13 MLH1-negative EPCAM-FL tumors, nine cases showed MLH1 promoter methylation (Table 2).
RESULTS
- EPCAM is a type I transmembrane glycoprotein that is functionally involved in the intercellular adhesion of epithelial cells. EPCAM is characterized by its specific expression in normal epithelial cells and epithelium-derived tumors across various tissue types. Therefore, EPCAM has been clinically explored as a putative diagnostic marker for the detection of circulating or metastasizing carcinoma cells in blood or body fluid of cancer patients and as a potential therapeutic target.16 In terms of pathological practice, IHC staining for EPCAM can be used as a supportive marker in the differentiation of adenocarcinoma from other mimicking tumors such as mesothelioma.17 Interestingly, it has been suggested that EPCAM-positive tumor cells can be regarded as tumor-initiating cells in some tumor types, particularly in hepatocellular carcinoma.18,19 Moreover, it has also been reported that both EPCAM-positivity and -negativity are associated with advanced stage and/or poor survival in several malignancies.16 Collectively, elucidating the biological roles and clinicopathological implications of EPCAM expression alterations in various cancers represents an important research topic. Although it is understood that EPCAM expression is generally observed in the majority of CRCs, the characteristics of CRCs associated with a lack of EPCAM expression remain poorly studied. Several recent studies have provided interesting findings regarding the association between EPCAM loss and germline EPCAM deletions in a subset of MSH2-negative Lynch syndrome CRCs.9,10,11 Indeed, although germline EPCAM deletion has recently been established as one of the molecular causes of Lynch syndrome CRCs, there are still insufficient epidemiological and clinicopathological data about this unique molecular subtype of Lynch syndrome tumors throughout diverse countries and ethnic groups. In particular, investigations concerning EPCAM deletion and/or EPCAM loss in MSI-H CRC have not been conducted in Korean patients. Therefore, we investigated the correlation of EPCAM loss with various clinicopathological and molecular factors in a large series of MSI-H CRCs, including both Lynch syndrome-associated MSI-H CRCs as well as sporadic MSI-H CRCs. In the present study, we successfully collected and presented novel data regarding differential features of MSI-H CRCs depending on the EPCAM immunophenotype in Korean patients.
- The EPCAM gene is located in the region immediately upstream of the MSH2 gene. Thus, deletions of the 3' end of the EPCAM gene in EPCAM-expressing cells can lead to transcriptional read-through and can induce promoter hypermethylation of the MSH2 gene.5 A previous study by Huth et al.10 reported that a loss of EPCAM expression in Lynch syndrome-associated CRC required biallelic deletions in the EPCAM gene and could be detected in the precancerous adenoma stage of EPCAM deletion carriers. A recent investigation by Musulen et al.11 also found high specificity of EPCAM protein loss for the detection of germline EPCAM deletion in MSH2-negative Lynch syndrome CRCs, and suggested including EPCAM IHC in routine diagnostic screening of Lynch syndrome. On the basis of these findings, MSH2 negativity of EPCAM-CL tumors in our study may be strongly indicative of germline EPCAM deletion-associated Lynch syndrome tumors. Although we did not conduct mutation analysis to determine EPCAM deletion status of our MSI-H CRC samples, our future investigation would additionally reveal the detailed relationship between EPCAM loss patterns and germline EPCAM deletions in CRCs.
- The most remarkable finding in the present study was the correlation between the EPCAM-FL immunophenotype and aggressive pathological features in MSI-H CRC. EPCAM-FL tumors were significantly associated with stage III/IV, distant metastasis, poorly differentiated histology, and signet ring cell carcinoma component (Tables 1). More fundamentally, in terms of molecular background, among the 22 EPCAM-FL cancers, only nine cases were MSH2-deficient tumors. Another nine cases were determined to have MLH1 methylation. These molecular features imply that focal loss of EPCAM expression can occur in sporadic MSI-H CRCs in contrast with the EPCAM-CL immunophenotype. Because sporadic hypermethylated MSI-H CRCs were histologically associated with poor differentiation and a signet ring cell carcinoma component according to our previous study,20 the close correlation between these pathological features and EPCAM-FL tumors is a plausible finding. To elucidate the underlying molecular mechanism and molecular heterogeneity of the EPCAM-FL phenotype in CRCs, additional studies should be performed to identify genetic and epigenetic factors that affect EPCAM gene expression alterations.
- In summary, the EPCAM-CL phenotype in MSI-H CRC is associated with MSH2 deficiency, and this finding strongly indicates the possibility that Lynch syndrome-associated CRCs have germline EPCAM deletion-associated MSH2 silencing. By contrast, a considerable portion of EPCAM-FL tumors demonstrated MLH1 methylation and aggressive pathological features. Further evaluations to clarify molecular mechanisms of complete loss and focal loss of EPCAM expression in CRCs are necessary, with an emphasis on their potential associations with genetic or epigenetic aberrations in the EPCAM gene.
DISCUSSION
Acknowledgments
Acknowledgments
- 1. Bosman FT, Carneiro F, Hruban RH, Theise ND. WHO classification of tumours of the digestive system. 4th ed. Lyon: IARC Press, 2010.
- 2. Boland CR, Goel A. Microsatellite instability in colorectal cancer. Gastroenterology 2010; 138: 2073–2087.e3. PMID: 20420947. ArticlePubMedPMC
- 3. de la Chapelle A, Hampel H. Clinical relevance of microsatellite instability in colorectal cancer. J Clin Oncol 2010; 28: 3380–3387. PMID: 20516444. ArticlePubMedPMC
- 4. Pino MS, Chung DC. Microsatellite instability in the management of colorectal cancer. Expert Rev Gastroenterol Hepatol 2011; 5: 385–399. PMID: 21651356. ArticlePubMed
- 5. Ligtenberg MJ, Kuiper RP, Chan TL, et al. Heritable somatic methylation and inactivation of MSH2 in families with Lynch syndrome due to deletion of the 3' exons of TACSTD1. Nat Genet 2009; 41: 112–117. PMID: 19098912. ArticlePubMed
- 6. Chan TL, Yuen ST, Kong CK, et al. Heritable germline epimutation of MSH2 in a family with hereditary nonpolyposis colorectal cancer. Nat Genet 2006; 38: 1178–1183. PMID: 16951683. ArticlePubMed
- 7. Tutlewska K, Lubinski J, Kurzawski G. Germline deletions in the EPCAM gene as a cause of Lynch syndrome: literature review. Hered Cancer Clin Pract 2013; 11: 9PMID: 23938213. ArticlePubMedPMCPDF
- 8. Ligtenberg MJ, Kuiper RP, Geurts van Kessel A, Hoogerbrugge N. EPCAM deletion carriers constitute a unique subgroup of Lynch syndrome patients. Fam Cancer 2013; 12: 169–174. PMID: 23264089. ArticlePubMed
- 9. Kloor M, Voigt AY, Schackert HK, Schirmacher P, von Knebel Doeberitz M, Bläker H. Analysis of EPCAM protein expression in diagnostics of Lynch syndrome. J Clin Oncol 2011; 29: 223–227. PMID: 21115857. ArticlePubMed
- 10. Huth C, Kloor M, Voigt AY, et al. The molecular basis of EPCAM expression loss in Lynch syndrome-associated tumors. Mod Pathol 2012; 25: 911–916. PMID: 22388758. ArticlePubMed
- 11. Musulen E, Blanco I, Carrato C, et al. Usefulness of epithelial cell adhesion molecule expression in the algorithmic approach to Lynch syndrome identification. Hum Pathol 2013; 44: 412–416. PMID: 23026194. ArticlePubMed
- 12. Kim JH, Kim KJ, Rhee YY, et al. Expression status of wild-type HSP110 correlates with HSP110 T17 deletion size and patient prognosis in microsatellite-unstable colorectal cancer. Mod Pathol 2014; 27: 443–453. PMID: 24030751. ArticlePubMed
- 13. Boland CR, Thibodeau SN, Hamilton SR, et al. A National Cancer Institute Workshop on Microsatellite Instability for cancer detection and familial predisposition: development of international criteria for the determination of microsatellite instability in colorectal cancer. Cancer Res 1998; 58: 5248–5257. PMID: 9823339. PubMed
- 14. Kim JH, Rhee YY, Bae JM, et al. Subsets of microsatellite-unstable colorectal cancers exhibit discordance between the CpG island methylator phenotype and MLH1 methylation status. Mod Pathol 2013; 26: 1013–1022. PMID: 23370766. ArticlePubMed
- 15. Weisenberger DJ, Siegmund KD, Campan M, et al. CpG island methylator phenotype underlies sporadic microsatellite instability and is tightly associated with BRAF mutation in colorectal cancer. Nat Genet 2006; 38: 787–793. PMID: 16804544. ArticlePubMed
- 16. Patriarca C, Macchi RM, Marschner AK, Mellstedt H. Epithelial cell adhesion molecule expression (CD326) in cancer: a short review. Cancer Treat Rev 2012; 38: 68–75. PMID: 21576002. ArticlePubMed
- 17. Carella R, Deleonardi G, D'Errico A, et al. Immunohistochemical panels for differentiating epithelial malignant mesothelioma from lung adenocarcinoma: a study with logistic regression analysis. Am J Surg Pathol 2001; 25: 43–50. PMID: 11145250. ArticlePubMed
- 18. Imrich S, Hachmeister M, Gires O. EpCAM and its potential role in tumor-initiating cells. Cell Adh Migr 2012; 6: 30–38. PMID: 22647938. ArticlePubMedPMC
- 19. Yamashita T, Ji J, Budhu A, et al. EpCAM-positive hepatocellular carcinoma cells are tumor-initiating cells with stem/progenitor cell features. Gastroenterology 2009; 136: 1012–1024. PMID: 19150350. ArticlePubMed
- 20. Bae JM, Kim MJ, Kim JH, et al. Differential clinicopathological features in microsatellite instability-positive colorectal cancers depending on CIMP status. Virchows Arch 2011; 459: 55–63. PMID: 21494758. ArticlePubMed
References
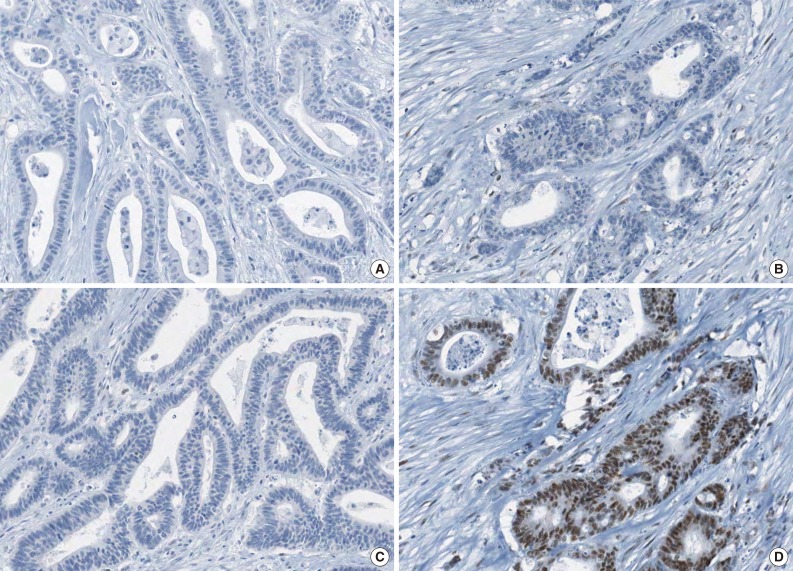
Fig. 1A representative case of microsatellite instability-high colorectal carcinoma demonstrating complete loss of EPCAM expression and MSH2 deficiency. Note the complete loss of EPCAM expression (A), loss of MSH2 expression (B), loss of MSH6 expression (C), and retained MLH1 expression (D).

Fig. 2A representative case of microsatellite instability-high colorectal carcinoma demonstrating focal loss of EPCAM expression and MLH1 promoter methylation. Note the focal loss of EPCAM expression (A), loss of MLH1 expression (B), loss of PMS2 expression (C), and retained MSH2 expression (D).
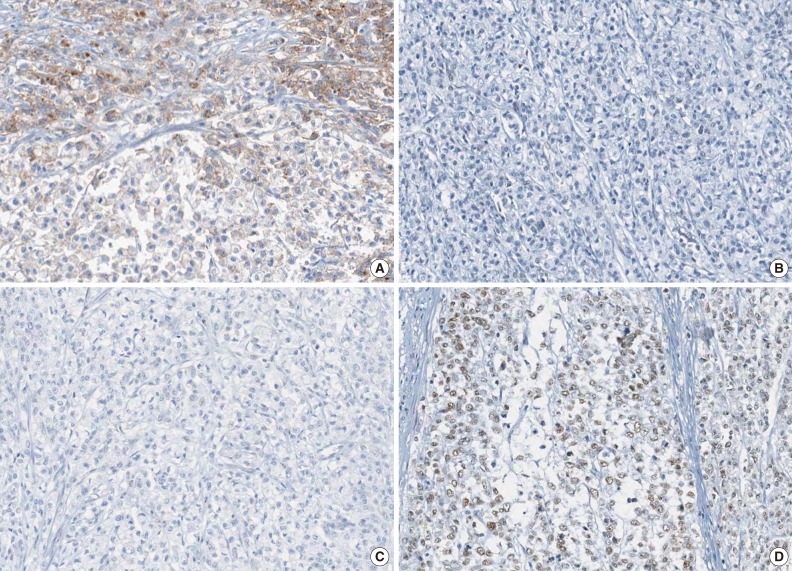
Table 1.Clinicopathological characteristics of MSI-H CRCs according to EPCAM expression status
Table 2.Molecular characteristics of MSI-H CRCs according to EPCAM expression status
Figure & Data
References
Citations
Citations to this article as recorded by 
- Unraveling the multifaceted role of EpCAM in colorectal cancer: an integrated review of its function and interplay with non-coding RNAs
Xingyu Jiang, Sumeng Wang, Qi Liang, Yiqian Liu, Lingxiang Liu
Medical Oncology.2023;[Epub] CrossRef - Outcomes of Definitive Treatment of Signet Ring Cell Carcinoma of the Rectum: Is Minimal Invasive Surgery Detrimental in Signet Ring Rectal Cancers?
S. Raghavan, Deepak Kumar Singh, J. Rohila, A. DeSouza, R. Engineer, A. Ramaswamy, V. Ostwal, A. Saklani
Indian Journal of Surgical Oncology.2020; 11(4): 597. CrossRef - Evaluation of the Role of Circulating Tumor Cells and Microsatellite Instability Status in Predicting Outcome of Advanced CRC Patients
Ippokratis Messaritakis, Maria Sfakianaki, Konstantinos Vogiatzoglou, Asimina Koulouridi, Chara Koutoulaki, Dimitrios Mavroudis, Maria Tzardi, Nikolaos Gouvas, John Tsiaoussis, John Souglakos
Journal of Personalized Medicine.2020; 10(4): 235. CrossRef - Is Ep-CAM Expression a Diagnostic and Prognostic Biomarker for Colorectal Cancer? A Systematic Meta-Analysis
Susu Han, Shaoqi Zong, Qi Shi, Hongjia Li, Shanshan Liu, Wei Yang, Wen Li, Fenggang Hou
EBioMedicine.2017; 20: 61. CrossRef - Prognostic factors in sporadic colon cancer with high-level microsatellite instability
Bo Young Oh, Jung Wook Huh, Yoon Ah Park, Yong Beom Cho, Seong Hyeon Yun, Hee Cheol Kim, Woo Yong Lee, Ho-Kyung Chun
Surgery.2016; 159(5): 1372. CrossRef - Clinical significance of fibroblast growth factor receptor 2 expression in patients with residual rectal cancer after preoperative chemoradiotherapy: relationship with KRAS or BRAF mutations and MSI status
Ghilsuk Yoon, Hwayoung Lee, Jae-Hoon Kim, Keun Hur, An Na Seo
Tumor Biology.2016; 37(8): 10209. CrossRef - Subcellular differential expression of Ep-ICD in oral dysplasia and cancer is associated with disease progression and prognosis
Raj Thani Somasundaram, Jatinder Kaur, Iona Leong, Christina MacMillan, Ian J. Witterick, Paul G. Walfish, Ranju Ralhan
BMC Cancer.2016;[Epub] CrossRef - BRAF, PIK3CA, and HER2 Oncogenic Alterations According to KRAS Mutation Status in Advanced Colorectal Cancers with Distant Metastasis
Soo Kyung Nam, Sumi Yun, Jiwon Koh, Yoonjin Kwak, An Na Seo, Kyoung Un Park, Duck-Woo Kim, Sung-Bum Kang, Woo Ho Kim, Hye Seung Lee, Wayne A Phillips
PLOS ONE.2016; 11(3): e0151865. CrossRef - Twist1-induced epithelial-mesenchymal transition according to microsatellite instability status in colon cancer cells
Bo Young Oh, So-Young Kim, Yeo Song Lee, Hye Kyung Hong, Tae Won Kim, Seok Hyung Kim, Woo Yong Lee, Yong Beom Cho
Oncotarget.2016; 7(35): 57066. CrossRef - Clinicopathologic, molecular, and prognostic implications of the loss of EPCAM expression in colorectal carcinoma
Jung Ho Kim, Jeong Mo Bae, Young Seok Song, Nam-Yun Cho, Hye Seung Lee, Gyeong Hoon Kang
Oncotarget.2016; 7(12): 13372. CrossRef - Pathologic Factors Associated with Prognosis after Adjuvant Chemotherapy in Stage II/III Microsatellite-Unstable Colorectal Cancers
Jung Ho Kim, Jeong Mo Bae, Hyeon Jeong Oh, Hye Seung Lee, Gyeong Hoon Kang
Journal of Pathology and Translational Medicine.2015; 49(2): 118. CrossRef - HER3 protein expression in relation to HER2 positivity in patients with primary colorectal cancer: clinical relevance and prognostic value
An Na Seo, Yoonjin Kwak, Woo Ho Kim, Duck-Woo Kim, Sung-Bum Kang, Gheeyoung Choe, Hye Seung Lee
Virchows Archiv.2015; 466(6): 645. CrossRef - Clinical and prognostic value of MET gene copy number gain and chromosome 7 polysomy in primary colorectal cancer patients
An Na Seo, Kyoung Un Park, Gheeyoung Choe, Woo Ho Kim, Duck-Woo Kim, Sung-Bum Kang, Hye Seung Lee
Tumor Biology.2015; 36(12): 9813. CrossRef - c-MYC Copy-Number Gain Is an Independent Prognostic Factor in Patients with Colorectal Cancer
Kyu Sang Lee, Yoonjin Kwak, Kyung Han Nam, Duck-Woo Kim, Sung-Bum Kang, Gheeyoung Choe, Woo Ho Kim, Hye Seung Lee, Andreas Krieg
PLOS ONE.2015; 10(10): e0139727. CrossRef - Nuclear Ep-ICD accumulation predicts aggressive clinical course in early stage breast cancer patients
Gunjan Srivastava, Jasmeet Assi, Lawrence Kashat, Ajay Matta, Martin Chang, Paul G Walfish, Ranju Ralhan
BMC Cancer.2014;[Epub] CrossRef
 PubReader
 ePub Link
-
 Cite this Article
- Cite this Article
-
- Close
- Download Citation
- Close
- Figure
-