Prognostic Significance of Absolute Lymphocyte Count/Absolute Monocyte Count Ratio at Diagnosis in Patients with Multiple Myeloma
Article information
Abstract
Background
Absolute lymphocyte count (ALC) in peripheral blood has recently been reported to be an independent prognostic factor in multiple myeloma (MM). Previous studies indicated that the absolute monocyte count (AMC) in peripheral blood reflects the state of the tumor microenvironment in lymphomas. Neither the utility of the AMC nor its relationship with ALC has been studied in MM.
Methods
The prognostic value of ALC, AMC, and the ALC/AMC ratio at the time of diagnosis was retrospectively examined in 189 patients with MM.
Results
On univariate analysis, low ALC (<1,400 cells/µL), high AMC (≥490 cells/µL), and low ALC/AMC ratio (<2.9) were correlated with worse overall survival (OS) (p=.002, p=.038, and p=.001, respectively). On multivariate analysis, the ALC/AMC ratio was an independent prognostic factor (p=.047), whereas ALC and AMC were no longer statistical significant. Low ALC, high AMC, and low ALC/AMC ratio were associated with poor prognostic factors such as high International Staging System stage, plasmablastic morphology, hypoalbuminemia, and high β2-microglobulin.
Conclusions
Univariate analysis demonstrated that changes in ALC, AMC, and the ALC/AMC ratio are associated with patient survival in MM. Multivariate analysis showed that, of these factors, the ALC/AMC ratio was an independent prognostic factor for OS.
Absolute lymphocyte count (ALC) in peripheral blood may reflect the body's immune surveillance potential against cancer cells. Recent studies suggest that ALC, as a surrogate marker for host immune status, has prognostic significance in cancer patients. In multiple myeloma (MM), ALC recovery after autologous stem cell transplantation (ASCT) has been reported to be of significant prognostic value.1,2 Furthermore, a recent study showed that ALC at the time of diagnosis was associated with survival in newly diagnosed MM patients.3
In recent years, the importance of the bone marrow (BM) microenvironment in MM has become increasingly apparent. The BM microenvironment provides a 'niche' that supports growth and survival of myeloma cells, and influences their migration and drug resistance.4,5 Among stromal cells in the microenvironment, inflammatory cells play an essential role in tumor progression.6 Tumor-associated macrophages (TAMs), which constitute a significant proportion of tumor-related inflammatory cells, have been linked to the growth, angiogenesis and metastasis of a variety of tumors.7 TAMs secrete factors that directly promote tumor cell proliferation and, by acting on endothelial cells, they also promote tumor neovascularization, which enables tumor progression.8
A prognostic role for TAMs has been reported in patients with classical Hodgkin lymphoma (HL),9,10 diffuse large B-cell lymphoma (DLBCL),11 follicular lymphoma (FL)12 and MM.13 TAMs are derived from circulating monocytes and are recruited to the tumor site by tumor-derived chemotactic factors.14,15 Since the number of circulating monocytes and the TAM content are influenced by tumor-derived chemotactic factors, the peripheral blood absolute monocyte count (AMC) may reflect the level of TAM recruitment, and therefore may have potential value as a surrogate marker for TAMs. In support of this hypothesis, AMC has recently been shown to be a reliable prognostic marker in DLBCL,16 FL,17 and HL.18
The utility of AMC and its relationship with ALC have not been investigated in MM. The aim of this study was therefore to analyze AMC, ALC, and the ALC/AMC ratio, as a simple marker combining an estimate of host immune status and tumor microenvironment, at the time of diagnosis in MM and to correlate the findings with clinical parameters and patient outcome.
MATERIALS AND METHODS
Patients
This study included 189 patients who were diagnosed with MM between 2001 and 2011 at the Asan Medical Center, Seoul, Korea. Disease was considered to be plasmablastic when >30% of myeloma cells in the BM biopsy exhibited plasmablastic morphology. All patients met the following criteria: BM involvement; no previous treatment; no previous history of other malignancies, transplantation or immunosuppression; no anti-human immunodeficiency virus antibodies; and availability of laboratory and radiologic data and follow-up information.
AMC and ALC were obtained from routine complete blood count (CBC) with a four-part differential (lymphocytes, monocytes, eosinophils, and neutrophils) using a Sysmex automated hematology analyzer (model E-4000, SE-9000 or XE-2100, Sysmex Co., Kobe, Japan), which was performed at the time of the diagnosis.19
Statistical analysis
Overall survival (OS) was defined as the time between the date of diagnosis and the date of death from any cause. For living patients, OS was defined as the time between diagnosis and the last follow-up date. OS was analyzed using the Kaplan-Meier method and log-rank testing was used to compare groups. Median follow-up with a 95% confidence interval was calculated using the reverse Kaplan-Meier method.20 Multivariate analyses of demographic and clinical characteristics prognostic for OS were performed using the Cox proportional hazards regression model.
The maximal chi-square method was adapted to evaluate the cutoff points in the dataset that best segregated patients into poor and good prognosis subgroups (based on the likelihood of surviving), with the log-rank test as statistic used to measure the strength of the grouping. Maxstat, a maximal chi-square package in R 2.15.2. (R Development Core Team, Vienna, Austria; http://www.R-project.org), was used to identify the optimal cut-off points for ALC, AMC and the ALC/AMC ratio.21,22 Correlations between ALC, AMC, and the ALC/AMC ratio with categorical variables were analyzed using Pearson's chi-square test or Fisher's exact test, and the Mann-Whitney U test was used to evaluate associations with continuous variables. All statistical analyses were performed using the SPSS ver. 18.0 (SPSS Inc., Chicago, IL, USA) or R 2.15.2. A p-value of ≤.05 was considered to be statistically significant.
Ethical permission
The Institutional Review Board (IRB) of Asan Medical Center (Seoul, Korea) approved this study protocol and provided all necessary ethical permissions.
RESULTS
Patient characteristics
The mean age of the 189 patients with MM in the study was 60 years (range, 29 to 84 years), and the male to female ratio was 1.077:1. Paraprotein type was determined by immunoelectrophoresis; IgG was the most common (n=95, 50.3%), followed by light chain (n=48, 25.4%), IgA (n=34, 18%), IgD (n=7, 3.7%), and IgM (n=5, 2.6%). Of the 189 patients, 57 (30.2%) exhibited plasmablastic disease morphology. Punched-out, osteolytic bone lesions (>3 lesions) were identified in 96 patients (50.8%). Following diagnosis, patients were treated with chemotherapy (47.1%), radiotherapy (6.3%), chemotherapy followed by ASCT (35.4%), or conservative treatment (11.1%). At the time of analysis, 146 patients (77.2%) had died of MM, and the estimated 5-year OS was 26%.
At the time of diagnosis, the median AMC was 372 cells/µL (range, 41 to 2,040 cells/µL), the median ALC was 1,581 cells/µL (range, 319 to 5,742 cells/µL) and the median ALC/AMC ratio was 4 (range, 0.83 to 33).
Correlation of ALC, AMC, and the ALC/AMC ratio with clinicopathological variables
The patients were divided into two groups according to ALC, AMC, and the ALC/AMC ratio at diagnosis. Cut-off points for the division of groups, chosen according to the results of maximal chi-square analysis to best segregate patients, were as follows: ALC 1,400 cells/µL, AMC 490 cells/µL, and an ALC/AMC ratio of 2.9. One hundred and fifteen patients (60.8%) belonged to the high ALC (≥1,400 cells/µL) group, 57 patients (30.2%) to the high AMC (≥490 cells/µL) group and 135 patients (71.4%) to the high ALC/AMC ratio (≥2.9) group.
The low ALC, high AMC, and low ALC/AMC ratio groups were associated with poor prognostic factors such as high International Staging System (ISS) stage, plasmablastic morphology, hypoalbuminemia and high β2-microglobulin (β2m). Patients with a low ALC at diagnosis were more likely to present with a high ISS stage (p=.004), plasmablastic morphology (p=.027), hypoalbuminemia (p=.004), anemia (p=.005), low platelets (p=.001), and leukopenia (p=.001). Patients with a high AMC at diagnosis were more likely to be male (p<.0001) and present with leukocytosis (p<.0001) and high β2m (p=.015), serum creatinine (p=.014) and platelets (p=.028). Patients with a low ALC/AMC ratio at diagnosis were more likely to present with plasmablastic morphology (p=.008) and leukocytosis (p=.003), and be male (p=.011) (Table 1).

Characteristics of multiple myeloma patients according to ALC, AMC, and the ALC/AMC ratio
Prognostic significance of ALC, AMC, and the ALC/AMC ratio
The median follow-up period was 938 days (range, 2 to 5,011 days). Univariate analysis showed that low ALC, high AMC, and low ALC/AMC ratio were correlated with poor OS (p=.002, p=.038, and p=.001, respectively) (Fig. 1). The 5-year OS rate was also shorter in the low ALC (17% vs 33% in the high ALC group), high AMC (18% vs 30% in the low AMC group), and low ALC/AMC ratio groups (13% vs 31% in the high ALC/AMC ratio group).
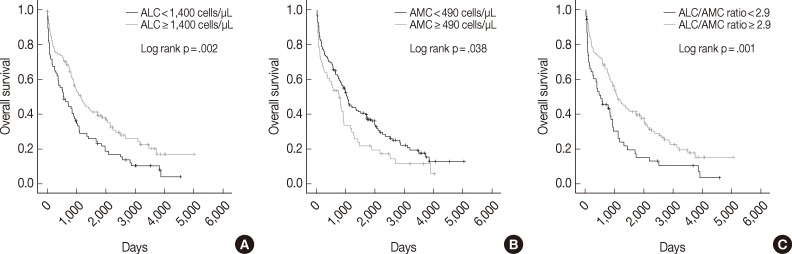
Kaplan-Meier curves of overall survival in multiple myeloma patients according to absolute lymphocyte count (ALC) (A), absolute monocyte count (AMC) (B), and the ALC/AMC ratio (C).
Univariate analyses also showed that other factors related to poor OS included plasmablastic morphology (p=.016), older age (≥65 years; p=.001), high ISS stage disease (p<.0001), high Durie-Salmon stage (p<.0001), high β2m (p<.0001), hypoalbuminemia (p=.009) and treatment without ASCT (p<.0001) (Table 2).
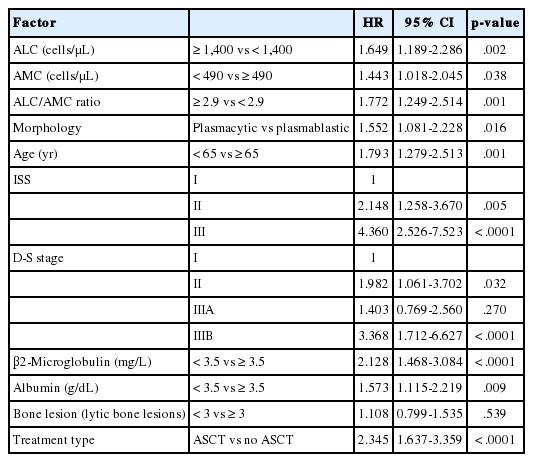
Univariate analyses of ALC, AMC, and the ALC/AMC ratio for OS
Multivariate analysis including ALC, AMC, morphology, age, ISS stage, Durie-Salmon stage, and treatment type showed that only treatment type (ASCT vs no ASCT) was an independent prognostic factor for OS (p=.001); ALC and AMC were not statistically significant (p=.106 and p=.107, respectively). Multivariate analysis including the ALC/AMC ratio, morphology, age, ISS stage, Durie-Salmon stage, and treatment type showed that the ALC/AMC ratio and treatment type were both independent prognostic markers (p=.047 and p=.001, respectively) (Table 3).

Multivariate analyses of ALC, AMC, and the ALC/AMC ratio for OS
We also assessed ALC, AMC and the ALC/AMC ratio in patients subdivided for factors that can affect prognosis and treatment selection (such as ASCT vs no ASCT, age, sex, and ISS) to determine whether they could predict OS. Among patients who did not undergo ASCT, those with low ALC, high AMC, and low ALC/AMC ratio had significantly shorter OS (p=.029, p=.025, and p=.003, respectively), but patients who received ASCT did not show significant differences in survival (p=.221, p=.323, and p=.343, respectively) (Fig. 2). When we stratified patients according to age, sex, and ISS, low ALC was associated with poor OS in patients who were <65 years-old (p=.009), male (p=.001), or had ISS stage II disease (p=.031). High AMC was associated with poor survival in the ISS stage I group (p<.0001). Low ALC/AMC ratio was associated with poor survival in patients who were <65 years-old (p=.008), male (p=.018), or had ISS stage I (p=.017) or stage III disease (p=.010) (Table 4).
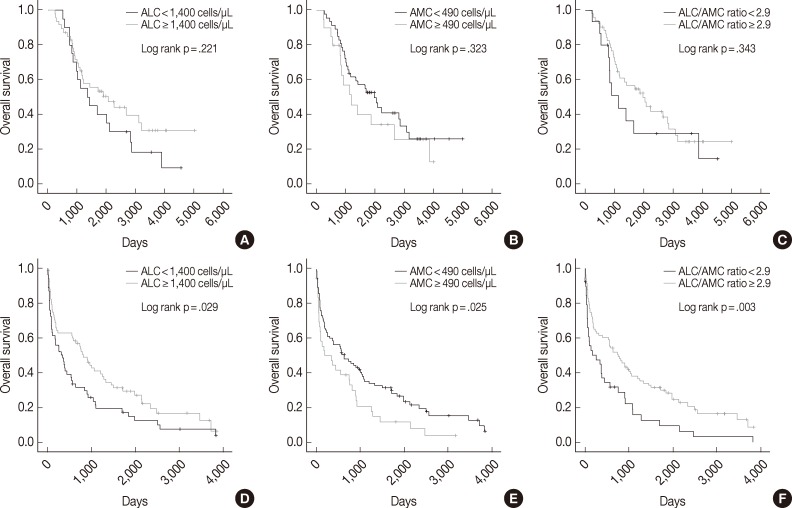
Kaplan-Meier curves of overall survival in multiple myeloma patients with (A-C) or without (D-F) autologous stem cell transplantation, according to absolute lymphocyte count (ALC) (A, D), absolute monocyte count (AMC) (B, E), and the ALC/AMC ratio (C, F).
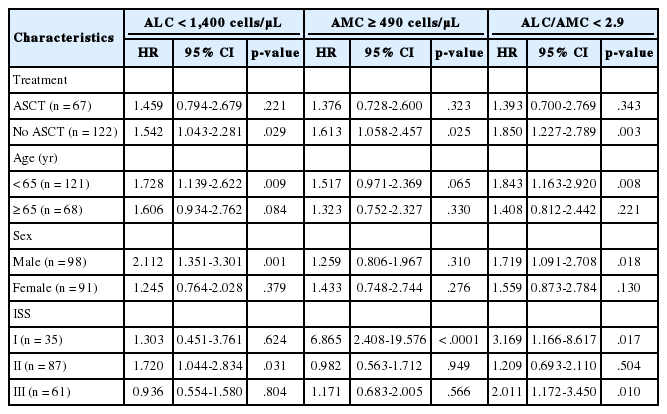
Stratified univariate analyses for OS
DISCUSSION
The aim of the present study was to investigate the role of AMC as a prognostic biomarker for MM and to determine its relationship with ALC, an established prognostic factor for MM. To our knowledge, this is the first study to demonstrate the prognostic value of AMC and the ALC/AMC ratio in newly diagnosed MM.
Low ALC (<1,400 cells/µL), high AMC (≥490 cells/µL), and low ALC/AMC ratio (<2.9) were associated with poor OS and poor prognostic factors such as high ISS stage, plasmablastic morphology, hypoalbuminemia, and high β2m. However, on multivariate analysis, only low ALC/AMC ratio was an independent prognostic factor for MM.
Although ALC did not have statistical significance in multivariate analysis due to the relatively small sample size, our results are in agreement with previous reports showing that a high ALC is associated with better prognosis in newly diagnosed MM (cut-off point, 1,400 cells/µL; the same as that used our study),3 relapsed MM after Vel-Dex therapy (cut-off point, 1,100 cells/µL)23 and other lymphomas.24
We also found that shorter OS in MM patients was associated with high AMC and low ALC/AMC ratio, which is similar to the findings of previous studies of malignant lymphomas. AMC has been shown to be a reliable prognostic marker for DLBCL (cut-off point, 630 cells/µL),16 FL (cut-off point, 570 cells/µL),17 and HL (cut-off point, 900 cells/µL),18 and in classical HL, the ALC/AMC ratio at diagnosis is an independent prognostic factor for survival (cut-off point, 1.1).18
Recently it has been reported that TAMs are a prognostic marker for the survival of patients with MM.13 TAMs, which constitute a significant proportion of tumor-infiltrating inflammatory cells, have been linked to the growth, angiogenesis and metastasis of a variety of cancers.7 In MM, macrophages are an abundant and important component of BM stromal cells and contribute to tumor angiogenesis.25,26 TAMs, which are continually being recruited and activated both in an autocrine manner and by cytokines secreted by myeloma cells, adapt functionally, phenotypically and morphologically to collaborate with endothelial cells in vessel formation.27 Moreover, BM macrophages protect myeloma cells from apoptosis.28 TAMs therefore promote tumor growth not only by supporting angiogenesis, but also by protecting tumor cells from apoptosis, via the induction of immunosuppression.29 The important role TAMs play in the biology of MM, thereby affecting patient outcome, makes them a potential target for anti-vascular therapy in MM.26
As TAMs are derived from circulating monocytes and are recruited to the tumor site by tumor-derived chemotactic factors,14,15,30 obtaining an AMC from a CBC at diagnosis is simple and could be more easily applied in clinical practice than counting TAMs. In this study, the ALC/AMC ratio was an independent prognostic factor in MM. Moreover, the ALC/AMC ratio, which may be a reflection of both the tumor microenvironment and host immune status, could provide prognostic information independently.
We found that the patient group with high AMC and low ALC/AMC ratio trended toward worse OS whether or not they received ASCT, although statistical significance was not reached in the ASCT group because of the small sample size. A larger prospective cohort study of uniformly treated patients is required to validate these findings.
In conclusion, the results of the present study suggest that AMC, and, in particular, ALC/AMC ratio, which was found to be an independent prognostic factor for patient survival, could be used to determine the prognosis of MM.
Notes
No potential conflict of interest relevant to this article was reported.