 E-submission
Articles
- Page Path
- HOME > J Pathol Transl Med > Volume 55(4); 2021 > Article
-
Original Article
Potential of AKT2 expression as a predictor of lymph-node metastasis in invasive breast carcinoma of no special type -
Primariadewi Rustamadji1,*
 , Elvan Wiyarta,2,*, Kristina Anna Bethania1, Kusmardi Kusmardi3
 -
Journal of Pathology and Translational Medicine 2021;55(4):271-278.
DOI: https://doi.org/10.4132/jptm.2021.04.26
Published online: June 14, 2021
1Department of Anatomic Pathology, Faculty of Medicine, Universitas Indonesia, Jakarta, Indonesia
2Faculty of Medicine, Universitas Indonesia, Jakarta, Indonesia
3Department of Anatomic Pathology, Drug Development Research Cluster, Human Cancer Research Center, IMERI, Faculty of Medicine, Universitas Indonesia, Jakarta, Indonesia
- Corresponding Author: Elvan Wiyarta, MBBS, Faculty of Medicine, Universitas Indonesia, Salemba Raya No. 6. RW. 5, Kenari, Kec. Senen, Kota Jakarta Pusat, Jakarta 10430, Indonesia Tel: +62-81382222670, E-mail: 'elvan.wiyarta@ui.ac.id'
- *Primariadewi Rustamadji and Elvan Wiyarta contributed equally to this work.
© 2021 The Korean Society of Pathologists/The Korean Society for Cytopathology
This is an Open Access article distributed under the terms of the Creative Commons Attribution Non-Commercial License (http://creativecommons.org/licenses/by-nc/4.0) which permits unrestricted non-commercial use, distribution, and reproduction in any medium, provided the original work is properly cited.
Abstract
-
Background
- Invasive breast carcinoma of no special type (IBC-NST) is the most common type of breast cancer and mainly causes regional lymph-node metastasis (LNM). We investigated the potential for AKT2 expression as a predictive biomarker for LNM in IBC-NST.
-
Methods
- Forty-eight paraffin blocks containing IBC-NST primary tumors were divided into two groups based on presence or absence of LNM. Age, tumor grade, tumor size, lymphovascular invasion (LVI), and AKT expression were assessed. AKT2 expression was assessed based on immunohistochemical staining, while other data were collected from archives.
-
Results
- Multiple logistic regression results showed that AKT2 expression and LVI were significantly associated with LNM (odds ratio [OR], 5.32; 95% confidence interval [CI], 1.42 to 19.93 and OR, 4.46; 95% CI, 1.17 to 16.97, respectively). AKT2 expression was able to discriminate against LNM (area under the receiver operating characteristic, 0.799 ± 0.063; 95% CI, 0.676 to 0.921) at an H-score cutoff of 104.62 (83.3% sensitivity, 62.5% specificity).
-
Conclusions
- AKT2 expression has potential as a predictor of LNM in IBC-NST. The H-score cutoff for AKT2 expression can be used as a classification guide in future studies.
- Study design and data collection
- This is a cross-sectional study that was conducted in the Anatomical Pathology Laboratory of the Faculty of Medicine at the University of Indonesia from December 2019 to December 2020. The study conforms with The Code of Ethics of the World Medical Association (Declaration of Helsinki) [9]. Data retrieved from the 2019 and 2020 departmental archives were patient age, tumor subtype (limited to IBC-NST), tumor grade (based on Nottingham Grading System [10]), tumor size, lymphovascular invasion (LVI), and LNM. AKT2 expression data were obtained through quantification of immunohistochemistry (IHC) staining results.
- Samples
- The samples evaluated in this study were primary tumor paraffin blocks from breast mastectomy in Asian females that had been diagnosed histopathologically with IBC-NST, either with or without metastasis into adjacent lymph nodes. Samples having an additional histopathological diagnosis other than IBC-NST (e.g., invasive lobular carcinoma, medullary carcinoma, papillary carcinoma), systemic comorbidities (hypertension, diabetes mellitus, etc.), or damaged paraffin blocks (e.g., paraffin blocks with tumor masses cut or eaten by animals, etc.) were excluded.
- Samples were classified according to presence or absence of LNM. The minimum sample size was calculated with alpha = 5%, confidence interval (CI) = 95%, and power = 80%. Consequently, a minimum of 23 samples was required for each group. We obtained 24 samples for the metastatic lymph node group and 24 samples for the non-metastatic lymph node group. To avoid bias, grouping data were accessed by a single researcher (K.K.), and the other researchers were blind to patient groupings until the research process was complete.
- Slide preparation and IHC staining
- Slide preparation was performed by cutting the tissue in a paraffin block using a microtome to a thickness of 3–5 μm. Next, the sample was heated on a slide warmer (30–60 minutes) at 58°C, deparaffinized using stratified xylol (Merck, Jakarta, Indonesia) for 5 minutes, rehydrated in alcohol (Merck) for 5 minutes, and rinsed with water for 5 minutes. Each slide was pre-treated with heat-induced retrieval antigen using 0.1 M NaOH citrate buffer pH 7.0 (Brataco Inc., Jakarta, Indonesia) in an autoclave at 121°C for 15 minutes and then washed in phosphate buffered saline (PBS) pH 7.4 (Brataco Inc.) for 5 minutes. Blocking was performed using hydrogen peroxide (Brataco Inc.) in 3% v/v methanol (Brataco Inc.) for 30 minutes at room temperature. Next, it was washed under running water for 5 minutes, followed by nonspecific protein blocking with universal Background Sniper (Abcam, Jakarta, Indonesia) for 15 minutes. After the blocking process, the slides were incubated for 1 hour with anti- AKT2 antibody (Abcam) at a 1:100 dilution and then washed in PBS for 5 minutes. Subsequently, the slides were incubated with biotinylated secondary antibody (Abcam) for 30 minutes and washed in PBS for 5 minutes. Diaminobenzidine tetrahydrochloride (Abcam) was dropped onto a slide and counterstained with Lillie-Mayer's hematoxylin (Abcam) for 2 minutes. Subsequently, the slides were immersed in lithium carbonate (Merck) for 2 minutes followed by graded alcohol dehydration (5 minutes) and graded xylol clearing (5 minutes). Finally, the sections were covered with a liquid cover, which is an aqueous mounting media. The stained sections were subsequently examined for AKT2 expression. Negative and positive controls were included for each staining. The negative control was established by eliminating the primary antibody administration step.
- Quantification of AKT2 expression
- Immunohistochemical staining assessment was performed by two experienced researchers (P.R. and K.A.B.). Each preparation was observed using a light microscope at 400x magnification and was documented using Leica LAZ EZ software (Jena, Germany) and a camera that was integrated with a Leica DM750 microscope. AKT2 expression was assessed in at least 500 tumor cells from 5 high-power visual fields (×400) that were chosen randomly. Each region was represented by a minimum of 100 tumor cells. AKT2 positivity was represented by brown staining of the tumor cell membrane and cytoplasm.
- Staining intensity was categorized into no staining (0), low positive (1+), positive (2+), and high positive (3+) based on the intensity of the brown color observed in each view field using the cell counter function in ImageJ [11]. The H-score was calculated to quantify AKT2 expression and was based on the following formula [12]:
- Two observers (P.R. and K.A.B.) independently calculated the H-scores for all samples. To avoid bias, the results of the previously assessed calculations were reported to the statistician (E.W.) until the entire sample was assessed. The mean H-score of the two observers was used for statistical analyses.
- Statistical analyses
- Data were entered into a master table using Microsoft Excel 2013 (Microsoft Corp., Redmond, WA, USA), and the tabulated data were analyzed using the SPSS ver. 20 (IBM Corp., Armonk, NY, USA) and visualized using GraphPad Prism 8 (GraphPad Software, Inc., La Jolla, CA, USA). Variability in H-score between the two observers was compared with the intraclass correlation coefficient (ICC) to assess data reliability. The ICC model used a two-way mixed average measurement with absolute agreement. ICC values were grouped according to 95% confident intervals of the ICC estimate: poor, < 0.5; moderate, 0.5–0.75; good, 0.75–0.9; and excellent, > 0.90.
- H-scores of the two observers were averaged and grouped into high or low groups using the median H-score as the cutoff (median split approach) [13,14]. This grouping describes AKT2 expression in each sample. A bivariate analysis was performed to compare age (< 50 years or ≥ 50 years), tumor grade (high or low), tumor size (≤ 5 cm or > 5 cm), LVI (yes or no), and AKT2 expression (high or low) against LNM (yes or no). All variables that have a p < .2 in bivariate analysis will be included in multivariate multiple logistic regression models using the backward logistic regression method. The discrimination capacity of the model was calculated from the area under the receiver operating characteristic (AUROC) curve. A p-value less than .05 was considered statistically significant.
- The receiver operating characteristic (ROC) curve for the AKT2 H-score was analyzed, for which we included H-score as a continuous variable. ROC was determined according to the area under the curve (AUC) that was grouped as follows: 0.5, no discrimination; 0.7–0.8, acceptable; 0.8–0.9, excellent; and > 0.9, outstanding. The AKT2 expression cutoff value was assessed from the ROC curve based on the highest Youden Index [15] and the lowest K-Index [16]. The Youden Index uses the maximum vertical distance of the ROC curve from the (x, y) point on the diagonal (chance) line.
MATERIALS AND METHODS
- IHC staining and H-score reliability
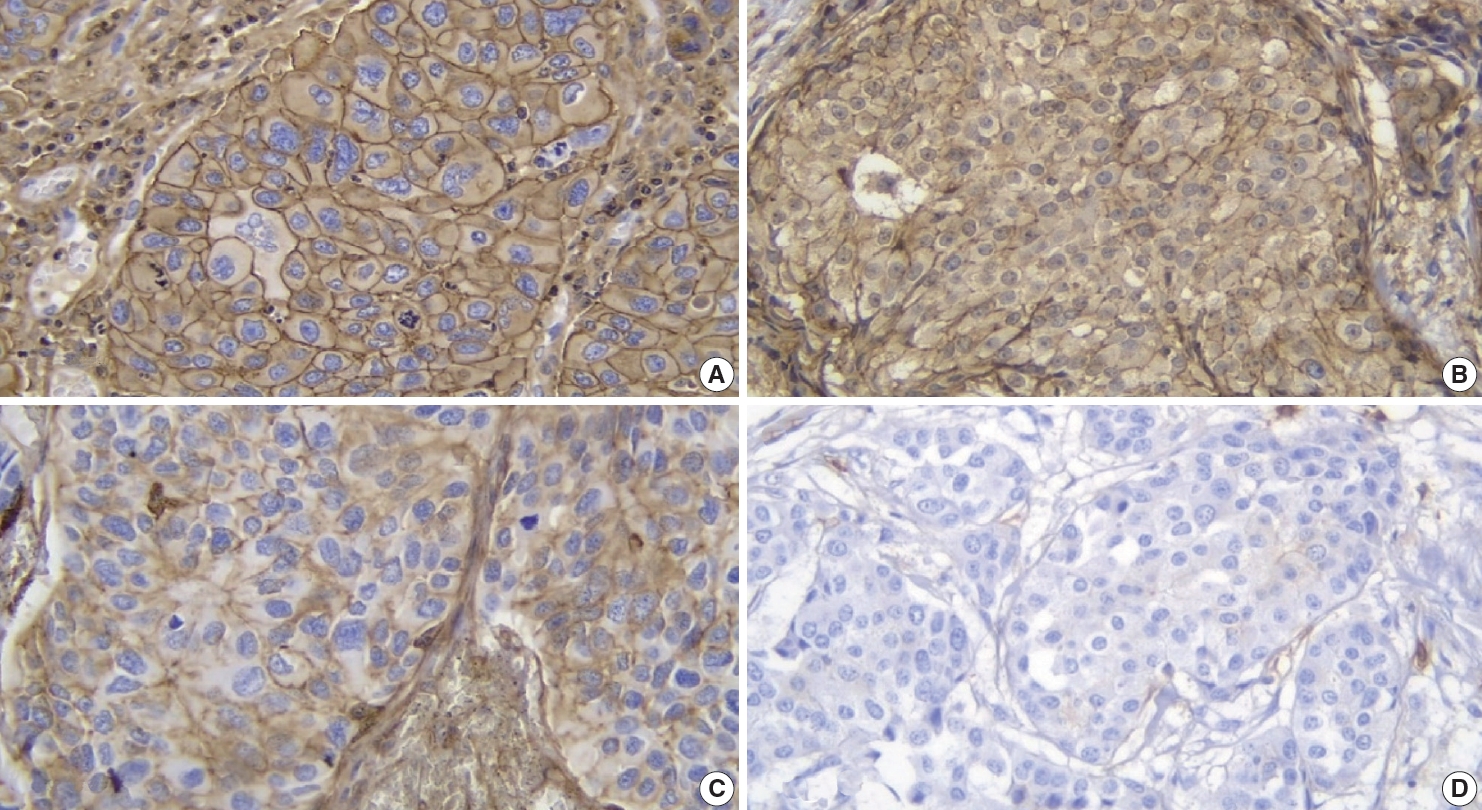
- All 48 samples underwent immunohistochemical staining for AKT2 expression. Representative immunohistochemical staining results are shown in Fig. 1A–D. Each image represents a sample of tumor cells with different staining groups: high positive (A), positive (B), low positive (C), and no staining (D). The images include several visual fields from the same slide. These photos also show that, in one slide, sometimes even in one visual field, several cells can be found with different intensities. AKT2 expression can be observed in the cell membrane and cytoplasm. The intensity of brown color in these areas was quantified into an H-score for further assessment.
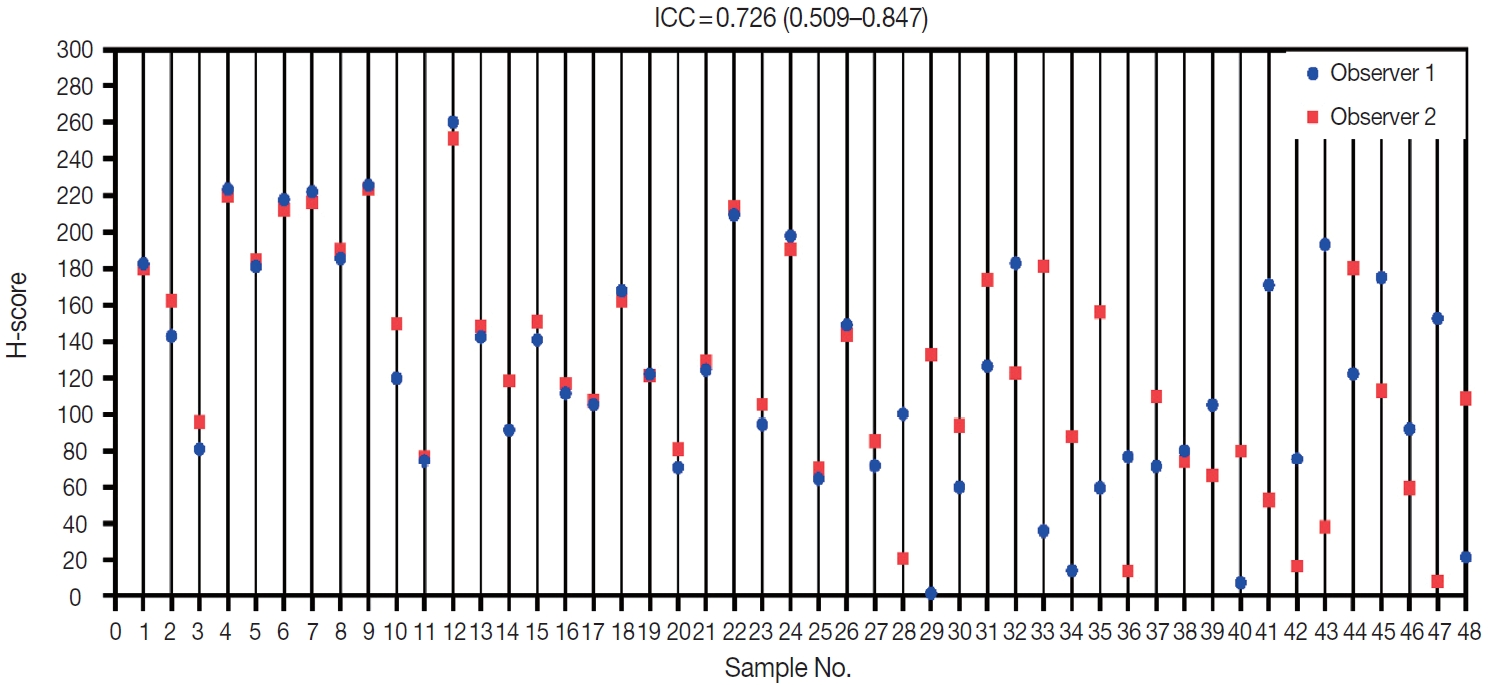
- Two observers (P.R. and K.A.B.) assessed all 48 samples independently. The distribution of H-scores within each sample can be seen in Fig. 2. Reliability between any two measurements was determined to be moderate. The average measure ICC was 0.726 (95% CI, 0.509 to 0.847; F (47.47) = 3.593; p < .001).
- Association between AKT2 expression and LNM
- The clinicopathologic characteristics of each sample are presented in Table 1. Each of these variables is a covariate that can have a role in LNM occurrence. Therefore, we considered the role of each variable by conducting bivariate tests to evaluate their relationships with LNM. Bivariate analyses of several variables were performed to assess their association with LNM (Table 2), including patient age (< 50 years or ≥ 50 years), tumor grade (grade III [high] or grade I–II [low]), tumor size (≤ 5 cm or > 5 cm), LVI (yes or no), and AKT2 expression (high or low).
- Bivariate analysis results indicated a significant relationship between AKT2 expression and LNM (p = .009). LVI also was significantly associated with LNM (p = .020). There was no significant association between patient age, tumor grade, or tumor size and LNM. Because both AKT2 expression and LVI showed significant associations with LNM, they were included in a multivariate regression model (Table 3).
- Both AKT2 expression (odds ratio [OR], 5.32; 95% CI, 1.42 to 19.93) and LVI (OR, 4.46; 95% CI, 1.17 to 16.97) were significantly associated with LNM. Samples with high AKT2 expression were 5.32 times more likely to have metastases than were samples with low AKT2 expression, and samples with LVI were 4.46 times more likely to have metastases than were samples without LVI. We also calculated the metastatic probability based on the following formula [17]:
- , where P(Y) is the probability of LNM, X1 represents AKT2 expression (high, 1; low, 0), and X2 represents LVI (yes, 1; no, 0). From this model, the probability of LNM can be calculated for various conditions (Table 4).
- Model goodness-of-fit was adequate (Table 3). The Hosmer- Lemeshow test (p = .999) indicated that LNM numbers were not significantly different from those predicted by the model, and model predictions yielded satisfactory goodness-of-fit. Moreover, the difference between the overall model and a constant-only model was statistically significant (p = .001), indicating that the predictors reliably distinguished between LNM and non-LNM cases. The AUROC value for this model was 0.78, which indicates excellent discriminatory ability.
- ROCs of AKT2 expression
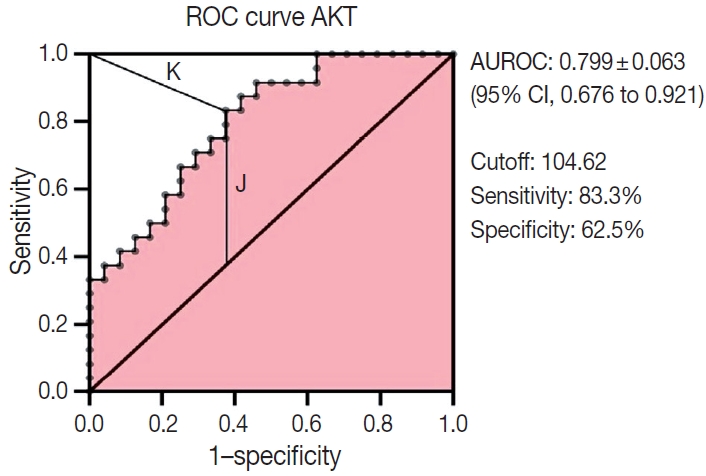
- The ability of AKT2 expression to discriminate against lymphnode metastases was assessed through ROC curve analysis (Fig.3). The AUC was 0.799 ± 0.063 (95% CI, 0.676 to 0.921). This area (approximately 0.8) showed excellent accuracy. The optimal cutoff point for AKT2 expression was 104.62 (H-score), which yielded the highest Youden Index (0.458) and lowest Kindex (0.41) among all cutoffs. This H-score has 83.3% sensitivity and 62.5% specificity.
RESULTS
- Biomarkers are objectively measured characteristics that indicate normal biological processes, pathological processes, pharmacological responses, or therapeutic interventions as proteins that function under specific conditions. AKT2, one of the AKT isoforms, has a role in cancer invasion and metastasis. Thus, AKT2 identification is important for assessing cancer cell characteristics that cause LNM [18]. There are various techniques for identifying AKT2 expression in cells, including polymerase chain reaction (PCR), fluorescence in situ hybridization (FISH), and other molecular methods. In this study, we used a relatively convenient and affordable technique, IHC staining, to identify AKT2. IHC is a common method to identify biomarkers using selective antibodies to bind to specific proteins in tumor cells. While other more advanced molecular methods, such as PCR and FISH, are increasingly used in clinical practice, they can be less practical than IHC [19].
- Specific antibodies bind to AKT2 in the cell membrane and cytoplasm and, to visualize them, diaminobenzidine tetrahydrochloride was used as a chromogen to emit a brown color (Fig. 1). The higher was the intensity of the brown color, the higher was the expression of AKT2 in cells. Also, because AKT2 is located mainly in the cell membrane and cytoplasm, brown color can be observed in those areas of the cell [5]. This is consistent with Trigka et al. [20], where 94.14% of their samples had immunoreactivity against AKT2 staining in cytoplasm and cell membranes. Research by Malik et al. [21] showed that the staining was localized to the membrane where AKT2 was observed to be active. These findings strengthen the value of IHC as a practical method for AKT2 detection.
- To confirm AKT2 expression as a predictor of LNM, several known confounding factors had to be controlled [22], including patient race, additional histopathological diagnoses, tumor subtypes, and multiple comorbidities. We eliminated these factors through application of inclusion and exclusion criteria. Several other confounding factors, including age, tumor grade, tumor size, and LVI, were included in the model, but their association effect with LNM was controlled through bivariate and regression analyses. Among these confounding factors, only LVI has a significant relationship with LNM. After regression analysis to analyze the relationship between AKT2 expression and LNM, LVI was added as a covariate but did not change the effect of AKT2 expression on LNM. This suggests AKT2 expression as an independent predictor of LNM.
- The association between AKT2 expression and LNM in IBC-NST is interesting. In the logistic regression model, AKT2 expression had a very high OR (5.32; 95% CI, 1.42 to 19.93), meaning that primary tumor samples with high AKT2 expression were 5.32 times more likely to have LNM than samples with low AKT2 expression. This relationship is due to underlying molecular mechanisms–as previously explained, AKT2 has a promigratory role in cell migration, invasion, and metastasis. AKT2, but not AKT1 or AKT3, enhances integrin β1-mediated attachment and invasion through collagen IV, which plays an important role in cell invasion and migration [23]. Furthermore, AKT2 directly interacts with PKCζ, which activates adhesion-associated β1-integrin and the actin-polymerizing LIMK/Cofilin axis after epidermal growth factor stimulation [23]. Additionally, AKT2 stimulation by mammalian target of rapamycin in Ser473 causes glycogen synthase kinase-3β degradation, which also triggers EMT [23]. This is consistent with Ye et al. [24], who found that AKT2 promoted breast cancer cell growth after G proteincoupled receptor stimulation. Chen et al. [25] also demonstrated an important role for AKT, finding that cPLA2α mediates EMT via transforming growth factor β activation in the phosphoinositide 3-kinase/AKT pathway. All of these results support the role of AKT2 in inducing LNM.
- We also found an association between LVI and LNM (OR, 4.46; 95% CI, 1.17 to 16.97), indicating that primary tumor samples with LVI were 4.46 times more likely to show lymphnode metastases than samples without LVI. The molecular mechanisms underlying LVI are unclear. In their review, Kariri et al. [26] state that “understanding the role of cancer cell invasion and migration in the differentiation of LVI-related molecular alterations from these driving tumor cell invasion and migration as an early mechanism associated with malignancy is a ‘difficult’ but ‘beatable’ challenge.” However, several hypothetical mechanisms have been proposed. Ribelles et al. [27] suggested that genetic alterations can increase migratory potential. On the other hand, Melzer et al. [28] suggested that matrix metalloproteinases can disrupt primary tumor stability, inducing migration and, ultimately, LVI. Apart from the underlying molecular mechanisms, several studies have found associations between LVI and LNM. Research by Schoppmann et al. [29] indicates that LVI was associated significantly with a higher risk for developing LNM. In fact, Nathanson et al. [30] showed that LVI can predict systemic metastasis when regional lymph-node metastases are positive. All these findings explain the association between LVI and LNM identified in this study.
- On the other hand, we calculated the probability of LNM by including a constant (β) to the model formula (2). In formula (2), the constant (β) is used as a multiplier of the related variable. This also shows that the variable with a greater constant (β) has a more dominant role in determining LNM probability, and vice versa. Therefore, it can be concluded that AKT2 expression is more dominant than LVI in determining LNM probability. Although no previous studies have examined these two components simultaneously, several correlational studies can explain this finding. Research by Wang et al. [31] demonstrated a positive correlation between AKT2 mRNA expression and LNM in breast cancer (r = 0.46, p < .001). Meanwhile, a meta-analysis by Zhang et al. [32] showed a correlation between LVI and lymphnode metastases. However, the correlation was low (r = 0.24; 95% CI, 0.19 to 0.28) [32], indicating that the role of LVI on LNM is less dominant.
- The potential for AKT2 as an LNM predictor needs further elucidation. One approach uses LNM discrimination analysis on the ROC curve. The AUC ROC was 0.799 ± 0.063 (95% CI, 0.676 to 0.921), indicating excellent accuracy, in this study, AKT2 expression as a way to discriminate lymph-node metastases was very good. Therefore, we conducted an analysis to estimate an optimal cutoff as a guide for classifying high or low AKT2 expression.
- As explained above, this study uses the median H-score to classify AKT2 expression. However, we are aware that use of a marker-specific IHC cutoff assay is important for prediction of therapeutic response [33]. Therefore, we conducted an additional analysis to identify a potential cutoff for AKT2 expression, wherein we estimated an H-score of 104.62. This suggests that, if this cutoff is implemented in an IBC-NST AKT2 expression dataset, an H-score ≥104.62 can be classified as “high AKT2 expression.” On the other hand, values with an H-score < 104.62 can be classified as “low AKT2 expression.” Of course, this cutoff needs to be further explored and refined, but we expect it to help classify AKT2 expression in future studies.
- In conclusion, AKT2 expression can be used as a predictor to determine LNM. LVI also can be used as a predictor, although it has a less dominant role. Both play a role in predicting LNM in IBC-NST. Moreover, AKT2 expression can be identified by IHC staining, a practical method, with an H-score cutoff of 104.62 for classifying high and low AKT2 expression. This cutoff can be used in future research regarding AKT2 expression in IBC-NST.
DISCUSSION
-
Ethics Statement
The experimental protocols were approved by the Ethics Committee of the Faculty of Medicine, University of Indonesia (protocol number 20-09- 1169, July 2020). All participants provided written consent, and the study conforms with The Code of Ethics of the World Medical Association (Declaration of Helsinki).
-
Availability of Data and Material
The datasets generated or analyzed during the study are available from the corresponding author on reasonable request.
-
Code Availability
Not applicable.
-
Author Contributions
Conceptualization: PR, EW. Data curation: EW, KAB. Formal analysis: EW. Funding acquisition: PR. Investigation: PR, KAB. Methodology: PR, EW. Software: EW. Validation: PR. Visualization: EW. Writing—original draft: EW. Writing—review & editing: PR, KK. Approval of final manuscript: all authors.
-
Conflicts of Interest
The authors declare that they have no potential conflicts of interest.
-
Funding Statement
No funding to declare.
Notes
Acknowledgments
| Variable |
Lymph-node metastasis, n (%) |
p-value | OR |
95% CI |
|||
|---|---|---|---|---|---|---|---|
| Yes | No | Total | Min | Max | |||
| Age (yr)a | > .990 | 1.19 | 0.38 | 3.71 | |||
| ≥ 50 | 14 (51.9) | 13 (48.1) | 27 | ||||
| < 50 | 10 (47.6) | 11 (52.4) | 21 | ||||
| Tumor gradea | .561 | 1.67 | 0.53 | 5.27 | |||
| High | 15 (55.6) | 12 (44.4) | 27 | ||||
| Low | 9 (42.9) | 12 (57.1) | 21 | ||||
| Tumor size (cm)a | .371 | 0.49 | 0.15 | 1.60 | |||
| > 5 | 7 (38.9) | 11 (61.1) | 18 | ||||
| ≤ 5 | 17 (56.7) | 13 (43.3) | 30 | ||||
| Lymphovascular invasiona | .020 | 5.00 | 1.45 | 17.27 | |||
| Yes | 18 (66.7) | 9 (33.3) | 27 | ||||
| No | 6 (28.6) | 15 (71.4) | 21 | ||||
| AKT2 expressiona | .009 | 5.90 | 1.70 | 20.48 | |||
| High | 17 (70.8) | 7 (29.2) | 24 | ||||
| Low | 7 (29.2) | 17 (70.8) | 24 | ||||
| AKT2 expression | Lymphovascular invasion | Probability of LNM (%) |
|---|---|---|
| High | Yes | 81.44 |
| High | No | 49.62 |
| Low | Yes | 45.18 |
| Low | No | 15.62 |
- 1. Bray F, Ferlay J, Soerjomataram IS, et al. Global cancer statistics 2018: GLOBOCAN estimates of incidence and mortality worldwide for 36 cancers in 185 countries. CA Cancer J Clin 2018; 68: 394–424. ArticlePubMed
- 2. Sharma GN, Dave R, Sanadya J, Sharma P, Sharma KK. Various types and management of breast cancer: an overview. J Adv Pharm Technol Res 2010; 1: 109–26. PubMedPMC
- 3. Chiang AC, Massague J. Molecular basis of metastasis. N Engl J Med 2008; 359: 2814–23. ArticlePubMedPMC
- 4. Roche J. The epithelial-to-mesenchymal transition in cancer. Cancers (Basel) 2018; 10: 52.ArticlePubMedPMC
- 5. Song M, Bode AM, Dong Z, Lee MH. AKT as a therapeutic target for cancer. Cancer Res 2019; 79: 1019–31. ArticlePubMed
- 6. Yang ZY, Di MY, Yuan JQ, et al. The prognostic value of phosphorylated Akt in breast cancer: a systematic review. Sci Rep 2015; 5: 7758.ArticlePubMedPMC
- 7. Riggio M, Perrone MC, Polo ML, et al. AKT1 and AKT2 isoforms play distinct roles during breast cancer progression through the regulation of specific downstream proteins. Sci Rep 2017; 7: 44244.ArticlePubMedPMC
- 8. Xu H, Tian Y, Yuan X, et al. The role of CD44 in epithelial-mesenchymal transition and cancer development. Onco Targets Ther 2015; 8: 3783–92. PubMedPMC
- 9. Rickham PP. Human Experimentation. Code of Ethics of the World Medical Association. Declaration of Helsinki. Br Med J 1964; 2: 177.PubMedPMC
- 10. Rakha EA, Reis-Filho JS, Baehner F, et al. Breast cancer prognostic classification in the molecular era: the role of histological grade. Breast Cancer Res 2010; 12: 207.ArticlePubMedPMC
- 11. O’Brien J, Hayder H, Peng C, et al. Automated quantification and analysis of cell counting procedures using ImageJ plugins. J Vis Exp 2016; e54719.
- 12. Choudhury KR, Yagle KJ, Swanson PE, Krohn KA, Rajendran JG. A robust automated measure of average antibody staining in immunohistochemistry images. J Histochem Cytochem 2010; 58: 95–107. ArticlePubMedPMC
- 13. Costa WH, Rocha RM, Cunha IW, Guimaraes GC, Zequi Sde C. Immunohistochemical expression of CD44s in renal cell carcinoma lacks independent prognostic significance. Int Braz J Urol 2012; 38: 456–65. ArticlePubMed
- 14. Sadeghi A, Roudi R, Mirzaei A, Zare Mirzaei A, Madjd Z, Abolhasani M. CD44 epithelial isoform inversely associates with invasive characteristics of colorectal cancer. Biomark Med 2019; 13: 419–26. ArticlePubMed
- 15. Ruopp MD, Perkins NJ, Whitcomb BW, Schisterman EF. Youden Index and optimal cut-point estimated from observations affected by a lower limit of detection. Biom J 2008; 50: 419–30. ArticlePubMedPMC
- 16. Kallner A. Formulas. In : Kallner A, ed. Laboratory statistics: methods in chemistry and health sciences. 2nd ed. Cambridge: Elsevier, 2018; 1–140.
- 17. Peng CY, Lee KL, Ingersoll GM. An introduction to logistic regression analysis and reporting. J Educ Res 2002; 96: 3–14. Article
- 18. Wolf DM, Yau C, Wulfkuhle J, et al. Mechanism of action biomarkers predicting response to AKT inhibition in the I-SPY 2 breast cancer trial. NPJ Breast Cancer 2020; 6: 48.ArticlePubMedPMC
- 19. Toren W, Ansari D, Andersson R. Immunohistochemical investigation of prognostic biomarkers in resected colorectal liver metastases: a systematic review and meta-analysis. Cancer Cell Int 2018; 18: 217.ArticlePubMedPMC
- 20. Trigka EA, Levidou G, Saetta AA, et al. A detailed immunohistochemical analysis of the PI3K/AKT/mTOR pathway in lung cancer: correlation with PIK3CA, AKT1, K-RAS or PTEN mutational status and clinicopathological features. Oncol Rep 2013; 30: 623–36. ArticlePubMed
- 21. Malik SN, Brattain M, Ghosh PM, et al. Immunohistochemical demonstration of phospho-Akt in high Gleason grade prostate cancer. Clin Cancer Res 2002; 8: 1168–71. PubMed
- 22. Koniali L, Hadjisavvas A, Constantinidou A, et al. Risk factors for breast cancer brain metastases: a systematic review. Oncotarget 2020; 11: 650–69. ArticlePubMedPMC
- 23. Hinz N, Jucker M. Distinct functions of AKT isoforms in breast cancer: a comprehensive review. Cell Commun Signal 2019; 17: 154.ArticlePubMedPMC
- 24. Ye Y, Tang X, Sun Z, Chen S. Upregulated WDR26 serves as a scaffold to coordinate PI3K/AKT pathway-driven breast cancer cell growth, migration, and invasion. Oncotarget 2016; 7: 17854–69. ArticlePubMedPMC
- 25. Chen L, Fu H, Luo Y, et al. cPLA2alpha mediates TGF-beta-induced epithelial-mesenchymal transition in breast cancer through PI3k/Akt signaling. Cell Death Dis 2017; 8: e2728.ArticlePubMedPMC
- 26. Kariri YA, Aleskandarany MA, Joseph C, et al. Molecular complexity of lymphovascular invasion: the role of cell migration in breast cancer as a prototype. Pathobiology 2020; 87: 218–31. ArticlePubMed
- 27. Ribelles N, Santonja A, Pajares B, Llacer C, Alba E. The seed and soil hypothesis revisited: current state of knowledge of inherited genes on prognosis in breast cancer. Cancer Treat Rev 2014; 40: 293–9. ArticlePubMed
- 28. Melzer C, von der Ohe J, Hass R. Breast carcinoma: from initial tumor cell detachment to settlement at secondary sites. Biomed Res Int 2017; 2017: 8534371.ArticlePubMedPMC
- 29. Schoppmann SF, Bayer G, Aumayr K, et al. Prognostic value of lymphangiogenesis and lymphovascular invasion in invasive breast cancer. Ann Surg Oncol 2004; 240: 306–12. Article
- 30. Nathanson SD, Kwon D, Kapke A, Alford SH, Chitale D. The role of lymph node metastasis in the systemic dissemination of breast cancer. Ann Surg Oncol 2009; 16: 3396–405. ArticlePubMed
- 31. Wang Y, Dang X, Zhang M, Wei C, Li X. The role and correlation analysis of PI3K/AKT pathway in breast carcinoma with lymph node metastasis. J Immunopathol 2018; 1: 4–7.
- 32. Zhang S, Zhang D, Yi S, et al. The relationship of lymphatic vessel density, lymphovascular invasion, and lymph node metastasis in breast cancer: a systematic review and meta-analysis. Oncotarget 2017; 8: 2863–73. ArticlePubMed
- 33. Pierceall WE, Wolfe M, Suschak J, et al. Strategies for H-score normalization of preanalytical technical variables with potential utility to immunohistochemical-based biomarker quantitation in therapeutic response diagnostics. Anal Cell Pathol (Amst) 2011; 34: 159–68. PubMedPMC
References
Figure & Data
References
Citations
- Exploring the Expression of Survivin on Neoadjuvant Chemotherapy in Invasive Breast Carcinoma
Primariadewi Rustamadji, Elvan Wiyarta, Ineke Anggreani
Open Access Macedonian Journal of Medical Sciences.2022; 10(B): 1440. CrossRef - Effect of Omega-3-Rich Fish Oil on TNF- Expression in Mice's Colonic Tissue Induced with Azoxymethane (AOM) and Dextran Sodium Sulphate (DSS)
Elvan Wiyarta, Kusmardi Kusmardi, Yurnadi Hanafi Midoen
Research Journal of Pharmacy and Technology.2022; : 3179. CrossRef - The potential of lunasin extract for the prevention of breast cancer progression by upregulating E-Cadherin and inhibiting ICAM-1
Kusmardi Kusmardi, Elvan Wiyarta, Numlil Khaira Rusdi, Andi Muh. Maulana, Ari Estuningtyas, Hadi Sunaryo
F1000Research.2021; 10: 902. CrossRef - CD44 Variant Exon 6 Isoform Expression as a Potential Predictor of Lymph Node Metastasis in Invasive Breast Carcinoma of No Special Type
Primariadewi Rustamadji, Elvan Wiyarta, Kristina A. Bethania, Rakesh Sathish Nair
International Journal of Breast Cancer.2021; 2021: 1. CrossRef
 PubReader
 ePub Link
-
 Cite this Article
- Cite this Article
-
- Close
- Download Citation
- Close
- Figure
-


