The Significance of TROP2 Expression in Predicting BRAF Mutations in Papillary Thyroid Carcinoma
Article information
Abstract
Background
Trophoblast antigen 2 (TROP2) is a human trophoblast cell-surface glycoprotein that is overexpressed in several types of epithelial cancers, and is suggested to be associated with an unfavorable prognosis. BRAF mutations are the most common genetic alteration in papillary thyroid carcinoma (PTC). We evaluated the correlation between TROP2 expression and BRAF mutation in PTC.
Methods
First, we carried out pyrosequencing for BRAF mutations and immunohistochemistry for TROP2 expression with a tissue microarray consisting of 52 PTC cases. Membranous staining in at least 5% of tumor cells was designated as positive staining and we analyzed the relationship between TROP2 expression and diverse clinicopathological factors, including BRAF mutation. Second, we tested TROP2 mRNA expression in three thyroid cancer cell lines with BRAF mutations (BCPAP, SNU790, and 8505C) and a normal thyroid cell line. Additionally, we checked TROP2 protein levels in a normal thyroid cell line after introduction of the BRAF V600E mutation.
Results
In this study, 21 of 26 cases with BRAF mutation showed TROP2 immunoreactivity, whereas all 26 cases without BRAF mutation showed no immunoreactivity for TROP2 with a statistically significant difference (p<.001). Upregulation of TROP2 mRNA was observed in all three thyroid cancer cell lines, but not in the normal thyroid cell line. Interestingly, however, the TROP2 expression was increased in the normal thyroid cell line after introduction of the BRAF V600E mutation.
Conclusions
Based on these results, we concluded that TROP2 expression is significantly associated with BRAF mutation and that TROP2 immunohistochemistry could be used for predicting BRAF mutations or diagnosing papillary thyroid carcinoma.
Thyroid cancer, the most prevalent endocrine malignancy, is histologically classified into papillary thyroid carcinoma (PTC), follicular thyroid carcinoma, poorly differentiated thyroid carcinoma, anaplastic thyroid carcinoma, and medullary thyroid carcinoma. PTC is the most frequently encountered subtype, accounting for 80 to 85% of all thyroid cancers [1]. Trophoblast antigen 2 (TROP2) is a transmembrane receptor glycoprotein encoded by the tumor-associated calcium signal transducer 2 (Tacstd2) gene, which is located on chromosome 1p32 [2]. TROP2 is also known as membrane component 1 surface marker 1, epithelial glycoprotein 1, gastrointestinal antigen 733-1, and gelatinous droplike corneal dystrophy (GDLD). TROP2 consists of an extracellular domain, a transmembrane domain, and an intracellular cytoplasmic tail [2,3]. TROP2 was first discovered on the surface of trophoblast cells, where it enables the trophoblasts to invade into the decidualized tissue during placental implantation [4]. TROP2 overexpression has been observed in various types of epithelial cancers, including pancreatic, gastric, colorectal, oral, endometrial, and ovarian cancers, and its overexpression correlates with diverse clinicopathological factors and poor clinical outcome [5-11]. Recently, several studies have evaluated the role of TROP2 protein expression using formalin-fixed paraffin-embedded (FFPE) samples of diverse thyroid tumors, and TROP2 protein expression was detected in PTCs with high sensitivity and specificity [12-14]. Based on these results, immunohistochemical (IHC) staining for TROP2 was determined to be a good diagnostic marker for PTC, not only for surgical specimens, but also for fine needle aspirates. Although these results clearly reveal the usefulness of TROP2 expression for diagnosing PTCs in clinical settings, no mechanism was explored regarding why TROP2 expression was elevated especially in PTC and not in other thyroid cancers. Therefore, to answer this question, we focused on BRAF mutations, a major genetic alteration in PTC [15], as having a crucial effect on TROP2 expression with high sensitivity and specificity in PTC.
MATERIALS AND METHODS
Overview
In this study, we used immunohistochemistry to investigate TROP2 protein expression on a tissue microarray (TMA) that included 52 PTC cases with or without BRAF mutation. We analyzed the relationship between TROP2 expression and diverse clinicopathological factors including age, sex, extrathyroidal extension, and BRAF mutation status. In addition, we measured TROP2 mRNA expression in three thyroid cell lines with BRAF mutations and a normal thyroid cell line without BRAF mutation. We also investigated TROP2 protein levels in a normal thyroid cell line after introduction of the BRAF V600E mutation.
Patient characteristics
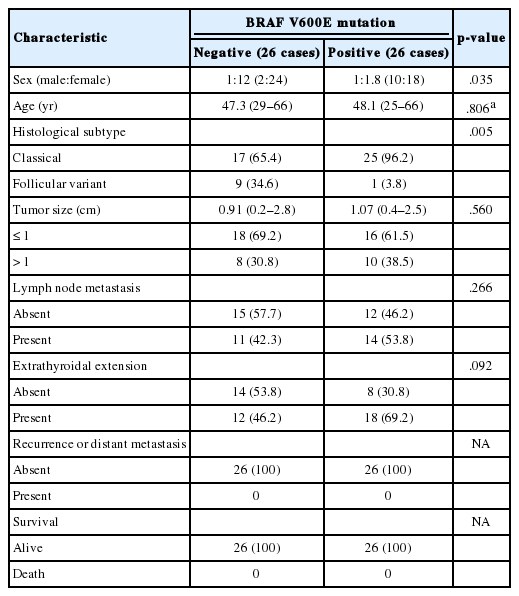
We retrospectively searched the pathology database of Korea Cancer Center Hospital, Seoul, South Korea, for cases of PTC between January 2012 and June 2013. This study was approved by the Institutional Review Board of Korea Cancer Center Hospital with a waiver of informed consent (K-1707-002-048). Histopathological slides were reviewed by two observers (J.S. Kong and J.K. Myung) and BRAF mutation status of these cases was subsequently determined. After dividing the cases into two groups according to BRAF mutation, we analyzed diverse clinicopathological factors in each group. Finally, we selected 26 cases with BRAF mutation and 26 cases without BRAF mutation, with each group having similar clinicopathological factors. The clinicopathological features of the two groups are described in Table 1.
Tissue microarrays
TMAs were constructed from thyroid resection specimens. Cores (2-mm diameter) from each block were obtained from the donor and put into a recipient block using a trephine apparatus (SuperBioChips Laboratories, Seoul, Korea). The TMAs contained 26 cases of PTC with BRAF mutation and 26 cases of PTC without BRAF mutation.
Immunohistochemistry
Tissue sections (4 μm thick) were obtained from TMA blocks. The slides were stained using automatic IHC staining equipment (Lab Vision Autostainer 480S, Thermo Scientific, Fremont, CA, USA). After deparaffinization and epitope retrieval using PT module buffer 1 (Thermo Scientific) at 98°C for 20 minutes, we utilized the UltraVision LP Detection System (Thermo Scientific) according to the manufacturer’s protocol. Monoclonal antibody against TROP2 (1:200, Santa Cruz Biotechnology, Santa Cruz, CA, USA) was applied to sections and incubated for 60 minutes at room temperature. After incubation with a primary antibody enhancer (Thermo Scientific) for 20 minutes, we carried out a horseradish peroxidase (HRP) polymer (Thermo Scientific) and DAB chromogen-substrate for reaction. Slides were counterstained with Gill2-hematoxylin for 1 second and mounted. Appropriate positive and negative controls were included. Interpretation of TROP2 expression was performed by two independent pathologists (J.S. Kong and J.K. Myung). The cases showing membranous staining in more than 5% of cells was designated as TROP2-positive, similar to guidelines utilized by other studies [6,13].
Detection of BRAF mutation
Genomic DNA was extracted from FFPE blocks with the highest percentage of tumors using a QIA amp Mini Kit (Qiagen, Hilden, Germany). DNA was amplified with polymerase chain reaction (PCR) primer sets, and one strand of each set was bound to biotin at the 5' end (primer forward, 5'-biotin-CTTCATAATGCTTGCTCTGATAGG-3'; reverse, 5'-GGCCAAAAATTTAATCAGTGGAA-3'). The PCR procedure was carried out in a total volume of 50 μL containing 5 μL of the DNA (2 ng/μL), 1 μL of each primer (10 pM), 4 μL of MgCl2, 5 μL of 10 × PCR buffer, 2.5 μL of dNTP (2.5 mM), 0.3 μL of Taq Gold DNA polymerase, and 31.2 μL of H2O. The PCR conditions consisted of initial denaturing at 95°C for 5 minutes, 45 cycles at 95°C for 15 seconds, 54°C for 30 seconds, and 72°C for 15 seconds, and a final extension at 72°C for 5 minutes. The PCR products were analyzed by electrophoresis in a 2% agarose gel to confirm successful amplification. The other 20 μL of PCR product was bound to streptavidin beads (GE Healthcare, Buckinghamshire, UK), purified, washed, and denatured with 0.2 mol/L NaOH solution. Then, 0.3 μmol/L pyrosequencing primer (5'-CCACTCCATCGAGATT-3') was annealed to the purified single-stranded PCR product, and sequencing was performed using a PyroMark ID system (Qiagen, Valencia, CA, USA), according to the manufacturer’s instructions.
Cell culture
Three human thyroid cancer cell lines with BRAF V600E mutations, BCPAP, SNU790, and 8505C, were obtained from Dr. M.J. Kim (Seoul National University Hospital, Seoul, Korea) and the human normal thyroid Nthy-ori 3-1 (Nthy) cell line was purchased from Sigma-Aldrich Biotechnology (St. Louis, MO, USA). All cells were cultured in RPMI-1640 medium (Lonza, Walkersville, MD, USA) supplemented with 10% fetal bovine serum (JR Scientific Inc., Woodland, CA, USA) and 0.1% gentamicin (Lonza). Cells were maintained in a humidified incubator at 37°C with 5% CO2.
Reverse transcription polymerase chain reaction
Total RNA was isolated from cultured cells using Trizol reagent (Molecular Research Center Inc., Cincinnati, OH, USA). Reverse transcription was carried out with a cDNA reverse transcription kit (AccuPower RT, Bioneer, Seoul, Korea) following the manufacturer’s protocol. The PCR conditions were as follows: initial denaturation at 95°C for 5 minutes; followed by 35 cycles of 95°C for 1 minute, 56°C for 1 minute, and 72°C for 1 minute; and a final extension step of 72°C for 10 minutes. The amplified products were resolved on a 1.5% agarose-ethidium bromide gel and quantified by a Chemi XRS Gel Documentation System (Bio-Rad, Hercules, CA, USA). The following primers were used: the housekeeping gene glyceraldehyde-3-phosphate dehydrogenase, forward 5'-CGAGA TCCCTCCAAAATCAA-3' and reverse 5'-TGTGGTCATGAGTCCTTCCA-3'; TROP2 #1, forward 5'-CCTCATCGCCGTCATCGT-3' and reverse 5'-CGGTTCCTTTCTCAACTCCC-3'; and TROP2 #2, forward 5'-TATTACCTGGACGAGATTCCCC-3' and reverse 5'-CCCCGACTTTCTCCGGTTG-3'.
Vector construction and cell infection
The human oncogenic BRAF construct, pBABEbleo-Flag-BRAF V600E, was obtained from Addgene (Cambridge, MA, USA). Retroviral particles were produced by H29D packaging cells using a TransIT-X2 Dynamic Delivery System (Mirus Bio, LLC, Madison, WI, USA) according to the manufacturer’s protocols. Nthy cells were infected with viral supernatant containing 8 μg/mL polybrene. Zeocin (100 μg/mL, Invitrogen, San Diego, CA, USA) was used for selecting Zeocin-resistant transfectants.
Western blot analysis
Cells were harvested in NP-40 lysis buffer (Invitrogen) according to the manufacturer’s instructions. Following incubation at 4°C for 30 minutes, lysate was centrifuged at 13,000 × g for 20 minutes at 4°C. Protein concentration was determined using a BCA assay (Bio-Rad). Whole cell lysates were separated by 10% sodium dodecyl sulfate-polyacrylamide gel electrophoresis. The separated proteins were electrophoretically transferred onto PVDF membranes (Millipore, Bedford, MA, USA) overnight at 4°C. Immunoreactive bands were developed using a HRP-conjugated secondary antibody, and the proteins were visualized by enhanced chemiluminescence (Amersham Biosciences, Piscataway, NJ, USA). The following primary antibodies were used: TROP2 (1:1,000, Santa Cruz Biotechnology), BRAF (1:1000, Santa Cruz Biotechnology), β-actin (1:1,000, Santa Cruz Biotechnology), phosphorylated-extracellular signal-regulated kinase (p-ERK; 1:1,000, Cell Signaling Technology, Beverly, MA, USA), and ERK (1:1,000, Cell Signaling Technology).
Statistical analysis
All statistical analyses were performed using the SPSS ver. 23.0 (IBM Corp., Armonk, NY, USA). Pearson’s chi-square test and t tests were used to compare the different clinicopathological factors in each group according to BRAF mutation. Pearson’s chi-square test and Fisher exact test were used to evaluate the association of BRAF mutation and TROP2 expression in PTC. For all analyses, a p-value of <.05 was considered statistically significant.
RESULTS
Patient characteristics
A total of 52 patients were included in this study. Most patients were female (n = 42, 80.8%), with a male to female ratio of 1:4.2. The median age of the 52 PTC patients was 47.7 years. All cases were divided into two groups according to BRAF V600E mutation. The median ages of the BRAF wildtype group and mutant group were 47.3 years and 48.1 years, respectively. The average tumor diameters of the two groups were 0.91 cm (BRAF wildtype group) and 1.07 cm (BRAF mutant group). The BRAF wildtype group showed 17 cases of classical PTC and nine cases of follicular variant of PTC. Twenty-five cases of classical PTC and one case of follicular variant of PTC were included in the BRAF mutant group. Lymph node metastasis was observed in 11 cases of BRAF wildtype group (42.3%) and in 14 cases of BRAF mutant group (53.8%). Extrathyroidal extension was identified in 12 cases (46.2%, BRAF wildtype group) and in 18 cases (69.2%, BRAF mutant group). There was no case of recurrence or distant metastasis in the two groups. At the time of analysis, all 52 patients were still alive. Sex and histological subtype were significantly different between the two groups (p = .035 and p = .005, respectively). Age, tumor size, lymph node metastasis, and extrathyroidal extension revealed no statistically significant difference between the two groups. These results are summarized in Table 1.
Expression of TROP2 and its correlation with clinicopathological factors
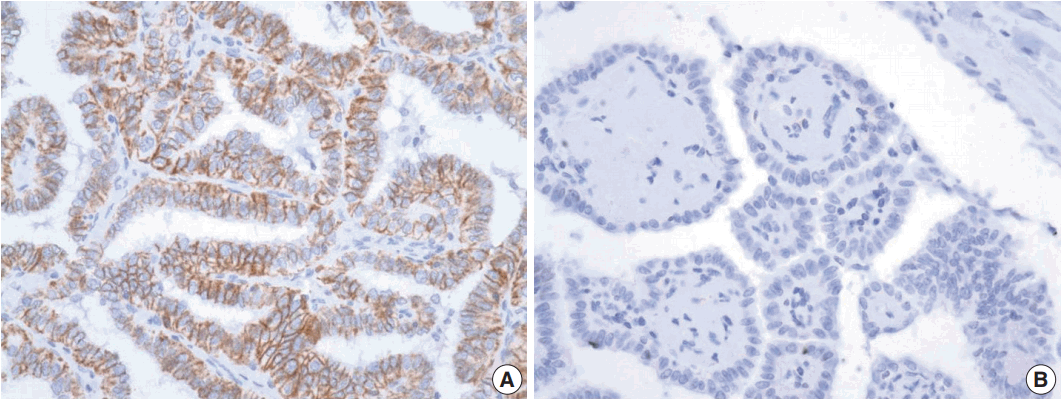
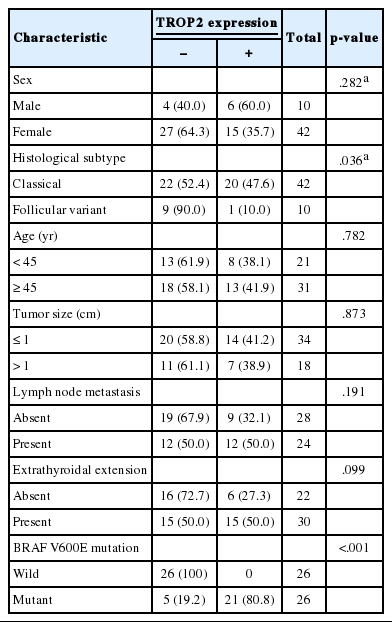
Positive TROP2 immunoreactivity was designated as homogeneously strong membranous staining in at least 5% of tumor cells (Fig. 1). Positive TROP2 immunoreactivity was found in 21 cases (40.4%). Twenty of 21 cases with positive immunostaining for TROP2 were classical PTC and one case was follicular variant of PTC. Of the 42 classical PTC cases, 20 (47.6%) cases revealed positive immunostaining for TROP2, whereas one of 10 follicular variants of PTC showed TROP2 immunoreactivity. TROP2 expression was significantly correlated with histological subtype (p=.036). Of the 26 patients with a BRAF V600E mutation, 21 (80.8%) were positive for TROP2. In contrast, all 26 patients lacking BRAF V600E mutation showed no TROP2 immunoreactivity. TROP2 expression was significantly correlated with BRAF V600E mutation (p < .001). We also analyzed the association between TROP2 expression and diverse clinicopathological factors. Neither sex nor age, which was divided into two groups (above and below 47 years old), was correlated with TROP2 expression. Lymph node metastasis and extrathyroidal extension, which reflect poor clinical outcomes in PTC patients, were also not related to TROP2 expression. These results are summarized in Table 2.

Representative image of trophoblast antigen 2 (TROP2) immunohistochemistry. Membranous staining of TROP2 in more than 5% area of entire field was considered positive (A) and no immunoreactivity for TROP2 expression or case showing the area of staining in less than 5% were negative (B).
mRNA expression of TROP2 in normal and PTC cell lines
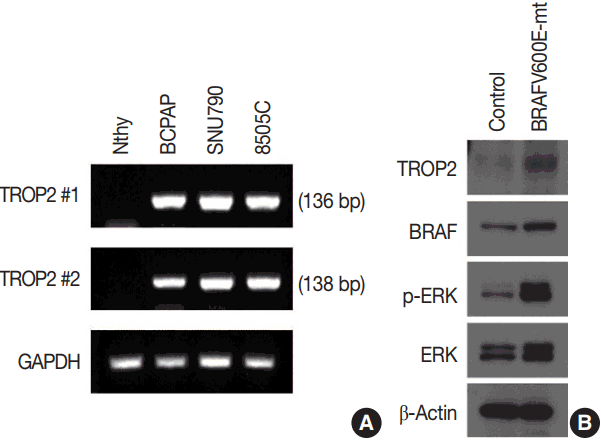
We identified a strong association between TROP2 protein expression and BRAF V600E mutation in PTC tissue samples. Therefore, we also performed reverse transcription polymerase chain reaction (RT-PCR) to evaluate the correlation of TROP2 mRNA expression and BRAF V600E mutation. We analyzed the mRNA level of TROP2 in a normal thyroid cell line (Nthy) and thyroid cancer cell lines (BCPAP, SUN790, and 8505C). We identified the BRAF V600E mutation in these three thyroid cancer cell lines in previous studies [16,17]. TROP2 mRNA expression was not detected in Nthy cells. In contrast, PTC cell lines (BCPAP and SUN790) and the anaplastic thyroid cancer cell line (8505C) showed TROP2 mRNA expression (Fig. 2A).

Expression of trophoblast antigen 2 (TROP2) in vitro. (A) Reverse transcription polymerase chain reaction. High levels of TROP2 expression were observed in all three thyroid cancer cell lines (BCPAP, SNU790, and 8505C) compared to normal thyroid cell line (Nthy). Expression of glyceraldehyde 3-phosphate dehydrogenase was used as an internal control. (B) Western blot analysis. TROP2 protein levels were increased in the normal thyroid cell line after expression of BRAF V600E mutant. The levels of p-ERK and ERK were also elevated with increasing BRAF mutational status.
TROP2 protein expression after BRAF V600E mutation introduction in normal thyroid cells
We examined TROP2 mRNA expression in a normal thyroid cell line and three thyroid cancer cell lines and found that all cancer lines had the BRAF V600E mutation and showed TROP2 mRNA expression, while the normal cell line had neither. Therefore, we infected the normal thyroid cell line with the human oncogenic BRAF construct pBABEbleo-Flag-BRAFV600E, and evaluated changes in TROP2 protein level by Western blotting. TROP2 protein was detected in the normal thyroid cell line after introducing the BRAF V600E mutation via viral infection (Fig. 2B). As expected, we also observed that p-ERK and ERK levels were elevated in the presence of BRAF V600E mutation [18,19].
DISCUSSION
In this study, we aimed to evaluate the role of TROP2 expression in PTC based on the fact that TROP2 expression affects the prognosis in diverse epithelial cancers. Knowledge of the role of TROP2 expression, especially in thyroid tumors, has been limited until now. Only three previous studies have evaluated the role of TROP2 expression in thyroid tumors [12-14]. These studies mainly focused on the clinical utility of TROP2 expression for differential diagnosis of thyroid tumors, especially in fine-needle aspiration (FNA) specimens. According to these studies, TROP2 expression had a higher sensitivity and specificity for diagnosing PTC than other established markers such as cytokeratin 19, HBME1, and galectin 3, which were commonly used in practice. Therefore, IHC for TROP2 expression was a good diagnostic tool in pathological practices for differential diagnosis of thyroid tumors. In this regard, we wanted to investigate why TROP2 was overexpressed in PTC, but not in other thyroid tumors, and evaluate if the BRAF mutation was related. To answer this question, we performed IHC to detect TROP2 expression and pyrosequencing to detect BRAF mutation, and then evaluated the association between TROP2 expression and BRAF mutation. Consequentially, TROP2 expression was significantly related with BRAF mutation. We concluded that the diagnostic utility of TROP2 expression came from the BRAF mutation, which contributes to PTC tumorigenesis. Although there was no mention of an association between BRAF mutation and TROP2 expression in the abovementioned studies, BRAF mutation was an important factor influencing TROP2 expression. Therefore, when diagnosing the cases with no TROP2 expression, PTC cannot be ruled out because PTC without BRAF mutation does occur. In other words, before interpreting TROP2 expression for differential diagnosis of PTC especially with FNA, BRAF mutation status should be considered. We also divided PTC into the two histological subtypes, classical and follicular variant of PTC. Most cases of follicular variant of PTC showed no TROP2 immunoreactivity, however, 20 classical PTC cases (47.6%) showed TROP2 immunoreactivity. TROP2 expression had a significant correlation with histological subtype. Therefore, in clinical practice, applying TROP2 IHC may help in the diagnosis of classical PTC cases having BRAF mutation. We also carried out further in vitro studies to clarify the association between BRAF mutation and TROP2 expression. We observed TROP2 mRNA expression in three thyroid cancer cell lines with BRAF mutation, but no such expression in a normal thyroid cell line. Interestingly, Western blot analysis revealed that TROP2 protein expression was detected in a normal thyroid cell line after introduction of the BRAF V600E mutation via viral infection. These results support our IHC study of the association between TROP2 expression and the BRAF V600E mutation in PTC. Expressions of ERK and p-ERK were also increased after introduction of the BRAF V600E mutation compared to controls. The fact that BRAF mutations contribute to PTC tumorigenesis by activating the mitogen-activated protein kinase (MAPK) pathway has been well-established [19,20]. TROP2 expression also promotes tumorigenesis by activating the MAPK/ERK pathway, which has important implications for various cellular pathways, leading to cancer cell proliferation, migration, invasion, and survival [21]. Activation of the MAPK/ERK pathway also contributes to tumor invasion and metastasis as well as tumor growth by interacting with other molecules and signaling pathways [22,23]. In view of this, we hypothesized that TROP2 expression may be correlated with BRAF mutation status to directly or indirectly induce ERK pathway activation. ERK pathway activation affects the tumor progression or clinical outcomes. However, our present study did not explain exactly what molecules are involved in activating ERK. Therefore, we will determine the details of signaling between TROP2 and BRAF mutation in a future study. As previously mentioned, TROP2 overexpression is associated with aggressive biological behavior and poor prognosis in pancreatic, gastric, colorectal, oral, endometrial, and ovarian cancers. However, the relationship between TROP2 expression and PTC outcome remained unclear until now; we assume that TROP2 expression may confer poor PTC prognosis like other epithelial tumors. However, our results did not show a correlation between TROP2 expression and aggressive clinicopathological features including extrathyroidal extension (p = .099) and lymph node metastasis (p = .191). We believe these limitations arose from the relatively small sample size and lack of long-term follow-up. Also, data analysis of the cases divided into two groups according to BRAF mutation and analysis after combining them into one group should be interpreted with caution. Therefore, further studies with a larger number of cases are required to determine whether TROP2 is an indicator of poor PTC prognosis. In conclusion, we found a significant association between TROP2 expression and BRAF mutation in PTC. This correlation was confirmed by IHC staining, RT-PCR, and Western blot analysis. Although the molecular players in thyroid cancer progression have not yet been entirely elucidated, TROP2 may be a key molecule to better understand PTC pathogenesis.
Notes
Conflicts of Interest
No potential conflict of interest relevant to this article was reported.
Acknowledgements
This study was supported by a grant from the Korea Institute of Radiological and Medical Sciences (KIRAMS), funded by the Ministry of Science, ICT and Future Planning, Republic of Korea (1711045543;1711045540/50476-2017).

