Thoracic aortic calcification as a predictor of coronary artery disease: a systematic review and meta-analysis
Article information

Abstract
Background
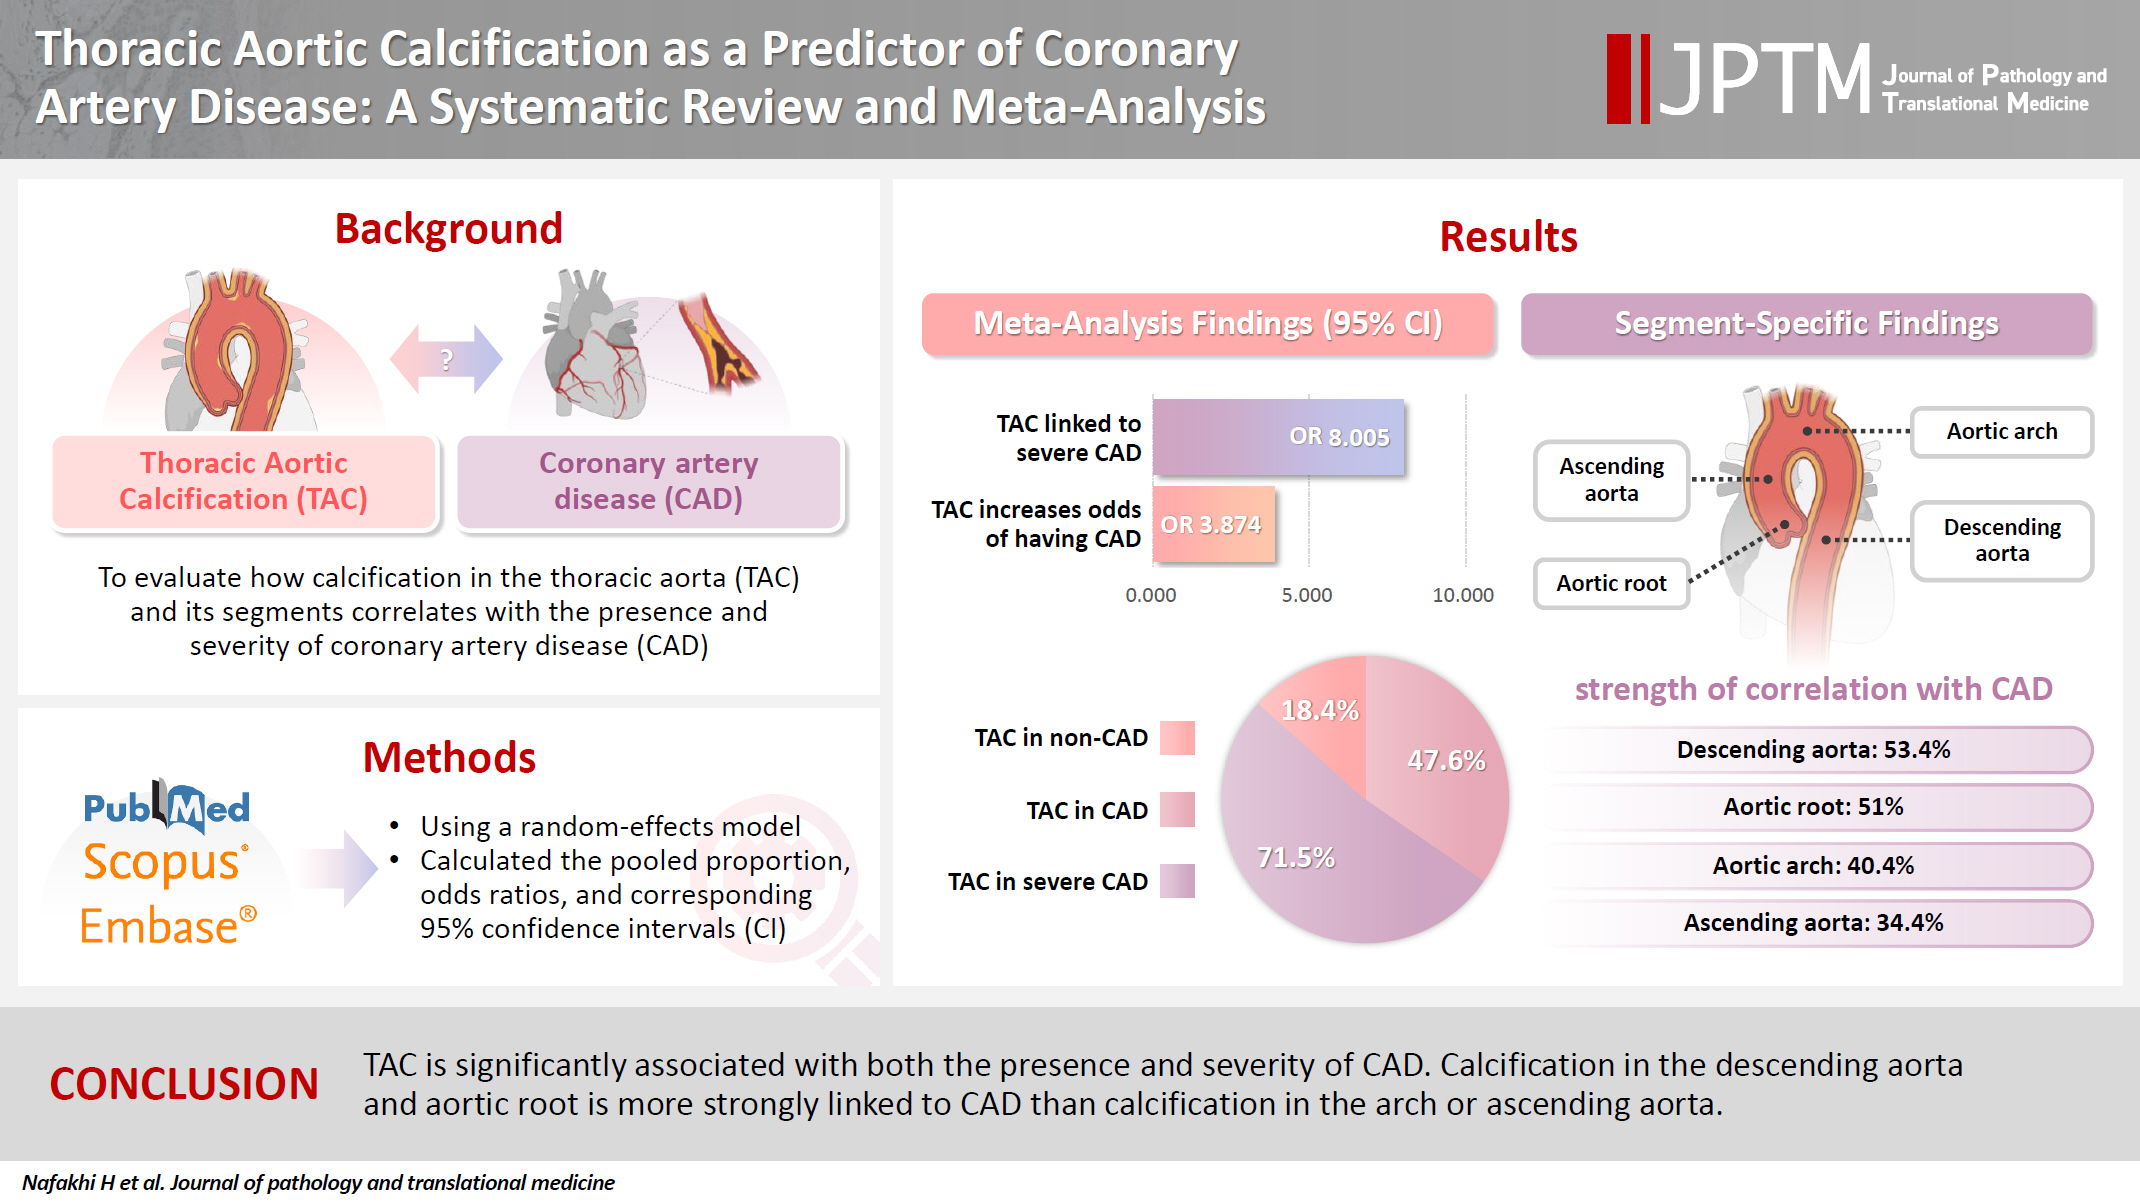
The relationship between coronary atherosclerosis (progression, outcome) and calcification in the thoracic aorta (TAC), particularly across its various segments, is complex and often shows conflicting associations in the literature. To address this debated and complex relationship, we aimed to evaluate how TAC and its segments correlate with the presence and severity of coronary artery disease (CAD).
Methods
We reviewed all articles published between January 1990 and September 2024 that examined the link between TAC and CAD and were indexed in PubMed, Scopus, or EMBASE. Using a random-effects model, we calculated pooled proportions, odds ratios, and corresponding 95% confidence intervals (CIs) to evaluate the association between TAC and CAD, with consideration of severity.
Results
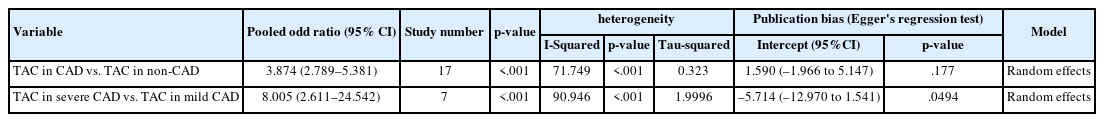
The study included 17 studies with 8,187 participants, 2,775 of whom had CAD (1,059 with severe CAD), and 5,412 of whom did not. The pooled odds ratio of TAC in patients with CAD compared to that in those without was 3.874 (95% CI, 2.789 to 5.381). For severe CAD versus mild CAD, the odds ratio was 8.005 (95% CI, 2.611 to 24.542). Calcification of the aortic root (pooled proportion, 51%; 95% CI, 0.282 to 0.733) or descending aorta (pooled proportion, 53.4%; 95% CI, 0.341 to 0.718) had the strongest association with CAD compared to calcification of the arch or ascending aorta.
Conclusions
TAC is significantly associated with both the presence and severity of CAD. Calcification in the descending aorta and aortic root is more strongly linked to CAD than calcification in the arch or ascending aorta.
INTRODUCTION
The aorta, the body’s largest elastic artery, is located in close proximity to the coronary arteries and heart. Due to its large surface area, it is particularly susceptible to the harmful effects of cardiovascular risk factors, leading to atherosclerotic plaques [1,2].
Coronary artery calcification (CAC) and thoracic aortic calcification (TAC) share common risk factors, such as diabetes, aging, hypertension, and smoking, despite differences in their embryology and calcification patterns [3,4].
TAC can be detected using the same imaging protocols employed for CAC, and it can be identified easily through chest radiography and computed tomography (CT) imaging, which are often used for non-cardiac screenings or cardiovascular risk assessments [5,6]. Several clinical studies have explored the associations between TAC, its individual segments, and coronary artery disease (CAD), demonstrating that TAC helps to predict CAD and cardiovascular risk by indicating increased arterial stiffening without requiring additional radiation or cost [2,3,7,8].
While CAC is widely recognized as a reliable predictor of CAD and coronary adverse events across several guidelines, neither the primary prevention guidelines of the European Society of Cardiology nor those of the American College of Cardiology/American Heart Association incorporate aortic calcification in their stepwise approach to preventing major adverse cardiac events in patients with atherosclerotic cardiovascular disease [2].
Large population-based studies such as the Multi-Ethnic Study of Atherosclerosis (MESA) and the Heinz Nixdorf Recall (HNR) study have reported an age- and sex-related distribution of TAC that is like that of CAC. However, the prevalence rates of CAC and TAC vary between studies. For example, in MESA, the TAC prevalence was 28%, while CAC was present in about 50% of patients, with TAC showing independent predictive value for CAD in women but not in men [9-11]. In contrast, the HNR study found a TAC prevalence of 63.1% and a CAC prevalence of 67.9% [10-12].
In the literature, the relationship between coronary atherosclerosis and TAC, including its various segments, remains complex, with contradictory findings reported in studies using the MESA database [2,13,14].
The present study seeks to address this gap by estimating a more accurate prevalence of TAC in patients with CAD and evaluating its severity using various imaging modalities. Additionally, we conducted a subgroup analysis to assess the relationship between calcification in different segments of the thoracic aorta—the aortic root, arch, ascending aorta, and descending aorta—and the presence of CAD.
MATERIALS AND METHODS
Study protocol
This meta-analysis followed the guidelines of the Preferred Reporting Items for Systematic Reviews and Meta-Analyses statement [15]. The protocol for the study was not registered in any database.
Search strategy
We conducted a comprehensive electronic search of the PubMed Central, Scopus, and EMBASE literature databases from January 1990 to September 2024. No language restrictions were applied during the search, although all included articles were published in English. We used a combination of the following search terms: “thoracic aorta calcification,” “aortic calcification,” “aortic root calcification,” “arch of aorta calcification,” “ascending aorta calcification,” “descending aorta calcification,” “coronary atherosclerosis,” “coronary artery calcification,” and “coronary artery disease.” In addition, the reference lists of relevant studies were manually searched to identify other pertinent publications.
CAD and TAC definitions
CAD is defined as stenosis of any severity in at least one coronary arterial segment. However, the definition of CAD severity varies across studies. For example, one study used conventional angiography to categorize CAD as mild (0%–50% stenosis), severe (51%–99% stenosis), or advanced (100% luminal stenosis) [14]. Another study defined severe CAD based on coronary angiography results that led to stent placement or bypass surgery [16]. Some studies classified patients by Syntax score, with a low score defined as ≤22 points and a high score defined as >22 points [17]. In our study, severe CAD was considered present when coronary stenosis was ≥50%, a high Syntax score was recorded, or stent placement or bypass surgery was required. Patients with stenosis severity <50% or a low Syntax score were classified as having mild CAD. TAC was defined as the sum of calcium scores in the ascending and descending aortas or the presence of calcification in any aortic segment, as detected by CT imaging, chest radiography, or echocardiography.
Inclusion criteria
This investigation encompassed all studies involving CAD patients as the experimental group and non-CAD patients as the control group, with documented sample sizes for both groups. Additionally, quantitative TAC measurements obtained via CT, echocardiography, or plain chest radiography were included, provided they were classified under the same category. Finally, studies comparing TAC prevalence between CAD and non-CAD groups, along with those with full-text versions available in English, were included.
Exclusion criteria
Literature reviews, case reports, letters to the editor, editorials, or studies without original data were excluded. Similarly, animal studies and studies lacking sufficient information on sample sizes, CAD versus non-CAD groups, or those presenting TAC solely as a continuous or median variable instead of a binary variable were excluded. Finally, duplicate publications identified through reference checking or bibliographic databases and non-English articles were removed from consideration.
Statistical analysis
We used a random-effects model to estimate pooled proportions, odds ratios (ORs), and corresponding 95% confidence intervals (CIs) for the association between TAC and CAD, as well as the severity of CAD. This model accounts for potential variability across studies, considering differences in study design, population, and methodology. The analysis was performed using the Comprehensive Meta-Analysis software (Biostat, Inc; Englewood, NJ, USA) [18].
Heterogeneity assessment
To assess variability in effect sizes across studies, we used a multi-pronged approach. Formal heterogeneity testing included Cochran’s Q statistic, I-squared (I2) to quantify the percentage of variability due to heterogeneity, and Tau-squared (τ2) to estimate between-study variance. I2 values were interpreted using established guidelines [19,20]: 0%–25% suggested low or no heterogeneity, 25%–50% moderate, 50%-75% substantial, and 75%–100% considerable heterogeneity. Observed heterogeneity, reflected in I2 values, was partly attributed to differences in methodological approaches used for assessing the thoracic aorta.
In this study, both the I2 test and τ2 test were used to explore heterogeneity. The τ2 test quantifies the amount of heterogeneity by estimating the between-study variance, which represents the variability in true effect sizes across studies. As a general rule, a larger τ2 value indicates greater heterogeneity; τ2 = 0 indicates no significant heterogeneity, while τ2 > 0 indicates significant heterogeneity.
Publication bias assessment
We evaluated publication bias using funnel plots and Egger’s regression test. Publication bias occurs when studies with statistically significant results are more likely to be published than those with non-significant findings. Egger’s regression test was employed to assess publication bias. p < .05 suggests asymmetry in the funnel plot, indicating a potential risk of bias. Conversely, p > .05 suggests no strong evidence of bias.
Study quality assessment
The Quality Assessment Tool for Diagnostic Accuracy Studies-2 (QUADAS-2) was used to evaluate the risk of bias in the included studies. This tool assesses four domains related to study design (patient selection, index test, reference standard, and flow and timing) and three domains concerning applicability (patient selection, index test, and reference standard). Signaling questions in each domain helped assess potential bias, with responses categorized as “yes,” “no,” or “unclear.” Based on the QUADAS-2 scoring system, the overall risk of bias was judged as “low,” “high,” or “unclear.” If a study scored “low” in all domains related to bias or applicability, it was regarded as displaying “low risk for both.” Conversely, if the study scored “high” or “unclear” in one or more domains, it was judged as having a “risk of bias” or “applicability concern” [21].
RESULTS
Study characteristics and quality assessment
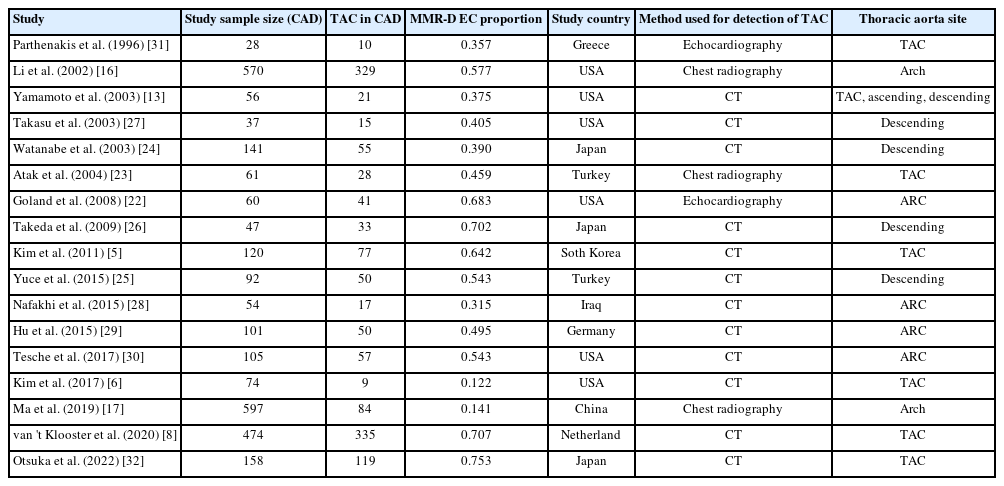
A total of 647 potentially relevant studies was identified through the electronic literature search. Following a rigorous screening process, 563 studies were excluded based on predefined criteria. The remaining 84 full-text articles underwent eligibility assessment, and 17 studies were included in the final meta-analysis (Fig. 1) [5,6,8,14,16,17,22-32].
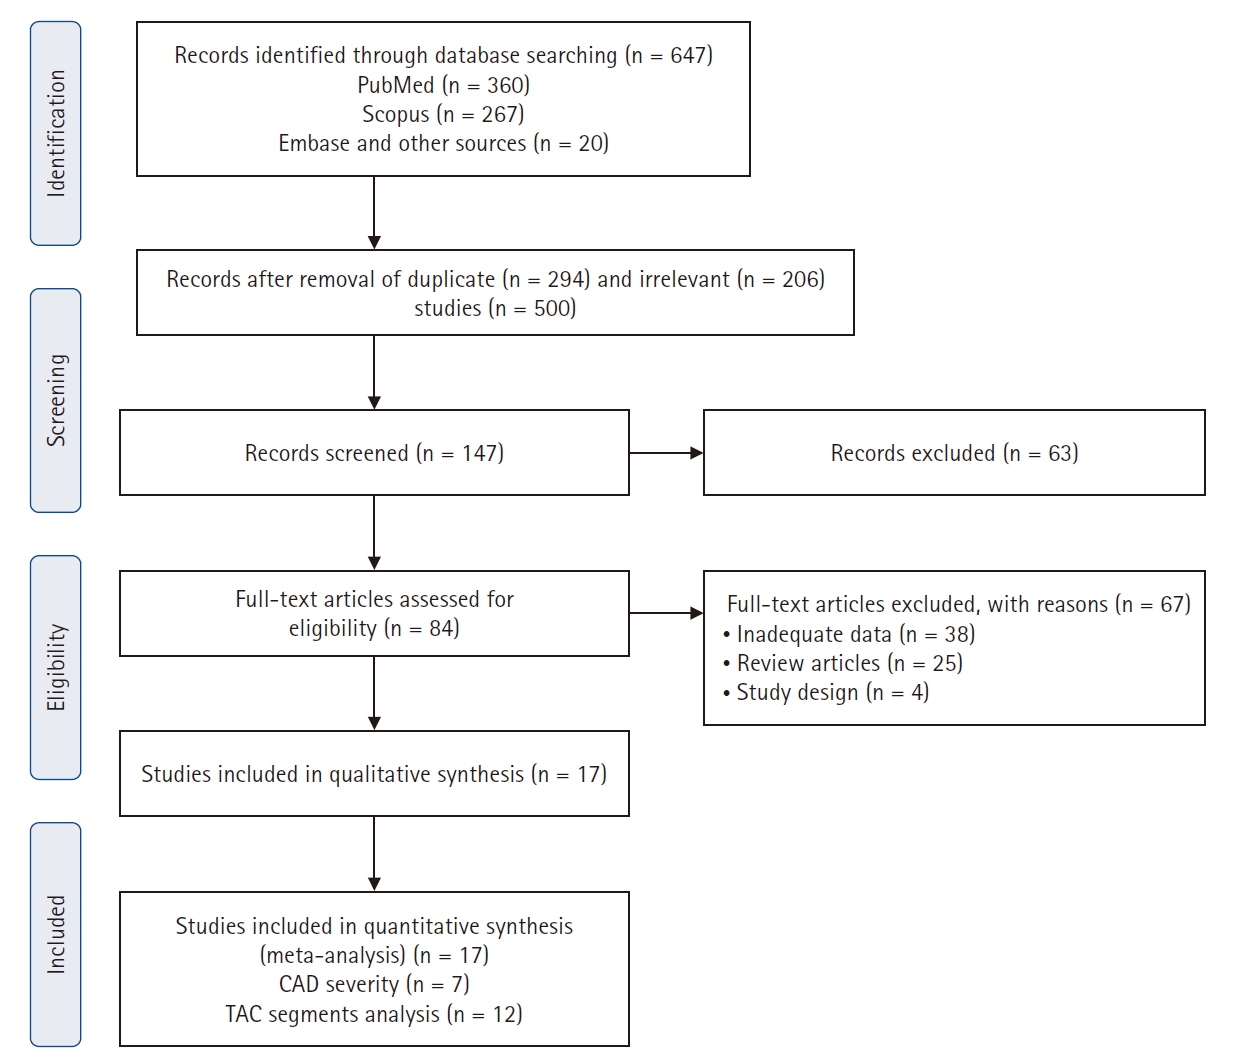
Study flowchart. CAD, coronary artery disease; TAC, thoracic aortic calcification.
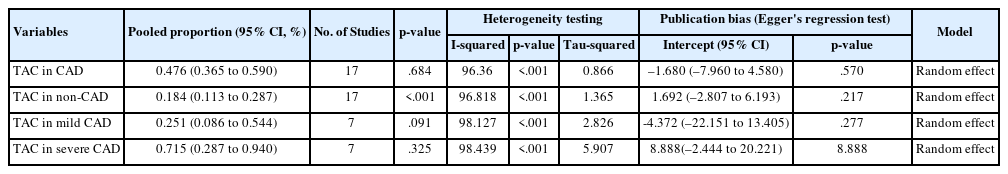
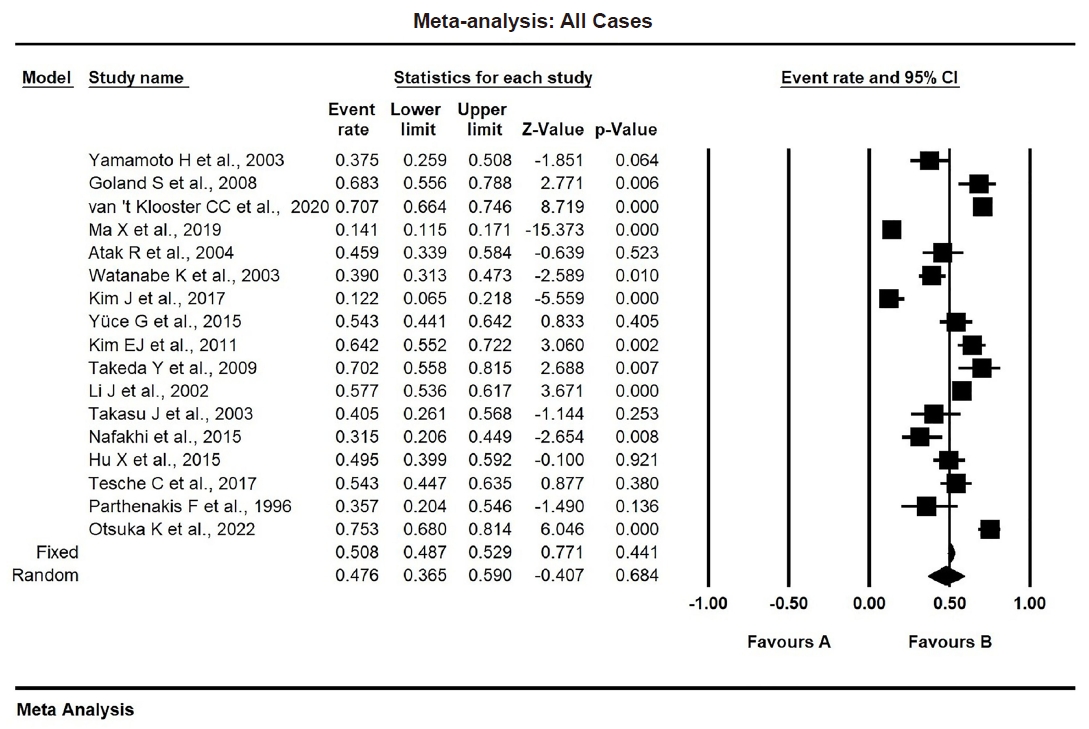
The risk of bias and applicability concerns of the included studies were assessed using the QUADAS-2 tool, with most studies demonstrating low risk (Supplementary Fig. S1). The study characteristics are summarized in Table 1. The included studies involved 8,187 individuals, 2,775 of whom were assigned to the CAD group and 5,412 of whom were assigned to the non-CAD group. Within the CAD group, 1,576 patients had mild CAD, while 1,059 had severe CAD. Separately, a total of 1,366 patients was identified as having TAC. The pooled proportion of TAC was 0.476 (95% CI, 0.365 to 0.590) (Table 2). The study publication dates spanned from 1996 to 2022, with all articles published in English. Methods for detecting TAC included CT (n = 12), chest radiography (n = 3), and echocardiography (n = 2).
Study characteristics
The associations of TAC with CAD and its severity
Frequency and subgroup analysis
The overall proportion of TAC in CAD patients was 47.6% (pooled proportion, 0.476; 95% CI, 0.365 to 0.590). Due to significant heterogeneity (I2 = 96.36 %, p < .001, τ2 = 0.866), a random-effects model was used. Publication bias was evaluated using funnel plots and Egger’s regression test (Table 2, Fig. 2).
The problem of heterogeneity was solved by adopting a random-effects model throughout the analysis. On other hand, subgroup analysis was performed with regard to the TAC detection method and study location.
Subgroup analyses explored potential sources of heterogeneity, including study location (Asia, the United States, or Europe), as shown in Supplementary Fig. S2, and the TAC detection method (CT, echocardiography, or chest radiography), as depicted in Supplementary Fig. S3.
Sensitivity analysis
To ensure the reliability of our findings, we performed sensitivity analyses by omitting individual studies from the meta-analysis and recalculating the pooled proportion. This approach helped assess the impact of each study on the overall results. The findings, presented in Supplementary Table S1, indicate that our results were stable. Omitting individual studies did not significantly alter the pooled estimates, demonstrating that the findings are robust and not overly dependent on any single study.
Clinical and demographic data characteristics
We extracted clinical and demographic data from the eligible studies included in the meta-analysis, focusing on the pooled proportions and ORs for various variables. The pooled mean age of participants was 61.3 years (standard error, 1.292).
TAC
The pooled proportion of TAC in patients with CAD was 47.6% (95% CI, 0.365 to 0.590), whereas, in non-CAD patients, it was 18.4% (95% CI, 0.113 to 0.287) as shown in Table 2, Fig. 2, and Supplementary Fig. S4. In mild CAD, the proportion of TAC was 25.1% (95% CI, 0.086 to 0.544), while in severe CAD was 71.5% (95% CI, 0.287 to 0.940) as shown in Table 2 and Supplementary Figs. S5 and S6.
The proportion of TAC by site in CAD patients was as follows. In the aortic arch, it was 40.4% (95% CI, 0.184 to 0.670); in the aortic root, it was 51% (95% CI, 0.282 to 0.733); in the ascending aorta, it was 34.4% (95% CI, 0.117 to 0.673); and, in the descending aorta, it was 53.4% (95% CI, 0.341 to 0.718), as shown in Fig. 3 and Supplementary Table S2. These results suggest a significant association (p < .001) between TAC and CAD. Moreover, TAC may indicate a greater likelihood of severe CAD, with calcification in the descending aorta and aortic root showing stronger associations with CAD compared to that in the ascending aorta and aortic arch.
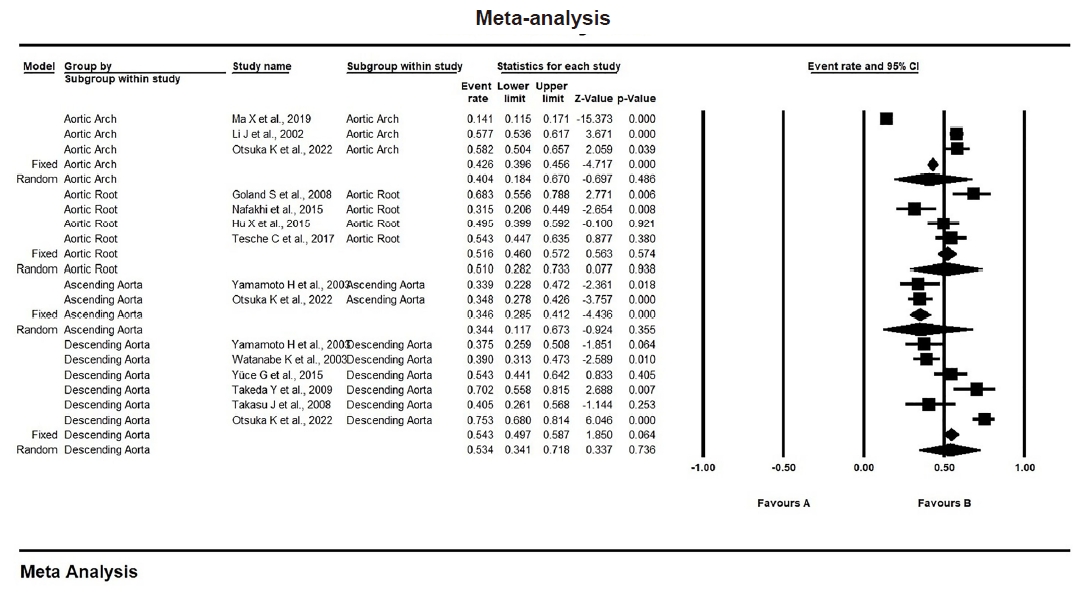
Subgroup analysis was performed with respect to the site complicated by thoracic aortic calcification (TAC)—whether the aortic root, aortic arch, or ascending or descending aorta. Calcification in the descending aorta and aortic root showed stronger associations with coronary artery disease (CAD) compared to that in the ascending aorta and aortic arch [12,14,16,17,22,24-26,28-30,32]. CI, confidence interval.
TAC in relation to CAD severity
The ORs for TAC compared between CAD and non-CAD patients, as well as those compared between severe and mild CAD, are provided in Table 3 and Supplementary Figs. S7 and S8.
Pooled odd ratios of TAC in patients with CAD
The pooled OR for TAC in CAD versus non-CAD cases was 3.874 (95% CI, 2.789 to 5.381) as depicted in Table 2 and Supplementary Fig. S7. On other hand, the pooled OR for TAC in severe CAD versus mild CAD was 8.005 (95% CI, 2.611 to 24.542), as noted in Table 2 and Supplementary Fig. S8.
These findings suggest that the presence of TAC increases the risk of CAD by four times and the risk of severe CAD by eight times.
DISCUSSION
This meta-analysis and systematic review found three key results: (1) TAC was significantly linked to CAD, despite variations between the studies analyzed. These differences were addressed using a random-effects model to calculate pooled proportions and ORs; (2) TAC was strongly associated with severe CAD; and (3) calcification in the descending segment and aortic root of the thoracic aorta showed a stronger correlation with CAD than that in the aortic arch or ascending segment. However, significant heterogeneity was observed between the included studies. This variation is most likely attributable to several factors, including geographical differences in patient populations. Diverse ethnicities and environmental exposures can influence both the prevalence and severity of TAC in CAD. The second factor is detection methods, where techniques with lower sensitivity or specificity may fail to detect the disease or produce false positives, contributing to heterogeneity. The third factor is the inclusion criteria employed by individual studies, as stricter criteria might result in a lower prevalence compared to broader inclusion criteria.
Atherosclerosis is a gradual systemic disease that starts in childhood, first affecting the aorta. Over time, it evolves from fatty streaks to more severe lesions, causing changes in blood flow in adulthood [14]. Some studies suggest that changes in the aorta, especially in the aortic root and abdominal aorta, occur before coronary atherosclerosis or cardiovascular disorders, even in patients who have no CAC or normal myocardial perfusion scans [33,34].
Much of the data connecting TAC and CAD are from studies on CAC. Previous research shows a strong relationship between TAC and CAC, implying that TAC may provide valuable insights into overall coronary risk and could support the need for early screening and aggressive management of modifiable risk factors [5,6].
The findings from two large studies, MESA and HNR, align with the results of the present meta-analysis [6,11]. Kim et al. [6] reported a strong association between TAC and incident cardiovascular disease, including CAD and all-cause mortality, in unadjusted analyses of 3,415 MESA participants with baseline CAC = 0 over a median follow-up of 11 years. Similarly, Kalsch et al. [11] demonstrated that TAC progression was positively associated with incident hard coronary events after adjusting for baseline cardiovascular risk factors and CAC in 3,080 participants based on HNR study data. These findings suggest TAC as a surrogate marker for CAD risk. These population-based cohort studies support the use of TAC as a marker for CAD presence and its potential predictive role for adverse coronary events, in addition to conventional cardiovascular risk factors.
In this meta-analysis, various imaging methods were used to assess TAC, including CT, chest X-rays, and echocardiography. These methods can produce different results based on patient characteristics, such as symptoms or risk factors, or based on the limitations of the imaging tools. For example, severe calcification can make it difficult to measure TAC accurately using echocardiography, which also cannot assess the entire thoracic aorta. On the other hand, CT has better spatial resolution and can simultaneously evaluate coronary circulation and CAC, although it does not cover the aortic arch or proximal descending aorta [10].
Calcification in different parts of the thoracic aorta—like the ascending aorta, aortic arch, descending aorta, and aortic root—was significantly linked to the presence of CAC and, therefore, CAD after adjusting for conventional cardiovascular risk factors [35]. However, it remains unclear whether calcification in specific aortic segments accurately reflects the systemic nature of atherosclerosis or helps predict specific disease outcomes [3]. There are also no clear guidelines on the parts of the thoracic aorta to focus on or which imaging methods to use for measuring TAC [13].
Each aortic segment has a unique embryonic origin and is exposed to different hemodynamic forces, which likely influences vulnerability to calcification. This means that the calcium levels in each segment could be related to different cardiovascular risk factors and have varying predictive value for cardiovascular diseases [13]. The current meta-analysis found that calcification in the descending aorta and aortic root showed a stronger association with CAD risk than other segments, aligning with earlier observational studies. Previous research has shown that calcification in the descending aorta is more common (56.6%) than that in the ascending aorta (42.9%) across all age groups [11]. Some studies also suggest that descending aorta calcification has the strongest link to advanced and obstructive CAD [14,36].
The aortic root, which is part of the ascending thoracic aorta, is anatomically close to the origins of the coronary arteries. This may mean that calcification in the aortic root reflects localized atherosclerosis, rather than the more widespread patterns seen in other aortic segments. Previous studies have found strong associations between aortic root calcification, CAC, severe CAD, aging, and high blood pressure [13,28].
The present meta-analysis and systematic review was designed to examine the connections between TAC and its segments, as well as the presence and severity of CAD. This study has several strengths. First, it included a large number of studies, increasing the statistical power and accuracy of the pooled estimates. Second, it incorporated studies from different countries and populations (Europe, Asia, and the United States), making the findings more generalizable. However, there are also limitations. Many of the studies included were retrospective, which can introduce biases and limit the ability to determine cause–effect relationships between TAC and CAD. Additionally, pooling the results of different studies increases the heterogeneity, as each study may involve different populations, techniques, and methods.
Additionally, the definition of TAC varied across studies due to differences in imaging techniques (e.g., CT, echocardiography, plain chest X-ray). Even among studies using the same technique, discrepancies contributed to heterogeneity. To address this issue, subgroup and sensitivity analyses were performed using random-effects models, which confirmed the robustness of our findings. Publication bias is another challenge in meta-analyses. We attempted to mitigate this by conducting a comprehensive search for eligible studies and assessing bias both visually using funnel plots and statistically using Egger’s regression test. Two independent authors selected the studies for inclusion, with disagreements resolved through discussion and oversight from a senior author. Future prospective cohort studies should aim to investigate the causal relationship between TAC and CAD risk and determine whether early detection of TAC, especially in specific aortic segments, has prognostic value for coronary and cardiovascular events. Such studies could guide the development of more targeted and appropriate interventions.
In summary, this meta-analysis significantly enhances our understanding of TAC in CAD and its severity and supports the development of personalized medicine strategies to improve patient outcomes. Future prospective cohort studies are needed to determine whether early detection of TAC, particularly in specific aortic segments, has prognostic value. These studies could also clarify the causal relationship between TAC and CAD risk, leading to more precisely targeted treatments.
In conclusion, TAC was significantly associated with CAD presence and severity. Calcification of the descending aorta and aortic root was more closely associated with CAD than was calcification of the arch or ascending part.
Supplementary Information
The Data Supplement is available with this article at https://doi.org/10.4132/jptm.2025.03.05.
Notes
Ethics Statement
This meta-analysis received ethical approval from the Ethical Committee for Clinical Studies at the Faculty of Medicine, University of Kufa (approval no. MEC-71, dated October 16, 2024). The authors are committed to upholding the highest ethical standards and ensuring accuracy in all reported information.
Availability of Data and Material
All data available in the published studies and the supplementary materials online.
Code Availability
Not applicable.
Author Contributions
Conceptualization: ASJ, AAY. Data curation: ASJ, HN. Formal analysis: ASJ, HN. Methodology: ASJ, AAY, HN. Project administration: AAY, ASJ. Resources: ASJ, HN. Software: ASJ, HN. Supervision: ASJ, AAY. Validation: ASJ, HN. Visualization: HN, AAY. Writing—original draft: ASJ, AAY, HN. Writing—review & editing: AAY, HN. Final approval of manuscript: all authors.
Conflicts of Interest
The authors declare that they have no potential conflicts of interest.
Funding Statement
No funding to declare.