Evaluation of potential prognostic significance of JUNB in human prostate cancer: a bioinformatic and histopathological study
Article information

Abstract
Background
Prostate cancer is one of the most common malignancies in males worldwide. Serum prostate-specific antigen is a frequently employed biomarker in the diagnosis and risk stratification of prostate cancer; however, it is known for its low predictive accuracy for disease progression. New prognostic biomarkers are needed to distinguish aggressive prostate cancer from low-risk disease. This study aimed to identify and validate potential prognostic biomarkers of prostate cancer.
Methods
Two prostate cancer datasets from the Gene Expression Omnibus were analyzed to identify differentially expressed genes between benign prostatic hyperplasia (BPH) and prostatic carcinoma. Immunohistochemistry was used to evaluate the JUNB proto-oncogene, a subunit of the AP-1 transcription factor (JUNB), in 70 prostate cancer patients and 10 BPH samples.
Results
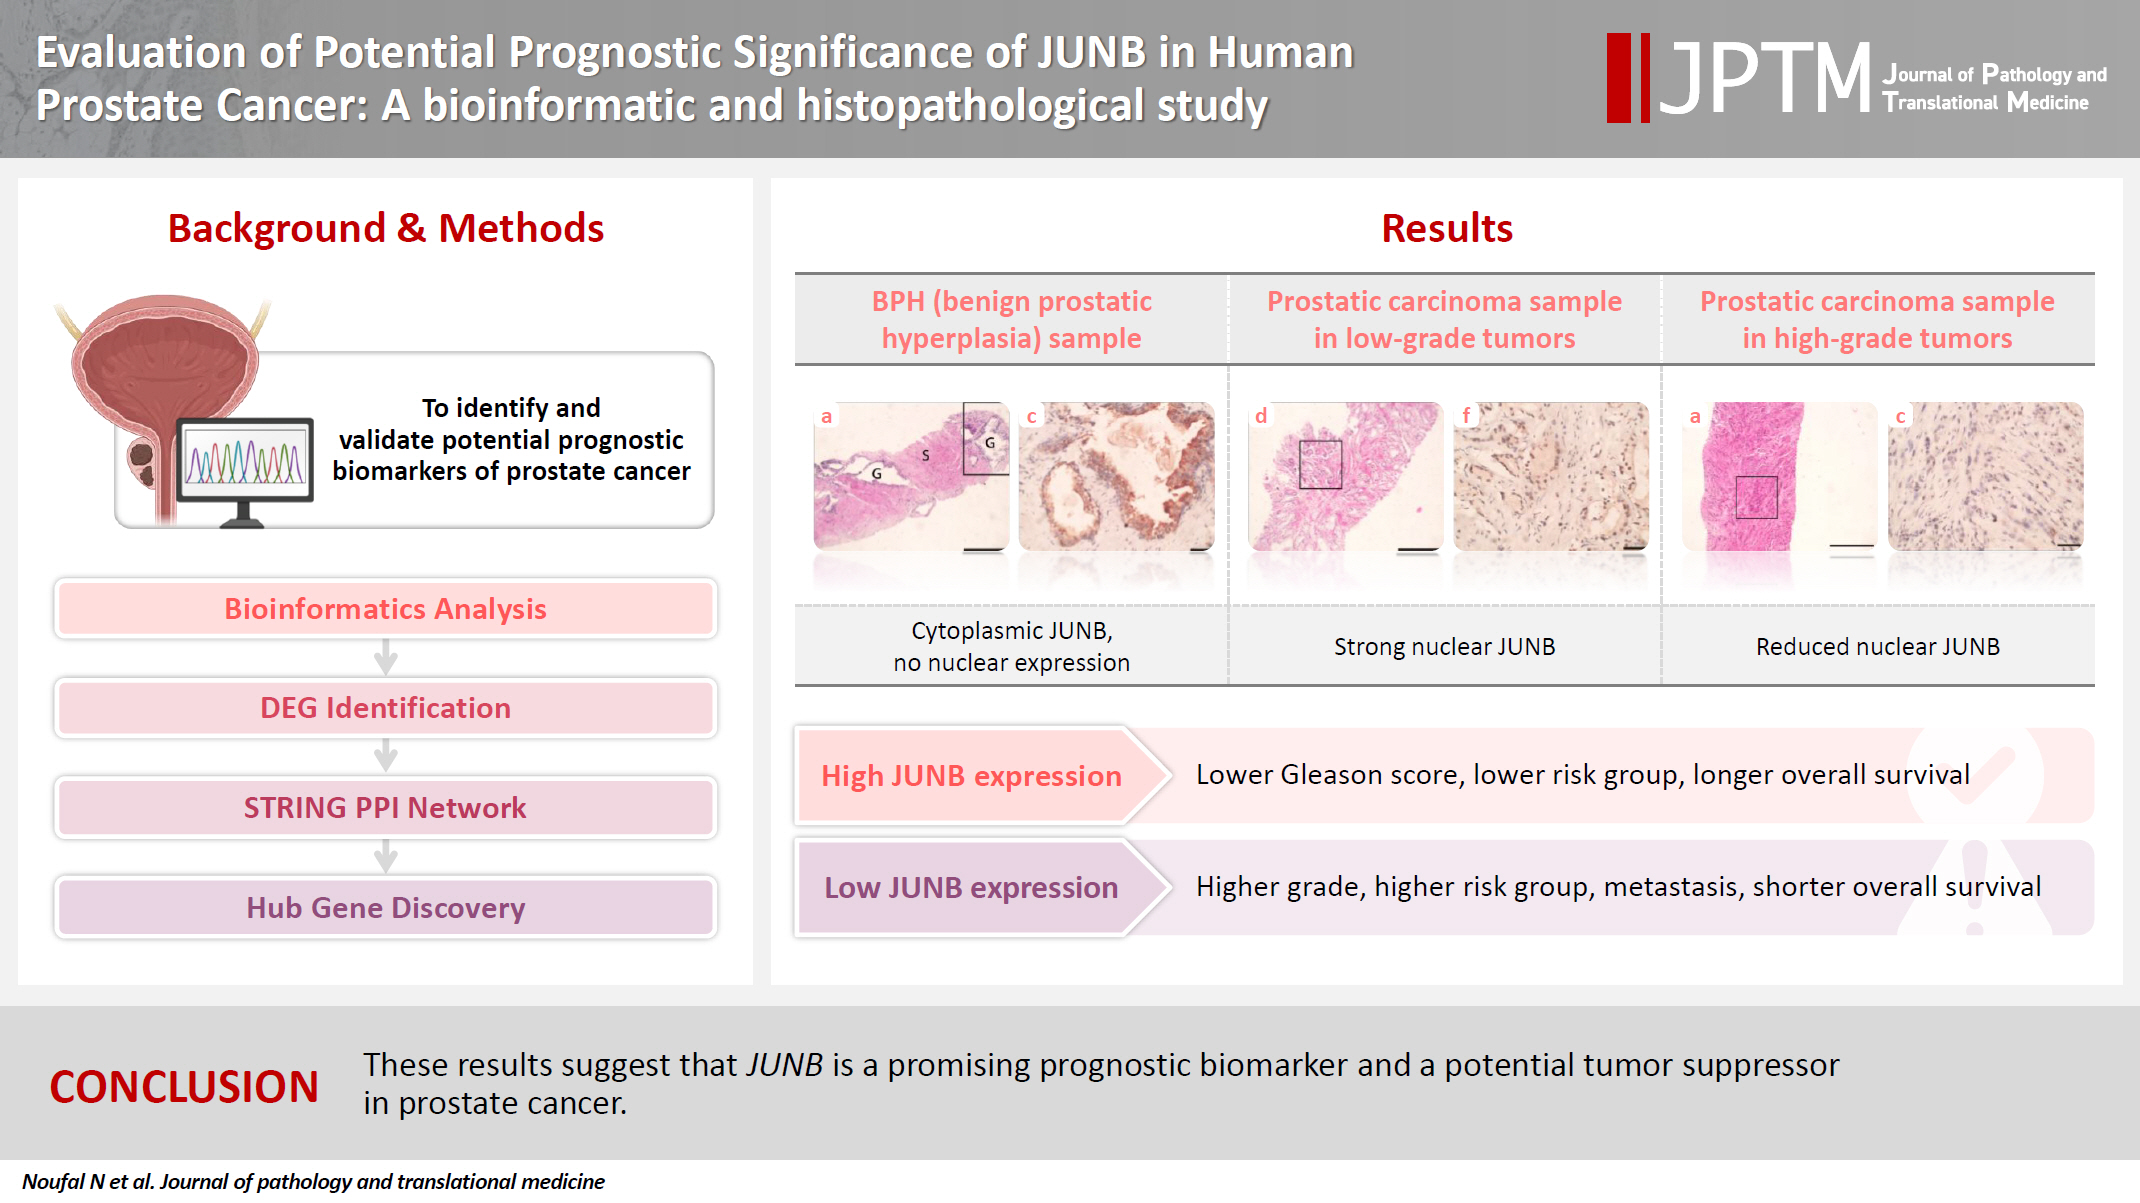
Our findings showed that JUNB was significantly enriched in prostate cancer-related pathways and biological processes. JUNB expression was considerably higher in prostatic adenocarcinoma patients than in BPH patients. Regarding JUNB expression in prostate cancer cases, lower levels of JUNB expression were associated with higher grades of prostatic adenocarcinoma. Lower JUNB expression was associated with a higher risk of prostatic adenocarcinoma progression and shorter overall survival.
Conclusions
These results suggest that JUNB is a promising prognostic biomarker and a potential tumor suppressor in prostate cancer.
INTRODUCTION
Prostate cancer is the second most prevalent malignancy among men, after cutaneous cancer. In 2020, the estimated number of newly diagnosed prostate cancer cases made it the fourth most frequently diagnosed cancer worldwide [1]. Prostate cancer is a heterogeneous disorder that manifests with a wide range of pathological and clinical features. Multiple genetic and epigenetic alterations may contribute to the heterogeneity of prostate cancer, highlighting the considerable difficulty in the molecular stratification of these patients [2]. The Gleason grading system remains the most clinically useful predictor of prostate cancer progression [3]. Serum prostate-specific antigen (PSA) is a widely used marker for risk stratification and prostate cancer diagnosis, but its predictive accuracy for disease progression is limited [4]. Although many clinically useful biomarkers are available, there is a pressing need to identify molecular and genetic elements that can be employed for more precise risk assessment and for tailoring personalized treatment decisions.
Activating protein-1 (AP-1) transcription factor complexes are involved in various oncogenic pathways, including those regulating growth, proliferation, apoptosis, invasion, and metastasis in different types of cancer [5-7]. Dysregulation of various AP-1 subunits results in oncogenic or tumor-suppressive effects in a context-dependent manner [8]. The JunB proto-oncogene, a subunit of the AP-1 transcription factor (JUNB), has been expressed differently in various malignancies, including head and neck carcinomas and Hodgkin’s lymphomas [9,10]. Based on many in vitro studies, JUNB is associated with crucial signaling pathways relevant to cancer initiation and progression, including cell proliferation and re-entry into the cell cycle [11,12].
Currently, novel prognostic and predictive biomarkers are needed to distinguish patients with aggressive prostatic carcinomas from those with low-risk disease. In the current histopathological study, the main goal was to identify and verify potential prognostic markers in prostate cancer by analyzing differentially expressed genes (DEGs) between benign prostatic hyperplasia (BPH) and prostate cancer. JUNB, a hub gene, was evaluated at the protein level by immunohistochemical (IHC) analysis of human specimens from prostate cancer and BPH patients. This is the first comprehensive analysis of the impact of different JUNB expression patterns in human prostate tissue samples.
MATERIALS AND METHODS
Data sources
Data mining of two publicly available gene expression datasets (GSE55599 and GSE5377) acquired from the Gene Expression Omnibus (GEO) database of the National Center for Biotechnology Information (NCBI) (https://www.ncbi.nlm.nih.gov/geo/) was performed [13]. GEO is a publicly accessible functional genomics repository containing sequence- and microarray-based data that facilitate access to experiments and curated gene expression profiles. These two datasets were selected based on their relevance to prostate cancer, the inclusion of both tumor and normal tissue samples, and a sufficient sample size for differential gene expression analysis. The GSE55599 dataset included 48 tissue samples (32 prostate cancer, 10 BPH, and 6 bladder carcinomas). For the GSE55599 dataset, the platform used for the prostate tissue microarray datasets was the GPL10558 Illumina HumanHT-12 V4.0 expression bead chip. The GSE5377 dataset included 20 tissue samples (17 prostate cancer and three BPH). The gene expression profile of the GSE5377 dataset was obtained using the GPL201 [HG-Focus] Affymetrix Human HG-Focus Target Array.
Identification of DEGs
To identify DEGs, GEO2R, an interactive web tool, uses the GEOquery and limma R packages to analyze and compare benign and malignant prostatic tissue samples in the GEO series. GEO2R applies quantile normalization to ensure uniform expression distributions across samples. The data underwent log transformation using an auto-detect feature that examined the values of the selected samples and automatically applied a log2 transformation to values that were not already in the log space. The results obtained using GEO2R are presented in a gene table arranged according to the significance level. Additionally, graphical plots are created to aid in visualizing the DEGs and evaluating the dataset’s quality. The GEO2R tool adjusted p-values using the Benjamin and Hochberg method to control for the false discovery rate (FDR). The “NCBI generated” category of platform annotation was used to display the results. To determine the DEGs, adjusted p-values (adjusted p-value ≤ .05) and fold change values (log fold change [logFC] ≥ 1) were employed. Any points that did not contain gene symbols were omitted [13]. We analyzed each dataset (GSE55599 and GSE5377) independently to avoid batch effects, and subsequently identified common DEGs through a comparative Venn diagram using FunRich 3.1 [14].
Identification and analysis of hub genes
All retrieved DEGs from GEO2R to the STRING database ver. 11.0 (https://string-db.org/) were submitted to construct the protein-protein interaction (PPI) network [15]. STRING is an online database used to analyze functional networks between multiple proteins using various sources, including co-expression, automated text mining, and previous knowledge in databases. The constructed PPI network incorporated all interactions with a medium confidence score of >0.4. PPI network output data were analyzed using Cytoscape ver. 3.9.0, a freely accessible bioinformatics platform. PPI network analysis was conducted in Cytoscape utilizing ver. 1.6.1.1 of the Molecular Complex Detection (MCODE) [16] clustering algorithm. MCODE is a Cytoscape application that identifies highly interconnected regions (clusters or modules) in networks that perform distinct biological functions. Hub genes were defined as those with an MCODE score of >7. Gene Ontology (GO) functional and Kyoto Encyclopedia of Genes and Genomes (KEGG) pathway enrichment analyses were performed on the most significant hub gene modules using the STRING database. An adjusted p-value of <.05 (FDR) was chosen as the cutoff criterion for each enrichment pathway.
Patients and tissue samples
To validate the results of genetic analysis at the transcriptional level, 70 formalin-fixed paraffin-embedded (FFPE) prostatic adenocarcinoma specimens were collected between January 2014 and January 2020. Additionally, 10 BPH samples were included. To confirm the diagnosis, hematoxylin and eosin staining was used on 5-μm slices obtained from each paraffin block. Two independent histopathologists confirmed histopathological diagnoses of both benign and cancerous tissues and independently assigned the Gleason scores for the cancer cases. The Gleason score was used to grade the included malignant cases, primarily based on assessing the glandular architectural growth patterns of prostate tumors [17]. The glandular differentiation patterns range from 1 to 5, where 1 indicates well-differentiated growth and 5 indicates the prostatic tissues’ most poorly differentiated growth pattern. The collective Gleason score, which ranges from 2 to 10, incorporates the most dominant and the second most common patterns. The prognostic grade group is as follows: grade 1 includes Gleason scores ≤ 6; grade 2 = 3 + 4; grade 3 = 4 + 3; grade 4 = 4 + 4, and 5 + 3; and grade 5= 4 + 5, 5 + 4, and 5 + 5 [18].
The clinical staging of prostate cancer was based on the American Joint Committee on Cancer (AJCC) TNM staging system [19]. The risk of prostatic adenocarcinoma was stratified according to the D’Amico classification. Based on the preoperative PSA level, biopsy Gleason score, and clinical T category, the risk groups were classified as low, intermediate, or high. The criteria for determining prostate cancer risk were as follows: the low-risk group was T1/T2a, PSA ≤ 10 ng/mL, and Gleason score ≤ 6; the intermediate-risk group was T2b, PSA 10–20 ng/mL, and/or Gleason score of 7; and the high-risk group was any combination of the following: ≥T2c, PSA > 20 ng/mL, or Gleason score 8–10 [20]. Patients with any other malignancy or a history of preoperative anticancer treatment were excluded.
IHC staining
IHC staining was performed on 5-μm sections prepared from each FFPE block of the included samples. IHC staining for JUNB (rabbit monoclonal antibody, catalog No. A4848, dilution 1/100, citrate buffer, Abclonal, Woburn, MA, USA) was carried out. The expression of JUNB in the prostatic epithelium was scored using Allred’s score, which combines the percentage and intensity of positively stained nuclei in tumor cells. The percentage of positive tumor cell nuclei was scored as follows: 0 (absence of positive cells), 1 (<1%), 2 (1%–10%), 3 (11%–33%), 4 (34%–66%), and 5 (≥67%). The intensity of nuclear staining was graded on a scale of 0 to 3: 0, no staining; 1, staining is weak; 2, staining is moderate; and 3, staining is intense. The nuclear staining intensity and percentage of positive tumor cell scores were combined to obtain a total score ranging from 0 to 8 [21]. Tumors with an Allred score of ≤3 were considered negative JUNB expression, whereas those with an Allred score > 3 were considered positive JUNB expression. Scoring was performed blindly by two independent pathologists.
Statistical analysis
Statistical analyses of the collected data were performed using R ver. 3.6.1 (R Foundation for Statistical Computing, Vienna, Austria). All categorical variables were expressed as counts and percentages. All numerical data were expressed as medians and interquartile range (IQR), except for age, expressed as mean and standard deviation. A baseline analysis of the clinicopathological features of patients with prostatic adenocarcinoma was performed first. Univariate comparative analysis for age and the differrential expression of JUNB in tissues from prostate cancer patients versus BPH was performed using the independent samples T-test or Wilcoxon rank-sum test for continuous data, according to the distribution and Fisher’s exact test for categorical data. Univariate comparative analysis was used to investigate the association between JUNB expression and the outcomes of prostatic adenocarcinoma (Gleason score, risk groups, metastasis, and types of invasion). The tests were conducted after testing normality using the Shapiro–Wilk test, which revealed that the data were not normally distributed. Kaplan-Meier plots were created to illustrate overall survival (OS) and progression-free survival (PFS) for negative and positive JUNB expression, and p-values were obtained using the log-rank test. A Cox proportional hazards regression model was used to determine the hazard ratio (HR) for OS and PFS according to the different levels of JUNB expression after constructing a smooth HR curve. p-values of <.05 were considered significant with a 95% confidence interval (95% CI).
RESULTS
Identification of DEGs and hub genes associated with prostate cancer
In total, 47,231 genes from GSE55599 and 8,793 genes from GSE5377 were identified and downloaded from the GEO database (Supplemetary Data S1). Genes with an adjusted p-value ≤ .05 and logFC ≥ 1 were considered DEGs [22]. We detected 390 DEGs between BPH and prostatic carcinoma (Fig. 1A–C). Notably, 38 DEGs were identified in both filtered datasets, with 27 being upregulated and 10 being downregulated. One gene, FXYD6, was upregulated in GSE55599 and downregulated in GSE5377.
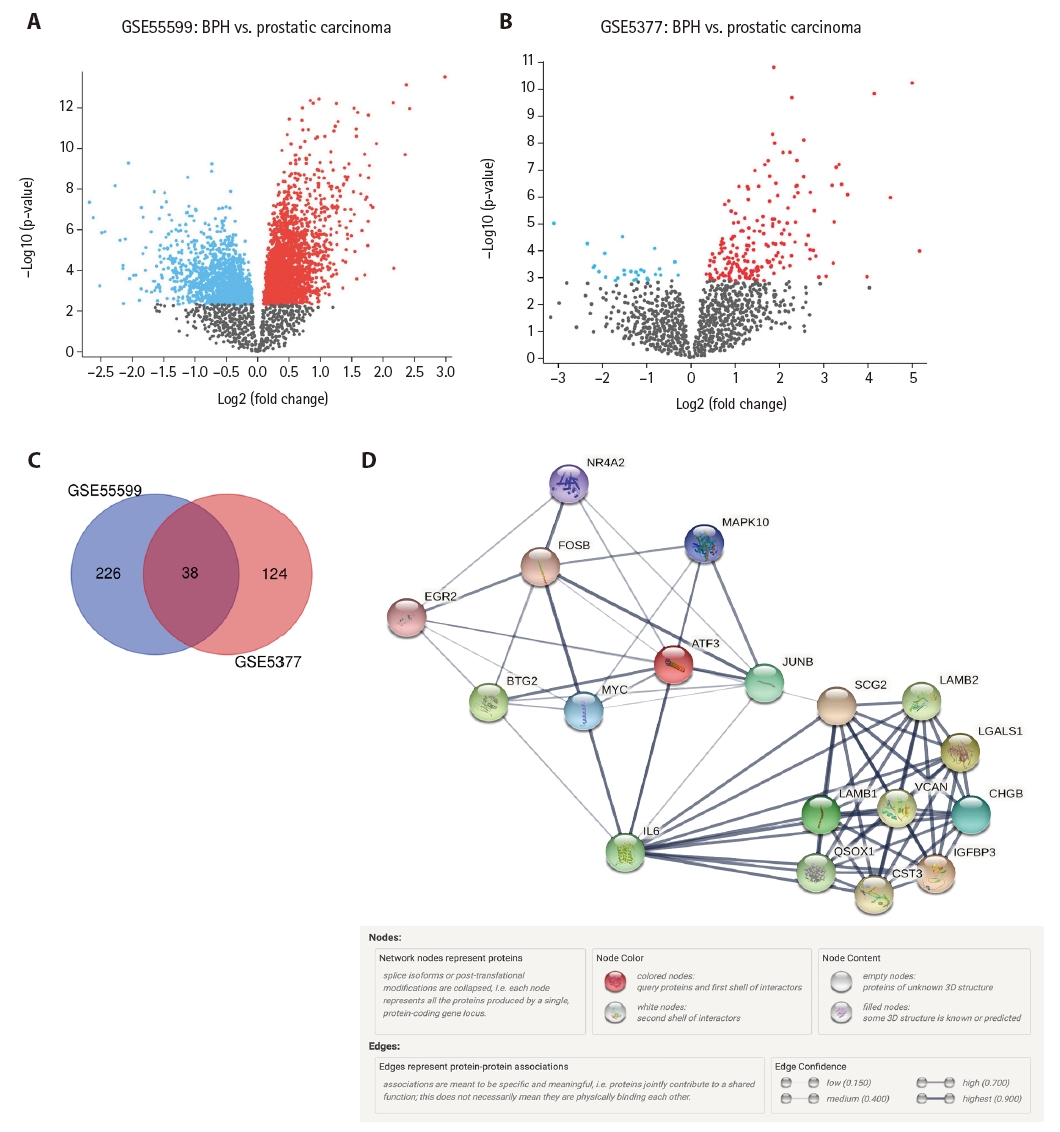
(A) Volcano plot of differentially expressed genes (DEGs) selected from the GSE55599 dataset. (B) Volcano plot of DEGs selected from the GSE5377 dataset. (C) Venn diagrams show the number of unique and common DEGs between the two datasets. (D) Protein-protein interaction (PPI) network of the identified most significant hub genes associated with prostate cancer was created using the STRING online dataset. The constructed PPI network includes 18 nodes (hub genes) and 78 edges, which indicates meaningful connections between the nodes.
The PPI network of the identified 390 DEGs was constructed using the STRING online database, where only interactions with a medium confidence score of >0.4 were included [15]. The output data of the constructed PPI network were analyzed and visualized using Cytoscape software ver. 3.9.0 [16]. The Cytoscape plugin MCODE analysis revealed nine clusters (Supplementary Data S2). Using a connectivity degree of >7, a significant module (the first cluster) consisting of 18 nodes and 78 edges was identified. The nodes represent proteins produced by a single protein-coding gene locus, and the edges represent meaningful connections between the nodes. As depicted in Fig. 1D, the PPI network constructed using the STRING database of the identified 18 hub genes demonstrated strong interactions among these hub genes, indicating that the proteins are at least partially biologically connected as a group.
GO and KEGG enrichment analyses of the identified hub genes associated with prostate cancer
GO and KEGG pathway enrichment analyses of the identified hub genes were conducted using the STRING database. Gene annotation analysis revealed that the identified hub genes were significantly enriched in specific biological processes (BPs), including post-translational protein modification, cellular macromolecule metabolic process, and regulation of cell death. In terms of molecular function (MF), these genes were enriched in RNA polymerase II proximal promoter sequence-specific DNA binding and DNA-binding transcription activator activity, and RNA polymerase II. KEGG enrichment analysis revealed that the identified hub genes were significantly enriched in fundamental cancer-related pathways, such as the phosphoinositide 3-kinase (PI3K)–Akt, cellular senescence, and interkeukin 17 (IL-17) signaling pathways. The five most significant enrichment terms, as determined by the GO annotation (BP, MF, and cellular component) and KEGG pathway enrichment analyses, are presented in Table 1. The complete list of GO annotation categories and KEGG pathways is provided in Supplementary Data S3.

GO functional analysis and KEGG pathway enrichment analysis of hub genes in prostate cancer
Clinicopathological data of the included prostatic adenocarcinoma patients
The mean age of the prostatic adenocarcinoma cohort in this study was 68.3 ± 8.2 years. Prostatic adenocarcinomas were graded using the Gleason scoring system, with an average Gleason score of 7 (7 to 8). The prognostic grade groups were G1 (n = 10, 14.29%), G2 (n = 23, 32.86%), G3 (n = 8, 11.43%), G4 (n = 12, 17.1%), and G5 (n = 17, 24.3%). The risk of prostatic adenocarcinoma was stratified according to the D’Amico classification system into low risk (n = 10, 14.3%), intermediate risk (n = 31, 44.3%), and high risk (n = 29, 41.4%). Additionally, perineural invasion (PNI) was reported in 18 (25.7%), lymphovascular invasion (LVI) in seven (10%), and prostatic intraepithelial neoplasia (PIN) in 10 patients (14.3%). Transrectal ultrasound (TRUS) biopsy (n = 59, 73.75%) was the most common sampling technique for the included tissues. Table 2 summarizes the comprehensive clinicopathological characteristics of patients with prostatic cancer included in the current study.

Clinicopathological features of prostatic adenocarcinoma patients included in the current study
JUNB expression was significantly higher in patients with prostatic adenocarcinoma than in those with BPH
Based on bioinformatics analyses and an extensive literature search, we assessed the expression of the JUNB proto-oncogene, a component of the AP-1 transcription factor subunit, which is one of the downregulated hub genes, using IHC staining. Once all immunostaining conditions were established satisfactorily, immunohistochemistry was performed on benign and neoplastic prostatic tumor samples. The expression of JUNB at the protein level in 70 human prostatic adenocarcinoma tissues was compared with that in 10 BPH samples. Among the BPH samples, JUNB IHC staining was restricted to the cytoplasm of the glandular components. Notably, 100% of the benign samples showed negative nuclear expression of JUNB, as all specimens of BPH showed weak expression of JUNB in less than 10% of the nuclei of prostatic hyperplastic cells (Fig. 2A–C). Regarding the staining intensity, the nuclei of BPH specimens showed no moderate or strong intensity compared with those of prostatic adenocarcinoma specimens (p = .041), indicating a statistically significant difference. In contrast, JUNB expression in prostatic adenocarcinoma specimens of low (Fig. 2D–F) and high (Fig. 3A–C) grades was mainly nuclear in prostatic tumor cells and a few adjacent stromal cells. Lower JUNB expression was detected in the nuclei of high-grade prostatic carcinomas than in low-grade tumors. The obtained results demonstrated a significantly higher JUNB expression (p = .018) in prostatic adenocarcinoma patients, with a median score of 4 (IQR, 2.0 to 5.0), than among BPH patients, with a median score of 2.5 (IQR, 0.5 to 3.0) (Fig. 3D).
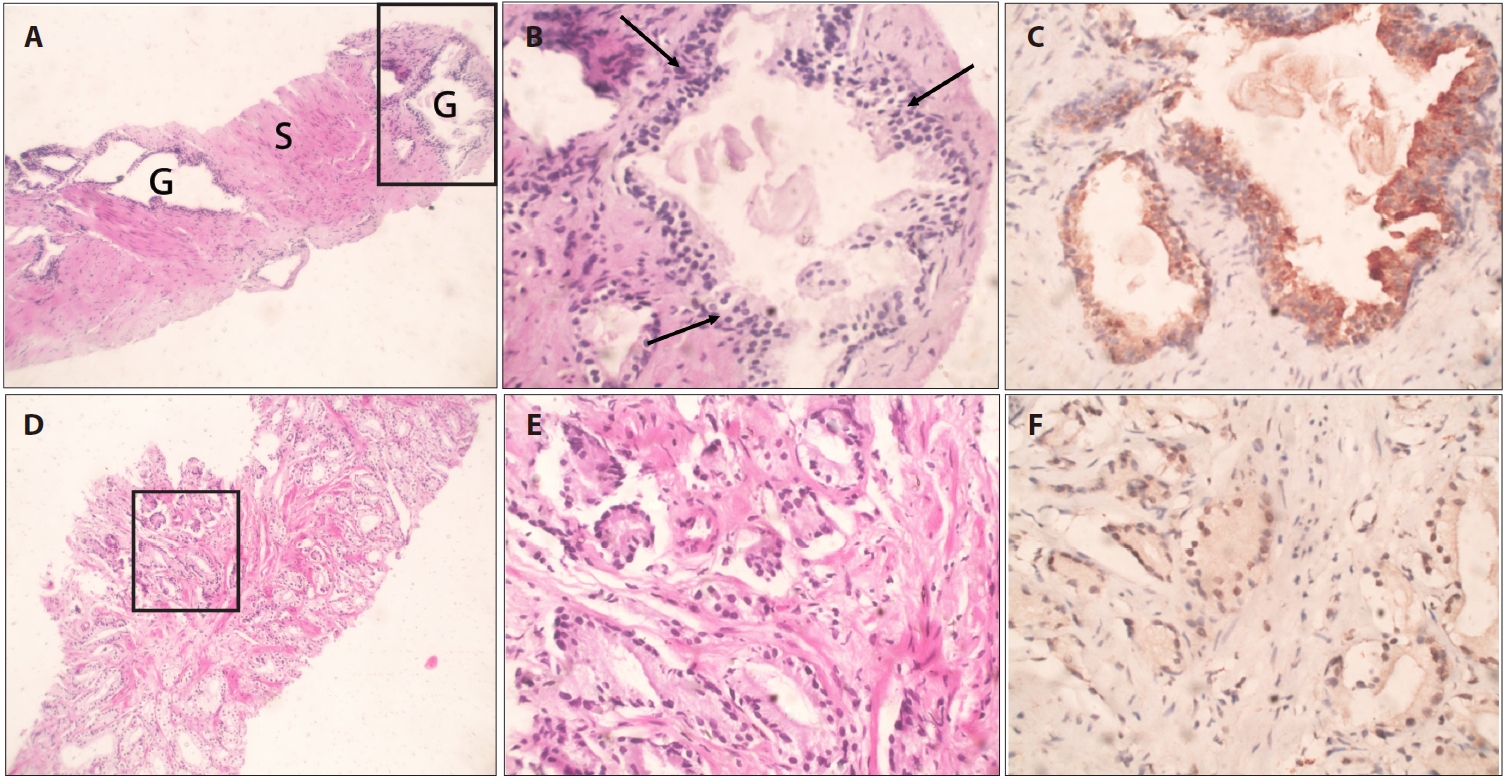
JUNB expression in benign prostatic hyperplasia (BPH) and low-grade prostatic carcinoma. (A) Core biopsy of BPH showing multiple hyperplastic glands (G) with abundant stromal (S) components. (B) Higher magnification of the marked glandular tissue in (A) demonstrates multilayered hyperplastic glandular tissue (arrows) with papillary infoldings. (C) Hyperplastic cells show cytoplasmic JUNB expression with no nuclear staining. (D) Core biopsy of prostatic adenocarcinoma demonstrating crowded small glands. (E) Higher magnification of the marked glandular tissue in (A) shows several single, separate, well-formed small glands (Gleason = 3 + 3 = 6). (F) JUNB moderate nuclear staining was detected in the majority of the nuclei of the malignant glandular tissue.
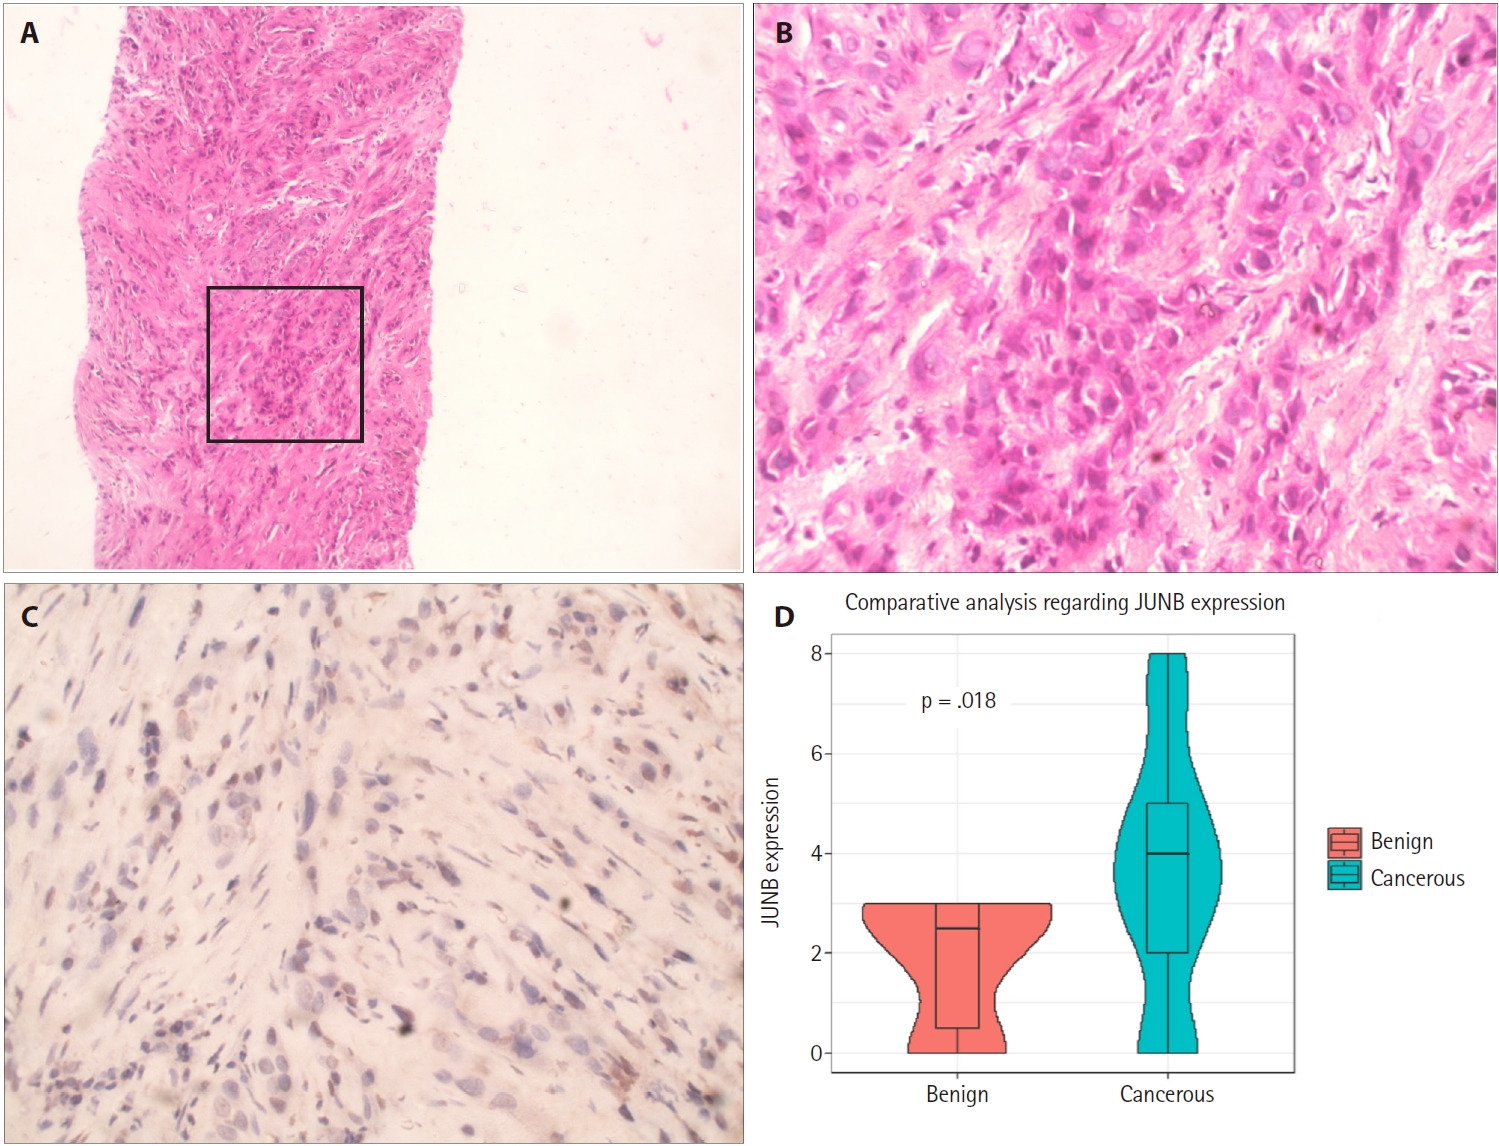
JUNB expression in high-grade prostatic carcinoma. (A) Core biopsy of prostatic adenocarcinoma reveals infiltrating neoplastic cells. (B) Higher magnification of the marked glandular tissue in (A) demonstrates sheets of malignant cells invading the stroma with a lack of glandular formation (Gleason 5 + 5 = 10). (C) Weak JUNB expression in a few nuclei of the high-grade prostatic carcinoma. (D) Box plot showing that high Allred scores of JUNB expression are significantly associated with cancerous prostatic tumors compared to those for benign prostatic hyperplasia (Wilcoxon rank-sum test, p = .018).
Lower levels of JUNB expression are associated with higher-grade prostatic adenocarcinoma
This study investigated JUNB expression in prostatic adenocarcinomas of various Gleason grades. IHC analysis revealed a statistically significant relationship between the Gleason scores of prostatic adenocarcinomas and JUNB expression. Prostatic adenocarcinoma patients with positive JUNB expression had lower Gleason scores than JUNB-negative patients (p < .001) (Fig. 4A). As demonstrated in Table 3, more than 58% of patients with positive JUNB expression were in grades 1 and 2, which showed a statistically significant difference from negative JUNB patients, more than 76% of whom were in grades 3 to 5 (p = .003). Hence, these results suggest a potential tumor suppressor action of JUNB in prostate cancer.
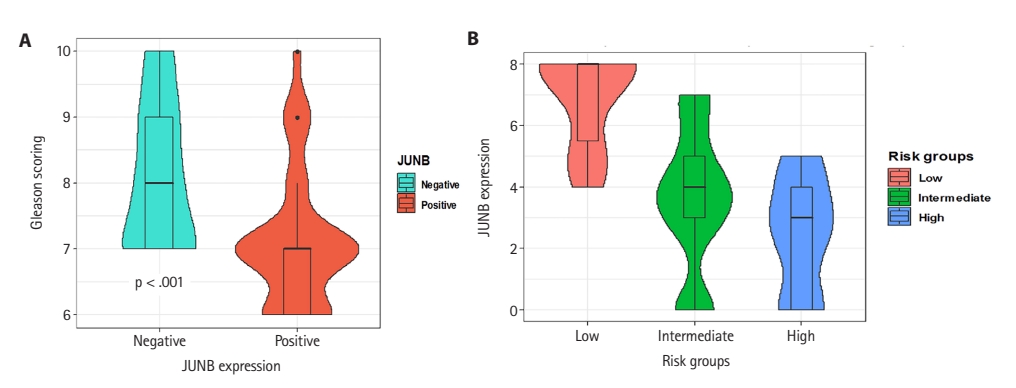
(A) Relationship between JUNB expression and Gleason score in prostatic adenocarcinoma. Patients with positive JUNB expression showed lower Gleason scores than JUNB-negative patients (p < .001). (B) JUNB expression in different risk groups of prostatic adenocarcinomas showed that the risk of disease progression was significantly increased by lowering the JUNB expression score.

Association between JUNB expression and prostatic adenocarcinoma outcomes (Gleason scoring, prognostic grade, risk groups, TNM, and types of invasions)
Decreased JUNB expression is associated with a higher risk of prostatic adenocarcinoma progression and metastasis
Subsequently, patients were stratified into different risk groups based on the risk of expected disease progression. Patient stratification was based on the preoperative PSA level, clinical T category, and Gleason grade. Patients were grouped into low-, intermediate-, and high-risk categories [20]. Our results showed that the risk of disease progression was significantly increased by lowering the JUNB expression score (Fig. 4B). Interestingly, 100% of the patients in the low-risk group exhibited positive JUNB expression, indicating a significant association between positive JUNB expression and a lower risk of disease progression (p < .001) (Table 3).
Concerning the pathological tumor categories, we observed that patients with negative JUNB expression were allocated to the T2b (11.8%), T2c (70.6%), and T3b (17.6%) categories. This observation exhibited a statistically significant difference compared to patients with positive JUNB expression (p = .001). Notably, 44% of the patients with positive JUNB expression were at the T2b category or lower. Regarding disease metastasis, more than 88% of patients with positive JUNB expression did not show any tumor metastasis to regional lymph nodes (p < .001) or distant sites (p < .001), indicating a statistically significant difference compared to patients with negative JUNB expression. There was no statistically significant difference between patients with positive and negative JUNB expression regarding LVI (p > .99), PNI (p > .99), and PIN (p = .736) in malignant cases. Hence, these results indicate that decreased JUNB expression is associated with a statistically significant increase in the risk of prostate cancer progression and incidence of metastasis (Table 3).
Lower levels of JUNB expression are associated with a shorter OS
The association between JUNB expression and OS is shown in Fig. 5A, C and E. For patients with prostatic adenocarcinoma with positive JUNB expression, the median OS time was 36 months, significantly longer than 21 months for patients with negative JUNB expression (p-value for log-rank test = .04, log-rank = 4.4). OS rates after 10, 20, 30, 40, and 50 months are shown in Fig. 5A. Furthermore, the smooth HR curve for OS showed that the hazard of death decreased significantly with higher JUNB expression (Fig. 5C). Cox proportion hazard regression model showed that prostatic adenocarcinoma patients with positive JUNB expression had a statistically significant decrease in the hazard of death by about 52% compared to the patients with negative JUNB (HR, 0.48; 95% CI, 0.24 to 0.96; p = .039) (Fig. 5E).
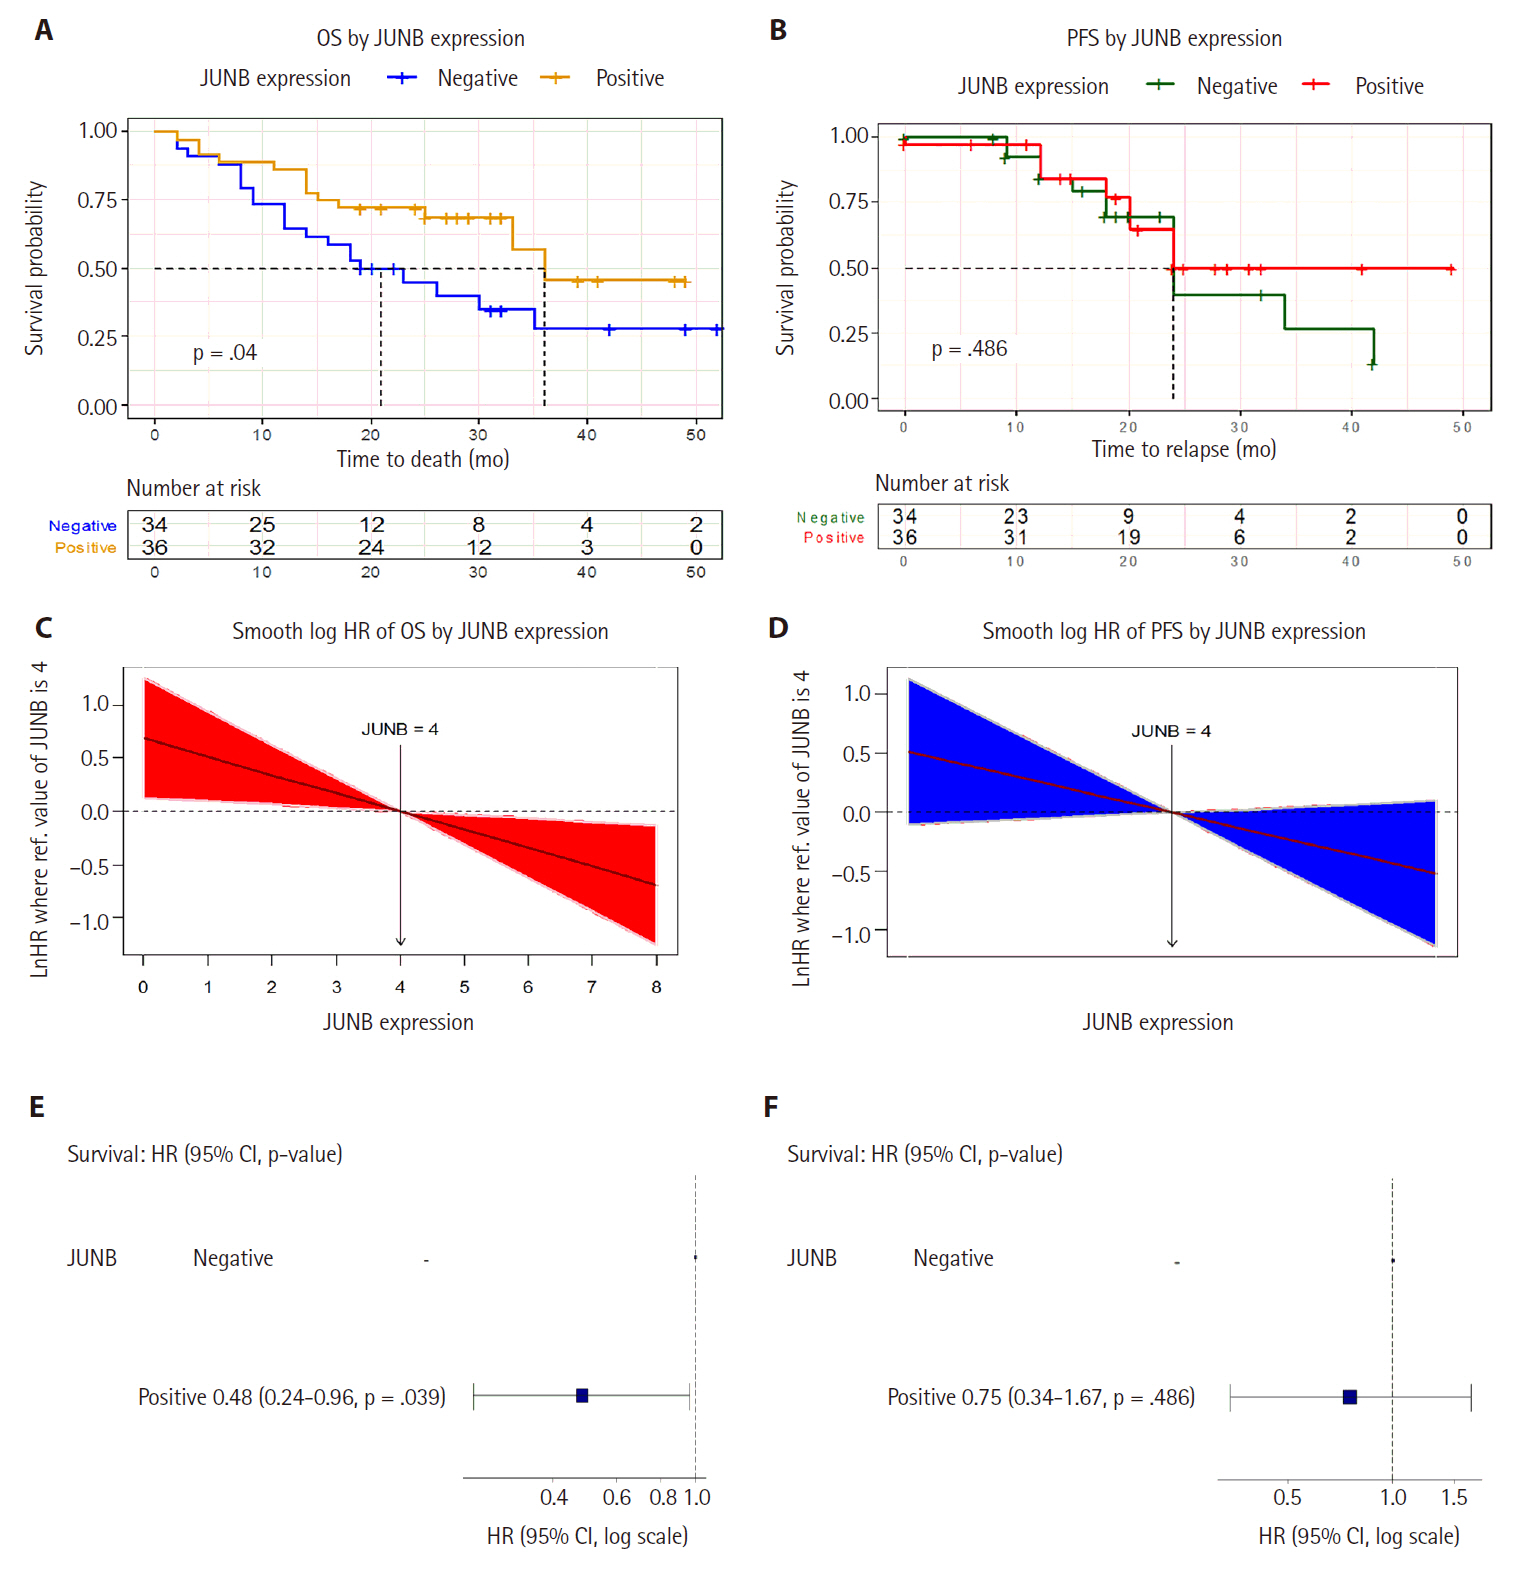
The potential prognostic value of JUNB in prostate cancer. (A) Kaplan-Meier plot shows that the median overall survival (OS) time was significantly longer in patients with positive JUNB expression than in those with negative JUNB expression. (B) Kaplan-Meier curve showing the median progression-free survival (PFS) time among prostatic adenocarcinoma patients of 24 months irrespective of positive or negative JUNB expression. This indicates no significant difference in PFS based on JUNB expression status. (C) The smooth hazard ratio (HR) curve for OS showed that the hazard of death decreased significantly with higher JUNB expression. (D) The smooth HR curve for PFS shows a non-significant decrease in the hazard of relapse in higher JUNB expression. (E) Cox proportion hazard regression model showed a statistically significant 52% decrease in the hazard of death in patients with positive JUNB expression. (F) Cox proportion hazard regression model demonstrates a non-significant decline in the hazard of progression among prostatic adenocarcinoma patients with positive JUNB expression compared to patients with negative expression. CI, confidence interval.
The association between JUNB expression and PFS was also assessed. As demonstrated by the Kaplan-Meier curve (Fig. 5B), the median PFS time for patients with prostatic adenocarcinoma was 24 months in both patients with positive and negative JUNB expression, indicating no significant difference (p-value for log-rank test = .486, log-rank test = 0.5). Analysis of the smooth HR curve for PFS showed an insignificant decrease in the hazard of relapse in patients with high JUNB expression (Fig. 5D). Furthermore, Cox proportion hazard regression model showed that the hazard of progression decreased but non-significantly among prostatic adenocarcinoma patients with positive JUNB expression by about 25% compared with that among patients with negative JUNB expression (HR, 0.75; 95% CI, 0.34 to 1.67; p = .486) (Fig. 5F). It is reasonable to assume that the sample size constraint was the primary reason the PFS results did not reach a meaningful value. Taken together, these results suggest that JUNB has potential prognostic value in prostate cancer.
DISCUSSION
In the present study, 18 hub genes were identified as exhibiting strong interactions with each other and were significantly enriched in key BPs and MFs in prostate cancer. KEGG pathway enrichment analysis revealed that the identified hub genes were involved in fundamental cancer-related pathways, including cellular senescence and PI3K-Akt signaling pathways. Among the identified hub genes, we further explored the clinical significance of JUNB, which is involved in the progression of various cancers such as Hodgkin’s disease and anaplastic large cell lymphomas [10]. This study represents the first comprehensive assessment of the correlation between JUNB expression in human prostate cancer and Gleason grade, clinical stage, and disease progression. Although several studies have examined different members of the AP-1 family, only one study has examined the IHC evaluation of JUNB in human tissues [23].
The JUNB proto-oncogene belongs to the AP-1 family, which includes JunB, JunD, c-Fos, FosB, Fra-1, and Fra-2. It plays a crucial role in the transcriptional regulation of several genes involved in cellular processes, including cellular proliferation, differentiation, and disease progression [7]. In this study, IHC analysis revealed that JUNB showed significant overexpression in human prostatic adenocarcinoma compared with that in BPH. This finding is consistent with those of Endo et al. [24], who reported that JUNB is downregulated in BPH using microarray analysis of human tissues. However, the current study showed a notable discrepancy between the JUNB expression levels obtained from the GEO database and those determined by IHC analysis. The observed discrepancy between JUNB mRNA and protein levels may result from post-transcriptional and post-translational regulatory mechanisms that affect mRNA stability, translation efficiency, or protein degradation. Additionally, the use of different methods to assess JUNB expression may have contributed to this discrepancy; the GEO database analysis reflects mRNA expression levels, whereas IHC measures protein expression. The heterogeneity of the analyzed prostatic tissue, with varying proportions of tumor cells, stromal cells, and inflammatory infiltrates, can significantly affect the results. Additionally, variations in the number and demographic characteristics of the samples included in the GEO dataset and those assessed by IHC may have contributed to the observed variability. Such discrepancies are not uncommon in cancer studies and underscore the importance of validating transcriptomic findings at the protein level to gain a deeper understanding of gene function and its clinical relevance. Further studies are required to elucidate the molecular mechanisms underlying the involvement of JUNB in prostate diseases.
JUNB functions predominantly as a nuclear transcription factor that regulates gene expression [25]. However, IHC analysis in this study revealed that JUNB staining was mainly cytoplasmic in the glandular components of the BPH samples. In contrast, JUNB expression in prostatic adenocarcinoma specimens was primarily nuclear in prostatic tumor cells. The presence of JUNB in non-nuclear compartments of cells potentially indicates additional regulatory roles, as indicated by the findings of the bioinformatics analysis conducted in this study. The cytoplasmic localization of JUNB has been previously reported in epidermal neoplasia and during the differentiation of human keratinocytes [26,27]. Furthermore, it has been suggested that JUNB may display dynamic localization, shuttling between the nucleus and cytoplasm in response to specific factors such as post-translational modifications [28]. These findings highlight the role of JUNB in various cellular functions, which depend on its location within the cell and the surrounding environment.
The current study demonstrated that the overexpression of JUNB was associated with low-grade prostatic tumors, while reduced JUNB expression was observed in higher-grade prostatic adenocarcinomas. Moreover, a higher risk of prostatic adenocarcinoma progression and metastasis was associated with decreased JUNB expression. These results are aligned with the previous findings showing that elevated JUNB expression is associated with low-grade prostate cancer compared to that in the normal human prostate [23,29]. Additionally, another study analyzes publicly available data and demonstrates that the downregulation of JUNB expression is associated with higher-grade and metastatic prostatic tumors [7]. Interestingly, it was recently reported that JUNB exhibits a high expression level in malignant mammary cells, which is negatively correlated with tumor stage and lymph node metastasis [30,31]. These results are in accordance with previously reported results, suggesting a potential tumor-suppressive role of JUNB in prostatic adenocarcinoma, which supports two previous studies conducted in myeloid and lymphoid in vivo mouse models [32,33].
The tumor-suppressive role of JUNB-associated can be explained by its involvement in regulating various fundamental cellular processes. First, a reduction in JunB levels was reported to enable cells to proliferate by reversing cell cycle arrest in wild-type murine fibroblasts and human prostate cancer cell lines [23,34] However, this contradicts the findings of other studies that demonstrated that JUNB positively regulates cell proliferation and survival by promoting the transition from the S to G2/M phase by activating cyclin A [35,36]. The discrepancy in the effects of JUNB on cell proliferation and survival can be explained by using different cell lines representing various pathological conditions. Second, GO analysis revealed the essential roles of the identified hub genes, including JUNB, in regulating cell death. This finding is consistent with previous studies indicating that JUNB inhibits apoptosis in various mammalian cell lines in vitro [34,37]. Konishi et al. [23] demonstrated that JUNB inhibits prostate cancer cell invasion by targeting MMP2 induction in a chick chorioallantoic membrane in vivo model. However, another experimental study revealed that JUNB knockout in metastatic head and neck squamous cell carcinoma cells significantly inhibited tumor invasion and migration [38]. Finally, JUNB has a potential role in the induction and maintenance of cellular senescence, which might account for its tumor suppressor activity, as supported by our findings from bioinformatics analyses. JUNB drives mouse fibroblasts to undergo hydroxyurea-dependent senescence [39]. In addition, JUNB plays a crucial role in maintaining cellular senescence and acts as an upstream regulator of the cyclin-dependent kinase inhibitor P16 [40]. Further studies are needed to investigate the biological and MFs of JUNB in prostate carcinoma and to clarify any apparent contradictions.
JUNB expression was also detected in the stromal cells of prostatic adenocarcinoma. This is in accordance with the findings of Wutschka et al. [31], who reported the stromal expression of JUNB surrounding malignant mammary cells. JUNB may be positively expressed in stromal cells adjacent to prostatic carcinoma cells, which may play an essential role in suppressing invasion and metastasis. This is supported by the findings of Long et al. [41], who demonstrated that JUNB acts as a hub gene in modulating the immune response and contributes to the therapeutic effects of androgen deprivation therapy. Further studies are needed to investigate the role of JUNB in the tumor microenvironment of prostate carcinoma.
A critical finding of the current study was the association of low levels of JUNB expression with shorter OS compared to higher expression. Furthermore, the Cox proportional hazard regression model showed that patients with prostatic adenocarcinoma who exhibited positive JUNB expression had a statistically significant reduction in the hazard of death compared to those with negative JUNB expression. The present study’s findings align with those of Hyakusoku et al. [38] who reported prolonged survival in a mouse model of lung metastasis after JUNB knockout. The poor OS of patients with decreased JUNB expression can be attributed to its suggested tumor suppressor role. Notably, while the univariate Cox regression analysis identified JUNB expression as an independent prognostic factor for OS, multivariate analysis including Gleason grade and clinical stage was not performed due to sample size limitations. Future studies involving larger cohorts are required to determine the relative prognostic value of JUNB expression compared to established clinical parameters.
It is important to note that the role of JUNB in cancer is context-dependent. While our findings support a potential tumor-suppressive role of JUNB in prostate carcinoma, this contrasts with evidence from other malignancies. For example, JUNB is overexpressed in Hodgkin’s lymphoma and has been involved in promoting tumor cell survival and proliferation [10]. Similarly, in head and neck squamous cell carcinoma, JUNB has been associated with poor prognosis and aggressive tumor behavior [42,43]. These distinctions highlight the complex, tissue-specific functions of JUNB and suggest that its biological effects may be influenced by the tumor microenvironment, cell type, and interacting signaling pathways. Therefore, the clinical implications of JUNB expression should be interpreted in a cancer-type-specific manner.
Although the current study comprehensively assessed the clinical significance of JUNB in prostatic carcinoma, the small sample size is an intrinsic limitation. Further large-scale clinical studies are recommended to validate our findings and to explore the prognostic and predictive significance of JUNB in prostate cancer. Moreover, since the majority of samples in this study were derived from core or TRUS biopsies rather than prostatectomy specimens, the evaluation of associations between JUNB expression and histopathological features such as PNI, LVI, and PIN may be limited by underrepresentation or sampling variability. One additional limitation of this study is the use of BPH tissue as a control group, which may not fully reflect the biological variability of histologically normal prostate tissue. However, the use of truly normal prostate samples is often limited by ethical and practical constraints. In addition, while this study suggests a tumor-suppressive role for JUNB based on its expression pattern and correlation with favorable clinical outcomes, this conclusion remains correlative and does not establish a causal relationship. Therefore, future functional studies, such as JUNB knockdown or overexpression experiments in prostate cancer cell lines and animal models, are crucial for elucidating the mechanistic role of JUNB in tumorigenesis and progression.
Taken together, the current findings indicate that JUNB could act as a potential novel clinical prognostic biomarker for prostate cancer, which could help in better risk stratification. We believe JUNB can be considered a valuable gene for inclusion in multi-gene panel tests for prostate cancer. In addition to its role as a biomarker, JUNB may also serve as a potential therapeutic target. The consistent association of JUNB expression with improved survival outcomes in our cohort suggests its relevance in distinguishing indolent from aggressive disease. Future research could explore therapeutic strategies aimed at enhancing JUNB activity or modulating its upstream regulators. However, these applications require additional validation through prospective clinical studies and mechanistic investigations.
Supplementary Information
The Data Supplement is available with this article at https://doi.org/10.4132/jptm.2025.06.06.
Notes
Ethics Statement
This study was conducted in compliance with the Declaration of Helsinki (1964) after obtaining the approval of the Research Ethics Committee of Cairo University (BC 3240). Informed consent was obtained from all individual participants included in the study. All patient information remains anonymous.
Availability of Data and Material
The data supporting our findings are available from the corresponding author upon reasonable request.
Code Availability
Not applicable.
Author Contributions
Conceptualization: NRN, EMY, MT. Data curation: NRN, EMY. Formal analysis: NRN, EMY. Funding acquisition: NRN, EMY. Investigation: NRN, EMY. Methodology: NRN, EMY. Project administration: NRN, EMY. Resources: NRN, EMY, MT. Software: NRN, EMY. Supervision: NRN, EMY, MT. Validation: MT. Visualization: NRN, EMY. Writing—original draft: NRN, EMY. Writing—review & editing: NRN, EMY, MT. Approval of final manuscript: all authors.
Conflicts of Interest
The authors declare that they have no potential conflicts of interest.
Funding Statement
This study was funded by the General Directorate of Scientific Research & Innovation, Dar Al Uloom University, through the Research Projects Funding Program.