A single-institution demographic study of pathologically proven kidney disease in South Korea over the last 33 years
Article information

Abstract
Background
To date, epidemiological studies on the entire spectrum of kidney disease based on pathology have been rarely reported.
Methods
A retrospective study was conducted on patients diagnosed with kidney disease at Seoul St. Mary's Hospital between 1991 and 2023.
Results
Among 7,803 patients with native kidney disease, glomerular disease (70.3%) was the most common, followed by tubulointerstitial (15.1%) and vascular disease (8.8%). In kidney biopsy, glomerular disease (77.8%) showed the highest frequency, particularly in those under 20s (95.6%) (p = .013). Primary glomerulonephritis (GN) (72.8%) was the predominant glomerular disease, with IgA nephropathy (IgAN) (47.3%) being the most common one. Tubulointerstitial and vascular diseases increased with age, showing the highest prevalence in those over 60 years (p = .008 and p = .032, respectively). Glomerular disease was diagnosed at a younger age (39.7 ± 16.7 years) than tubulointerstitial (49.1 ± 16.2) and vascular (48.1 ± 15.3) diseases (p < .001). When glomerular diseases were classified morphologically, proliferative GN (57.9%) was the most common, followed by non-proliferative (39.6%) and sclerosing (1.6%). When classified by etiology, primary GN accounted for the most (72.8%), followed by secondary (19.3%) and hereditary GN (5.7%). In nephrectomy, tubulointerstitial disease (64.6%) was the most common. Those with a tubulointerstitial disease had a higher mean age than those with a glomerular disease (p < .001). In cases where nephrectomy was performed for glomerular diseases, IgAN (34.1%) was the most common diagnosis.
Conclusions
Kidney disease has been increasing in South Korea for 33 years. Glomerular disease was the most common across all age groups, tubulointerstitial and vascular diseases increased over 60 years.

INTRODUCTION
As of 2023, 850 million people worldwide have kidney disease. The prevalence of chronic kidney disease has been estimated to exceed 10% [1] due to increase in hypertension [2], diabetes [3-5], aging population [5-9], and the glomerulonephritis (GN) [6,7,10-13] since the 1990s. In 2022, the number of chronic kidney disease patients in South Korea increased 2.16 times over 10 years [14] with the prevalence rate in Korean adults being 8.4% [1]. In addition, the prevalence rate increased with age, reaching 26.5% (as of 2021) in those aged 70 years or more [15]. Epidemiologic characteristics of kidney disease have been reported in several studies according to age, sex, race, regional frequency, and temporal changes [3,6,7,16,17]. However, most of these studies focused on glomerular diseases based on biopsy specimens [3,6-13,17-24], while studies including all kidney diseases, including biopsy and surgical resection, were limited [25]. In this study, we retrospectively analyzed all kidney diseases diagnosed by histopathologic examination over the past 33 years based on patient data from Seoul St. Mary's Hospital, one of the leading medical centers in South Korea.
MATERIALS AND METHODS
Patient population
We conducted a retrospective study of renal pathology examinations performed at Seoul St. Mary’s Hospital from January 1991 to December 2023. We reviewed patients’ pathological and clinical records comprehensively. Those with incomplete medical records, inadequate tissue specimens, frozen biopsy specimens, and incidental nephrectomy samples showing normal findings obtained during surgeries for other organs were excluded from analysis. This study was only designed for renal inflammatory diseases in native kidney except for tumor. Data collected for this study included the following parameters: kidney specimen type (biopsy or surgical), date of procedure, patient age, sex, transplantation status, and histopathologic diagnosis.
We included both biopsy and surgical specimens to ensure that the entire kidney disease was analyzed. These specimens were analyzed separately. Each case was diagnosed according to the pathological diagnostic entity of the disease. It was then classified according to the disease type, demographic data, and changes over time. In addition, morphologic and etiologic classifications were performed to further analyze the pathologic category of kidney disease. There were 126 patients without age or sex data. They were not eliminated from diagnosis analysis, although they were excluded when analyzing age and temporal correlations.
Data source
Kidney diseases were classified into the following four disease types based on pathologic diagnoses: glomerular disease, tubulointerstitial disease, vascular disease, and others (diagnoses that did not clearly fit into the previous three disease types). Glomerular disease was classified according pathological diagnostic entity, morphologic category, and etiologic category. According to morphologic category, glomerular disease was classified into proliferative, non-proliferative, sclerosing, mixed (diseases with two or more of the above), and others (diseases not fitting into the above). According to etiological category, glomerular disease was classified into primary, secondary, hereditary, mixed (diseases with both primary and secondary features), and unknown (diseases not fitting into the above). Tubulointerstitial diseases and vascular diseases were classified according to pathological diagnostic entity. All cases were analyzed for three consecutive decades (1991–2000, 2001–2010, and 2011–2020). To investigate correlations between patient age and kidney disease types, participants were stratified into four age groups (under 20 years, 20–39 years, 40–59 years, and over 60 years).
Statistical analyses
Statistical analysis was performed using R v.4.4.2 (R Foundation for Statistical Computing, Vienna, Austria). Continuous variables are presented as mean ± standard deviation. They were compared using ANOVA or Kruskal-Wallis test. Categorical variables are shown as frequency (%). They were compared using the chi-squared test. Two-sided p-values of .05 were considered statistically significant. For determining the trend of disease prevalence over the time period, we used linear regression analysis.
RESULTS
Kidney disease in native kidney
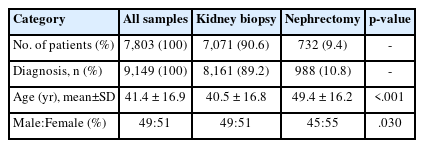
A total of 7,803 patients with kidney disease in a native kidney (7,071 biopsies and 732 nephrectomies) were enrolled. The sex ratio was 49:51 (Fig. 1A) and the mean age was 41.4 ± 16.9 years. A total of 9,149 cases of kidney diseases were diagnosed in all patients. The distribution of kidney diseases was confirmed by biopsy and nephrectomy. Among them, glomerular diseases were diagnosed in 6,434 cases (70.3%), showing the highest frequency, followed by tubulointerstitial diseases (n = 1,383, 15.1%) and vascular diseases (n = 805, 8.8%) (Fig. 1B). In particular, tubulointerstitial disease (n = 474, 64.6%) was found more frequently in nephrectomy patients than other disease types. When comparing the mean age and sex ratio of patients who underwent biopsy or nephrectomy in Table 1, significant differences in both age (40.5 vs. 49.4 years, p < .001) and sex ratio (M:F = 49:51 vs. 45:55, p = .030) were observed between the two groups.

(A) Sex ratio of 7,677 patients with native kidney disease including biopsy and nephrectomy. (B) Diagnostic categories of kidney disease in biopsy and nephrectomy cases.
Demographic data of 7,803 patients with renal disease in native kidney
Kidney disease in native kidney biopsy
The sex ratio of patients who underwent renal biopsy was 49:51 and the mean age was 40.5 ± 16.8 years (Table 1). Kidney diseases diagnosed through biopsy began to increase in teens (n = 794, 11.4%), peaked in the age group of 30s (n = 1,356, 19.5%), and then gradually decreased (Fig. 2A). The number of patients diagnosed with glomerular disease by biopsy began to increase in their 10s (n = 760, 12.6%), peaked in their 20s (n = 1,165, 19.3%), plateaued in their 30s (1,157 patients, 19.2%) and 40s (n = 1,150, 19.1%), and then decreased in 50s (n = 939, 15.6%), 60s (n = 548, 9.1%), 70s (n = 229, 3.8%), and over 80s (n = 53, 0.9%). Tubulointerstitial disease steadily increased in their teenage years (n = 13, 3.2%), 20s (n = 39, 9.5%), 30s (n = 69, 16.7%), 40s (n = 83, 20.1%), peaked in the 50s (n = 90, 21.8%), and decreased in the 60s (n = 71, 17.2%), 70s (n = 71, 8.5%), and over 80s (n = 11, 2.7%).

(A) Age and sex distribution of 6,944 patients who underwent biopsy for native kidney disease. (B) Age and sex distribution of 732 patients who underwent nephrectomy for native kidney disease.
Vascular disease had more patients in their 30s (n = 52, 25.9%) and 50s (n = 49, 24.4%). It had fewer patients in their teens (n = 2, 1.0%), 20s (n = 20, 10.0%), 40s (n = 28, 13.9%), 60s (n = 30, 14.9%), 70s (n = 18, 9.0%), and over 80s (n = 2, 1.0%), creating a double-peak graph.
Trends of kidney disease in native kidney biopsy
Decadal changes of biopsies performed for kidney disease
The number of native kidney biopsies was 1,895 in the 1990s, decreased slightly to 1,508 in the 2000s, but increased to 2,919 in the 2010s (p = .520).
Decadal changes of biopsies classified by kidney disease types
Among kidney diseases, the frequency of glomerular disease gradually increased compared to the past. However, the increase was not statistically significant (1,594 cases, 84.1% in 1990s vs. 1,326 cases, 87.9% in 2000s vs. 2,597 cases, 89.0% in 2010s, p = .200) (Fig. 3). The frequency of tubulointerstitial disease also increased compared to the past, although the increase was not statistically significant (83 cases, 4.4% in 1990s vs. 73 cases, 4.8% in 2000s vs. 189 cases, 6.5% in 2010s, p = .190). The frequency of vascular disease also showed an increase according to time, although the increase did not reach statistical significance (26 cases, 1.4% in the 1990s vs. 49 cases, 3.2% in 2000s vs. 92 cases, 3.2% in 2010s, p = .360). The proportion of others decreased from the 1990s to the 2010s.
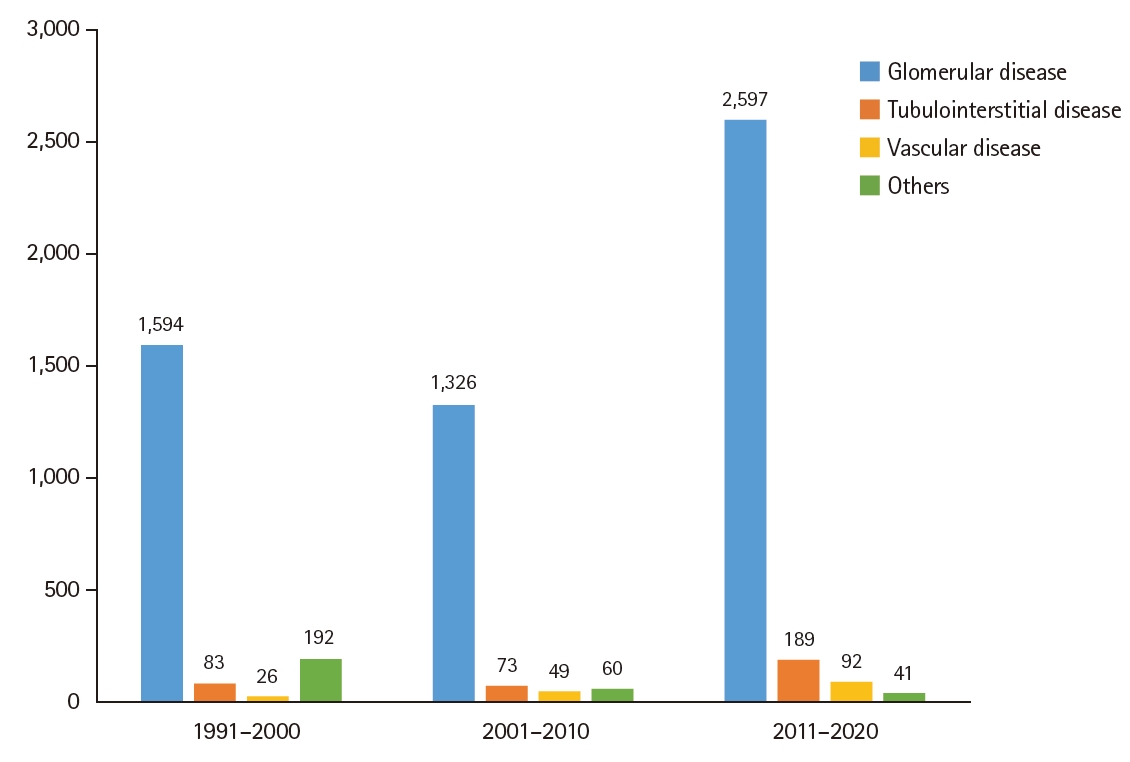
Trends over three decades in the distribution of renal disease types in 6,322 native kidney biopsies. They were analyzed for three consecutive decades (1991–2000, 2001–2010, and 2011–2020).
Differences in kidney disease types by age groups
The distribution of kidney disease in biopsy tissues was classified by age groups (Fig. 4). Glomerular disease accounted for more than 80% in all age groups, showing the highest frequency of 95.6% in those under 20s (p = .013). Tubulointerstitial disease increased in frequency with increasing age, showing a higher frequency diagnosed in those over 60 years (11.3%) than in other age groups (p = .008). Vascular disease also increased with age, with the highest prevalence observed in those aged over 60 years (4.8%) (p = .032). When categories of glomerular disease were analyzed according to age (Fig. 5A), the morphologic category showed that proliferative GN was mainly found in younger patients (mean age, 37.0 ± 15.4 years), while sclerosing GN (48.8 ± 17.1 years) and mixed GN (54.5 ± 14.2 years) were mainly found in older patients (p < .001). When categorized according to etiology categories (Fig. 5B), the mean age of each category was: primary, 39.6 ± 16.5 years; secondary, 39.8 ± 17.6 years; hereditary, 38.2 ± 15.5 years; and mixed GN, 51.5 ± 14.9 years. Mixed GN was diagnosed notably more in older age groups than in other age groups (p < .001).

Proportional analysis of renal disease types among four age groups in native kidney biopsies. Patients were stratified into four groups: under 20 years, 20–39 years, 40–59 years, and over 60 years.
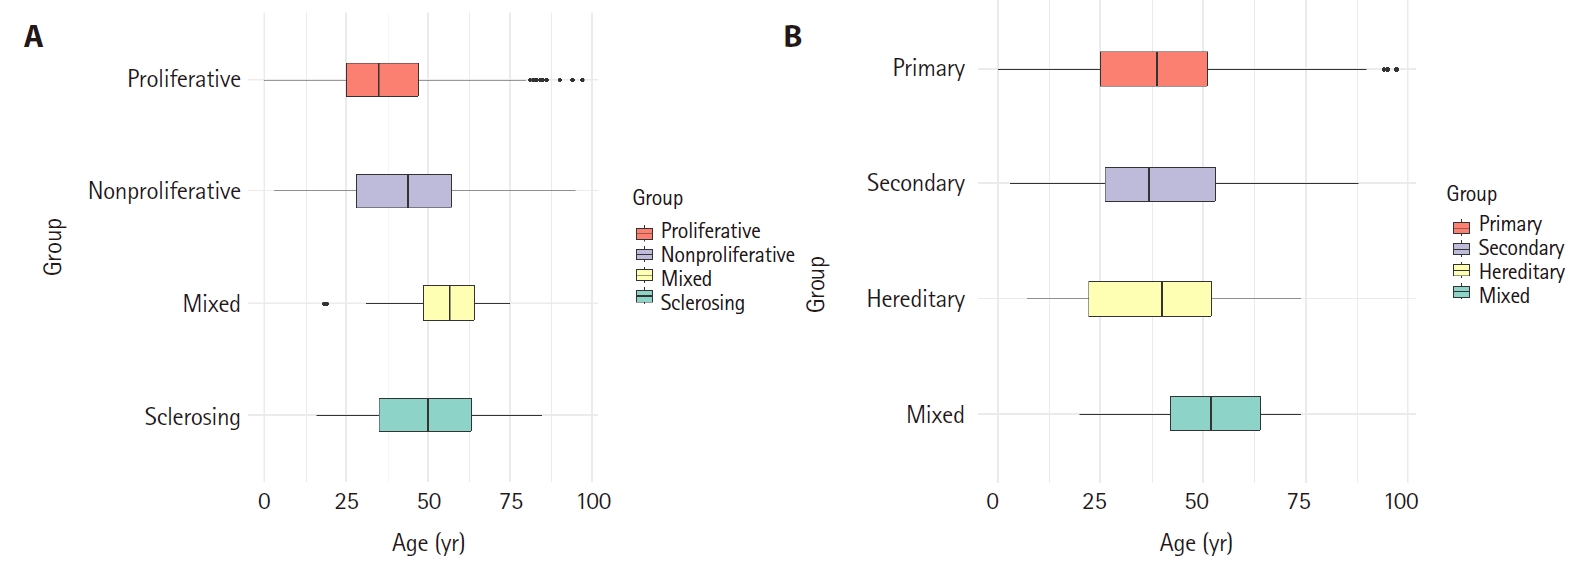
Box plot analysis of age distribution according to glomerular disease categories in native kidney biopsy. (A) Morphologic categories of glomerular disease. The mean age and standard deviation of each group was as follows: proliferative (37.0 ± 15.4 years), non-proliferative (43.1 ± 17.7 years), mixed (54.5 ± 14.2 years), and sclerosing (48.8 ± 17.1 years). (B) Etiologic categories of glomerular disease. The mean age and standard deviation of each group was as follows: primary (39.6 ± 16.5 years), secondary (39.8 ± 17.6 years), hereditary (38.2 ± 15.5 years), and mixed (51.5 ± 14.9 years).
Demographics of glomerular disease in native kidney biopsy
Mean age and sex ratio of all 7,071 native kidney biopsy patients are shown in Table 2. Glomerular disease (39.7 ± 16.7 years) was also diagnosed at a significantly lower mean age than tubulointerstitial disease (49.1 ± 16.2 years) and vascular disease (48.1 ± 15.3 years) (p < .001). In addition, when observing the frequency of occurrence by sex for each disease type, only glomerular disease was observed to have a higher frequency in females (M:F = 48:52), indicating a significant difference between disease types (p = .002). When kidney diseases were categorized according to disease types, glomerular disease accounted for 77.8% (n = 6,346), followed by vascular disease (n = 773, 9.5%), tubulointerstitial disease (n = 733, 9.0%), and others (n = 309, 3.8%).
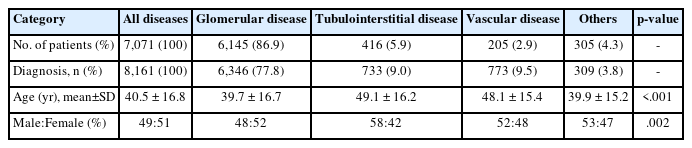
Demographic data of 7,071 patients with renal disease in native kidney biopsy
Pathologic diagnostic entities of glomerular disease in kidney biopsy
Glomerular disease was classified according to pathologic diagnostic entity, with 6,346 cases being diagnosed in 6,145 patients (Table 3). Of these, IgA-related GN (n = 2,309, 36.4%) showed the highest frequency, followed by podocytopathy (n = 986, 15.5%), systemic lupus erythematosus and autoimmune disease (n = 615, 9.7%), and membranous GN (MGN) (n = 567, 8.9%). More detailed information on each glomerular diagnostic entity can be found in Supplementary Table S1.
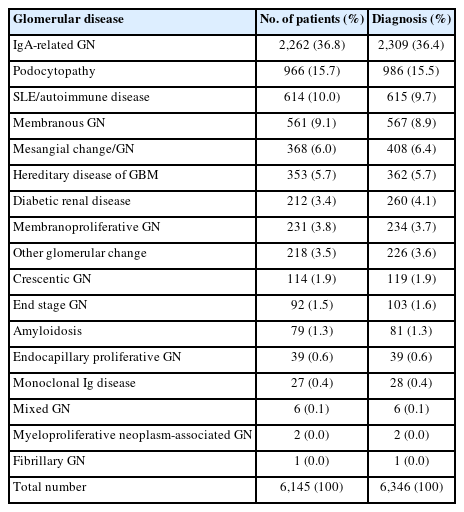
Classification of 6,346 cases according to diagnostic categories of glomerular disease
Classification of glomerular diseases by morphologic category
When all 6,346 cases of glomerular disease were classified according to morphologic category, proliferative GN (n = 3,677, 57.9%) was more common than non-proliferative GN (n = 2,516, 39.6%). Sclerosing GN had 103 cases (1.6%). Mixed GN had 48 cases (0.8%) and other GN had two cases. Among those with proliferative GN, IgA nephropathy (IgAN) was the most common (n = 2,186, 59.5%), followed by lupus nephritis (LN) (n = 613, 16.7%) (Table 4). Among non-proliferative GN, MGN was the most common (n = 567, 22.5%), followed by minimal change disease (MCD) (n = 476, 18.9%), type IV collagen disease (n = 360, 14.3%), focal segmental glomerulosclerosis (FSGS) (n = 313, 12.4%), and diabetic nephropathy (DN) (n = 255, 10.1%) (Table 4). Among mixed GN cases, monoclonal immunoglobulin deposition disease (n = 25, 52.1%) was the most common, followed by anti–glomerular basement membrane GN (n = 12, 25.0%). Sclerosing GN category included chronic sclerosing GN (n = 75, 72.8%) and diffuse glomerulosclerosis (n = 28, 27.2%).
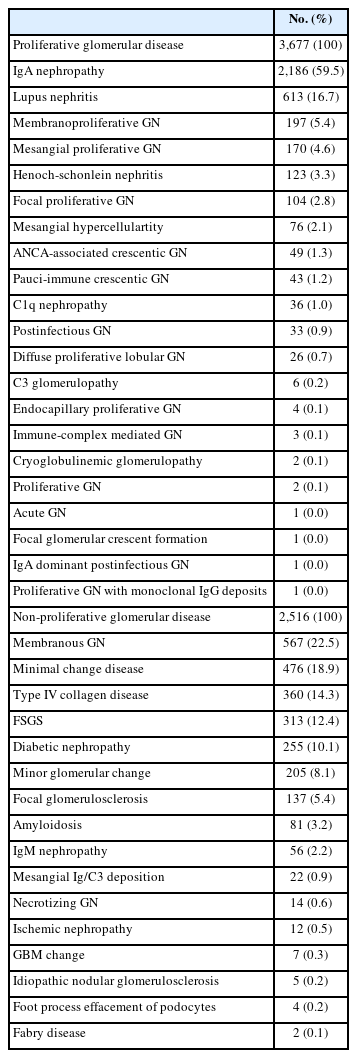
Classification of 3,677 proliferative and 2,516 non-proliferative glomerular disease cases by diagnostic category
Classification of glomerular diseases by etiologic category
When glomerular disease was classified by etiologic category, the distribution of each category was as follows: primary (n = 4,617, 72.8%), secondary (n = 1,225, 19.3%), hereditary (n = 362, 5.7%), unknown (n = 75, 1.2%), and mixed (n = 67, 1.1%). Among primary GN, IgAN (n = 2,186, 47.3%) had the highest proportion, followed by MGN (n = 567, 12.3%), MCD (n = 476, 10.3%), and FSGS (n = 313, 6.8%) (Table 5). In secondary GN, LN (n = 613, 50.0%) was the most common, followed by DN (255 cases, 20.8%), Henoch-Schonlein nephritis (n = 123, 10.0%), and amyloidosis (n = 81, 6.6%) (Table 5). Hereditary GNs were diagnosed as type IV collagen disease (n = 360, 99.4%) and Fabry disease (n = 2, 0.6%). For mixed GN, diffuse glomerulosclerosis was the most common with 28 cases (41.8%).
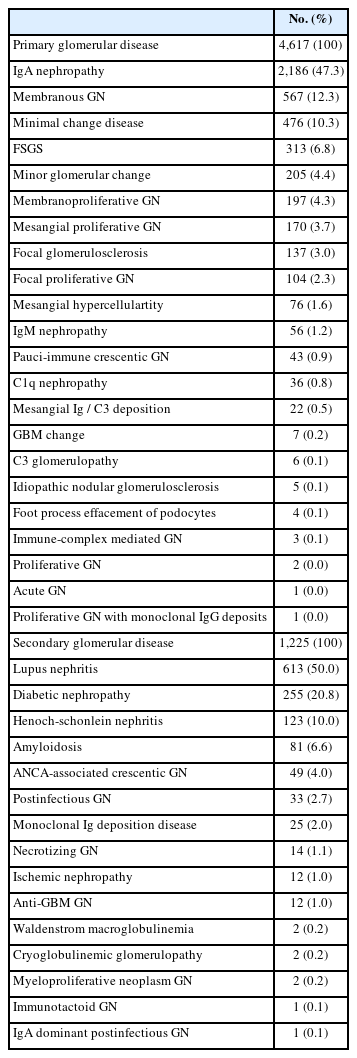
Classification of 4,617 primary and 1,225 secondary glomerular disease cases by diagnostic category
Pathologic diagnostic entities of tubulointerstitial disease in kidney biopsy
The number of tubulointerstitial diseases was 733 cases (9.0%) in 8,161 cases (Table 6). Of these, tubulointerstitial inflammation (n = 223, 30.4%) was the most common, followed by acute tubular necrosis (n = 208, 28.4%) and infection-associated tubulointerstitial disease (147 cases, 20.1%). More detailed information on each tubulointerstitial diagnostic entity can be found in Supplementary Table S2.
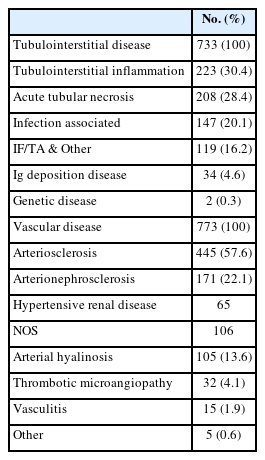
Classification of 733 tubulointerstitial and 773 vascular disease cases by diagnostic category
Pathologic diagnostic entities of vascular disease in kidney biopsy
The number of vascular diseases was 773 cases (9.5%) diagnosed in 8,161 cases (Table 6). Arteriosclerosis was the most commonly diagnosed entity (445 cases, 57.6%), followed by arterionephrosclerosis (171 cases, 22.1%), arterial hyalinosis (105 cases, 13.6%), thrombotic microangiopathy (32 cases, 4.1%), and vasculitis (15 cases, 1.9%). More detailed information on each vascular diagnostic entity can be found in Supplementary Table S3.
Kidney disease in native nephrectomy
The age and sex distribution of 732 patients who underwent native nephrectomy are shown in Fig. 2B. Kidney diseases diagnosed through nephrectomy began to increase in the 20s (n = 66, 9.0%), peaked in the 50s (n =170, 23.2%), and then gradually decreased. The mean age of the patients was 49.4 ± 16.2 years, with a sex ratio of 45:55 (Table 7). Tubulointerstitial disease was most common diagnosis (n = 474, 64.6%), followed by others (n = 174, 23.9%), glomerular disease (n = 73, 10.0%), and vascular disease (n = 11, 1.5%). The number of patients with kidney disease diagnosed through nephrectomy began to increase after the 10s (n = 12, 1.6%) and 20s (n = 66, 9.0%). It continued to increase in age groups of 30s (n = 103, 14.1%) and 40s (n = 163, 22.3%), peaking in the age group of 50s (n = 170, 23.2%). After that, it gradually decreased in age groups of 60s (n = 130, 17.8%), 70s (n = 59, 8.1%), and over 80s (n = 17, 2.3%). Among diseases diagnosed in nephrectomy specimens, tubulointerstitial disease (52.2 ± 15.3 years) was associated with a higher mean age than glomerular disease (39.2 ± 11.5 years) (p < .001). However, it showed no significant difference with vascular disease (49.8 ± 13.4 years) (p = .594). When the frequency of occurrence by sex was observed in each disease type, only tubulointerstitial disease was more frequent in females than in males (M:F = 42:58), unlike other diseases (p = .043).
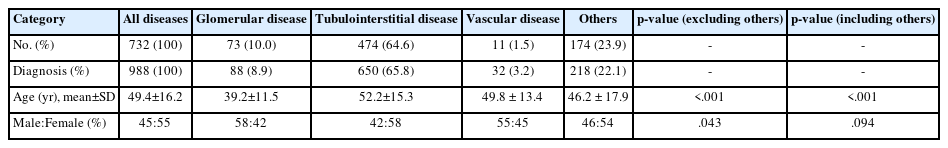
Demographic data of 732 patients who underwent native nephrectomy
Trends of kidney disease in native nephrectomy
Decadal changes of nephrectomies performed for kidney disease
The number of nephrectomies increased 1.82-fold over the three decades: from 145 patients in the 1990s to 238 patients in the 2000s and 264 patients in the 2010s (p = .200).
Decadal changes of nephrectomies classified by kidney disease types
In contrast to native kidney biopsy, tubulointerstitial disease was more common in patients with nephrectomy (Fig. 6). It was diagnosed with a higher frequency than other disease types. Its frequencies over the three decades were as follows: 84 cases, 57.9% in the 1990s; 127 cases, 53.4% in the 2000s; and 200 cases, 75.8% in the 2010s. Glomerular disease increased in the 2000s (n = 60, 25.2%) compared to the 1990s (n = 10, 6.9%), but decreased in the 2010s (n = 3, 1.1%) (p = .850). There was no significant change in the incidence of vascular disease over time: four cases, 2.8% in the 1990s, three cases, 1.3% in the 2000s; and four cases, 1.5% in the 2010s (p = .433).

Three-decade trends in renal disease types in 647 patients undergoing native nephrectomy. They were analyzed for three consecutive decades (1991–2000, 2001–2010, and 2011–2020).
Differences in kidney disease types by age group
We analyzed the distribution of kidney disease in nephrectomy tissues by age group (Fig. 7). Glomerular disease was diagnosed at a low frequency in all age groups except for the 20s and 30s (23.7%). Tubulointerstitial disease was the most common diagnosis in all age groups except in those under 20 years old. It significantly increased after the age of 20, being more common in the age group of 20–39 years (46.2%), 40–59 years (69.4%), and those over 60 years (75.7%) (p = .026). Vascular disease was diagnosed after the age of 20. Its frequency was lower than that of other disease types, showing no significant difference between age groups (p = .547).

Proportional analysis of renal disease types among four age groups in native nephrectomies. Patients were stratified into four groups: under 20 years, 20–39 years, 40–59 years, and over 60 years.
When categories of glomerular disease were analyzed according to age (Fig. 8A), proliferative GN was found in younger patients (36.8 ± 9.4 years), while non-proliferative GN (41.7 ± 14.5 years) and sclerosing GN (43.1 ± 11.5 years) were found in older patients (p = .165). When classified according to etiology categories (Fig. 8B), the mean age of secondary GN (49.9 ± 12.0 years) was higher than that of primary GN (36.7 ± 10.3 years) (p = 0.010). There was only one case of hereditary GN in a patient aged 32 years.
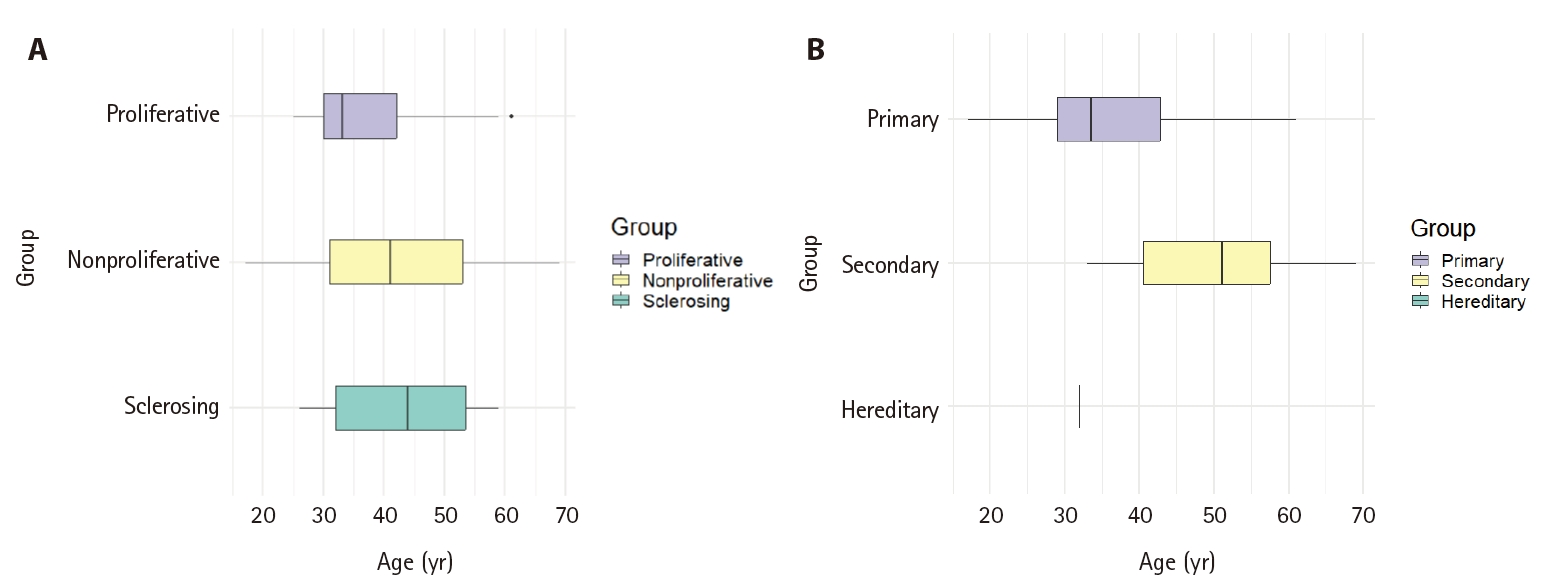
Box plot analysis of age distribution according to glomerular disease categories in native nephrectomy. (A) Morphologic categories of glomerular disease. The mean age and standard deviation of each group was as follows: proliferative (36.8 ± 9.4 years), non-proliferative (41.7 ± 14.5 years), and sclerosing (43.1 ± 11.5 years). (B) Etiologic categories of glomerular disease. The mean age and standard deviation of each group was as follows: primary (36.7 ± 10.3 years), secondary (49.9 ± 12.0 years). There was only 1 case of hereditary glomerulonephritis, aged 32 years.
Pathologic diagnostic entities of kidney disease in nephrectomy
A total of 988 cases in 732 patients had diagnosis of kidney disease by nephrectomy. Glomerular disease had 88 cases (8.9%), in which IgAN (n = 30, 34.1%) had the highest frequency. When glomerular disease was classified by morphologic category, the distribution of each category was as follows: proliferative GN, 44 cases, 50.0%; non-proliferative GN, 23 cases, 26.1%; and sclerosing GN, 23 cases, 26.1%. When glomerular disease was classified by etiologic category, the distribution of each category was as follows: primary GN, 57 cases, 64.8%; unknown GN, 16 cases, 18.2%; secondary GN, nine cases, 10.2%; mixed GN, seven cases, 8.0%; and hereditary GN, one case, 1.1%. Tubulointerstitial diseases accounted for 65.8% (650 cases) and vascular diseases accounted for 3.2% (32 cases). More detailed information on each pathologic diagnostic entity can be found in Supplementary Table S4.
DISCUSSION
Although renal biopsy is used as the gold standard for diagnosing kidney disease [3,6,7,10,13,26,27], it does not represent all diseases that actually occur in the kidney because diseases diagnosed through nephrectomy are rarely reported [25,28,29].
Our 33-year retrospective study of kidney disease presents comprehensive data and long-term trends in all kidney diseases diagnosed by pathology through biopsy or nephrectomy in South Korea. Among 9,149 cases of kidney diseases in 7,803 patients, glomerular disease (70.3%) showed the highest frequency, followed by tubulointerstitial disease (15.1%) and vascular disease (8.8%). The proportion of glomerular disease was high in the biopsy group and the proportion of tubulointerstitial disease was high in the nephrectomy group, similar to results described in previous reports [3,6-8,11,13].
Renal biopsy and nephrectomy have been increasing in South Korea over the past 33 years, with renal biopsies being performed most frequently in women in their 30s and nephrectomies in women in their 50s. In this study, the average age of diagnosis differed by about 9 years between biopsy (40.5 ± 16.8 years) and nephrectomy (49.4 ± 16.2 years) groups (p < .001). This is likely because nephrectomy is performed only when kidney disease has progressed to chronic renal failure. Reports have shown that the average age at which renal biopsy is performed is increasing [7,8,12] and that the prevalence of kidney disease in the elderly is gradually increasing [5-9,12].
The sex ratio of our study showed a slightly higher proportion of females in biopsy (male:female = 49:51). The proportion of females was even higher in nephrectomy (male: female = 45:55) compared to biopsy (p = .030). This is probably because the proportion of females was higher in glomerular disease, which accounted for 86.9% of biopsy patients (p = .002), and in tubulointerstitial disease, which accounted for 64.6% of nephrectomy patients (p = .043) than in other disease types. Some previous studies have shown a male dominance [3,6,9,17,20] or a female dominance [5,6,16]. Such differences might be due to differences by country [6,8-10,12,13,17,20,23,24], region [16,19], race [9,17], disease type [8,9,12,17,20,21,24], and age [21] in patients who undergo renal biopsy. In the International Kidney Biopsy Survey, male dominance was observed in the United States/Canada (52.3%) and Europe (56.4%), while the opposite was observed in Asia (49.5%) and Latin America (36.4%) [17]. Unlike our study, an analysis of 21,426 patients with kidney disease diagnosed by biopsy in South Korea over the past 40 years reported a male predominance of 54% [3].
In this study, renal biopsy was performed in 7,071 patients. Its frequency increased 1.54 times in the 2010s compared to that in the 1990s. The frequency of glomerular disease has increased gradually over the three decades. Glomerular disease accounted for more than 80% in all age groups, showing the highest frequency of 95.6% in those under 20 years (p = .013). This was similar to other previous reports showing increased biopsy rates [3,7,8,12,13,24]. The frequency of glomerular diseases has also increased in many countries [3,6-8,10,11,13,18-21]. In this study, glomerular disease was found to have a younger mean age at diagnosis (39.7 ± 16.7 years) than tubulointerstitial disease (49.1 ± 16.2 years) and vascular disease (48.1 ± 15.3 years) (p < .001). Among glomerular diseases, IgA-related GN (36.4%) was the most common in our study, consistent with previous research results showing that IgAN was the most common kidney disease in South Korea (28.30%–34.17%), Asia (23.90%–54.0%), and Europe (22.1%) [3,6,8,10,11,13,17,19-21].
When our 6,346 cases of glomerular diseases were classified by etiologic category, each category was as follows: primary (72.8%), secondary (19.3%), hereditary (5.7%), unknown (1.2%), and mixed (1.1%). Among primary GN, IgAN (47.3%) had the highest proportion, followed by MGN (12.3%) and MCD (10.3%). In secondary GN, LN (50.0%) was the most common, followed by DN (20.8%), Henoch-Schonlein nephritis (10.0%), and amyloidosis (6.6%). According to previous reports on the composition of glomerular diseases in adult renal biopsies, primary GN (48.1%–79.1%), secondary GN (15.7%–36.2%), vascular nephropathy (4.1%–12.8%), and tubulointerstitial nephritis (TIN) (2.2%–10.5%) were reported [8,12,13,18,20,22].
When our cases were classified by morphologic category, proliferative GN (57.9%) was the most common, followed by non-proliferative (39.6%), sclerosing (1.6%), and mixed (0.8%). Among proliferative GN, IgAN was the most common (59.5%), followed by LN (16.7%). Among non-proliferative GN, MGN was the most common (22.5%), followed by MCD (18.9%), type IV collagen disease (14.3%), FSGS (12.4%), and DN (10.1%). In previous studies, the most common primary GNs were MGN and IgAN, with LN being the most common among secondary GNs [6,7,10,12,13,17,20]. According to previous reports, the type of glomerular disease has also changed since the 1990s, with IgAN decreasing while MGN or anti-neurophil cytoplasmic antibody–associated vasculitis shows a steady increase [6,7,12,21-23]. The prevalence of secondary GN has also increased [8,13].
The proportion of our patients with tubulointerstitial disease was 5.9%. It increased with age, showing the highest prevalence in those aged 60 years and older (p = .008). In other biopsy studies, the frequency of tubulointerstitial disease has been reported as 3.4% [8], 4.4% [22], 8.4% [7], 10.5% [13], 12.3% [20], or 17.9% [9]. In our renal biopsies, TIN and acute tubular necrosis were the most common diseases, similar to results of previous reports [8,12,22,23]. In this study, the prevalence of vascular disease was 8.8%, which increased with age. It was the highest in patients aged 60 years or more (p = .032), with arterio/arteriolosclerosis being the most common. Previous renal biopsy studies have also reported that rates of vascular disease range from 3.9% to 16.3% [8,9,13,18,19,22,24].
In our study, the number of nephrectomies performed for nonfunctioning kidneys increased 1.82-fold over the last 30 years (p = .200). The most common diagnosis was tubulointerstitial disease (64.6%). The mean age when tubulointerstitial disease was diagnosed was 52 years, which was older than other diseases diagnosed at nephrectomy (p < .001). Tubulointerstitial disease was more prevalent in women (M:F = 42:58). Its frequency increased with increasing age, showing the highest prevalence in those aged over 60 years (11.3%), higher than in other age groups (p = .026).
In Norway, 30.8% of 646 patients who underwent nephrectomy had a benign nonfunctioning kidney. This frequency has decreased over the past 20 years. Among these patients, female predominance was 3.1 times higher in patients with infectious diseases [28]. Similar to our results, in 1,093 patients who underwent simple nephrectomy for benign disease, the mean age was 52 years with a female predominance (61.7%). Diagnoses included nonfunctioning kidney (49.1%), stones (12.9%), chronic pyelonephritis (11.8%), and others (26.0%) [25].
This study has some limitations. First, there was a lack of clinical data related to patients diagnosed with pathology. Second, because it was a single-center analysis, the diversity of study subjects might be limited. Finally, because no additional corrections for the diagnosis were made to reflect changes in classification of pathology, there might be differences with current classification.
This study is a comprehensive review of kidney disease in native kidneys in South Korea based on histopathologic diagnosis. It targeted all kidney diseases in patients who received a pathological diagnosis. Considering that the prevalence of kidney disease has been steadily increasing over time, further research through multi-institutional joint studies is needed to secure accurate information.
In conclusion, kidney disease has been increasing in native kidneys in South Korea over the past 33 years. Glomerular disease was found to be the most common in all age groups, while tubulointerstitial and vascular diseases increased in the elderly aged over 60 years.
Supplementary Information
The Data Supplement is available with this article at https://doi.org/10.4132/jptm.2025.06.18.
Notes
Ethics Statement
This study was approved by the Institutional Review Board (IRB) of The Catholic University of Korea, Seoul St. Mary’s Hospital (IRB approval no. 2024-3117-0001, date of approval: 10 January 2025). It was performed in accordance with the Declaration of Helsinki. The requirement for written informed consent was waived because of its retrospective nature.
Availability of Data and Material
The datasets generated or analyzed during the study are available from the corresponding author on reasonable request.
Code Availability
Not applicable.
Author Contributions
Conceptualization: YJC. Data curation: YJC, HN, JK. Formal analysis: HN, JK. Funding acquisition: YJC. Investigation: YJC, HN, JK. Methodology: YJC, HN, JK. Project administration: YJC, HN. Resources: HN, JK. Software: HN, JK. Supervision: YJC. Validation: YJC. Visualization: HN, JK. Writing—original draft: YJC, HN. Writing—review & editing: YJC, HN. Approval of final manuscript: all authors.
Conflicts of Interest
The authors declare that they have no potential conflicts of interest.
Funding Statement
This study was supported by a grant (Project Number: 9991006769, KMDF_PR_20200901_0096) of the Korea Medical Device Development Fund. It was also supported by a grant (NTIS, KMDF_RnD_20200901_0096) funded by the Korea government (the Ministry of Science and ICT, the Ministry of Trade, Industry and Energy, the Ministry of Health & Welfare, the Ministry of Food and Drug Safety).