3-Dimensional reconstruction reveals frequent intraluminal growth of submucosal veins in surgically resected pT1 colorectal cancers
Article information

Abstract
Background
Although venous invasion (VI) is associated with distant metastasis and observed in >50% of pT2–4 colorectal cancers (CRCs), the role of VI in pT1 CRCs is not well-defined.
Methods
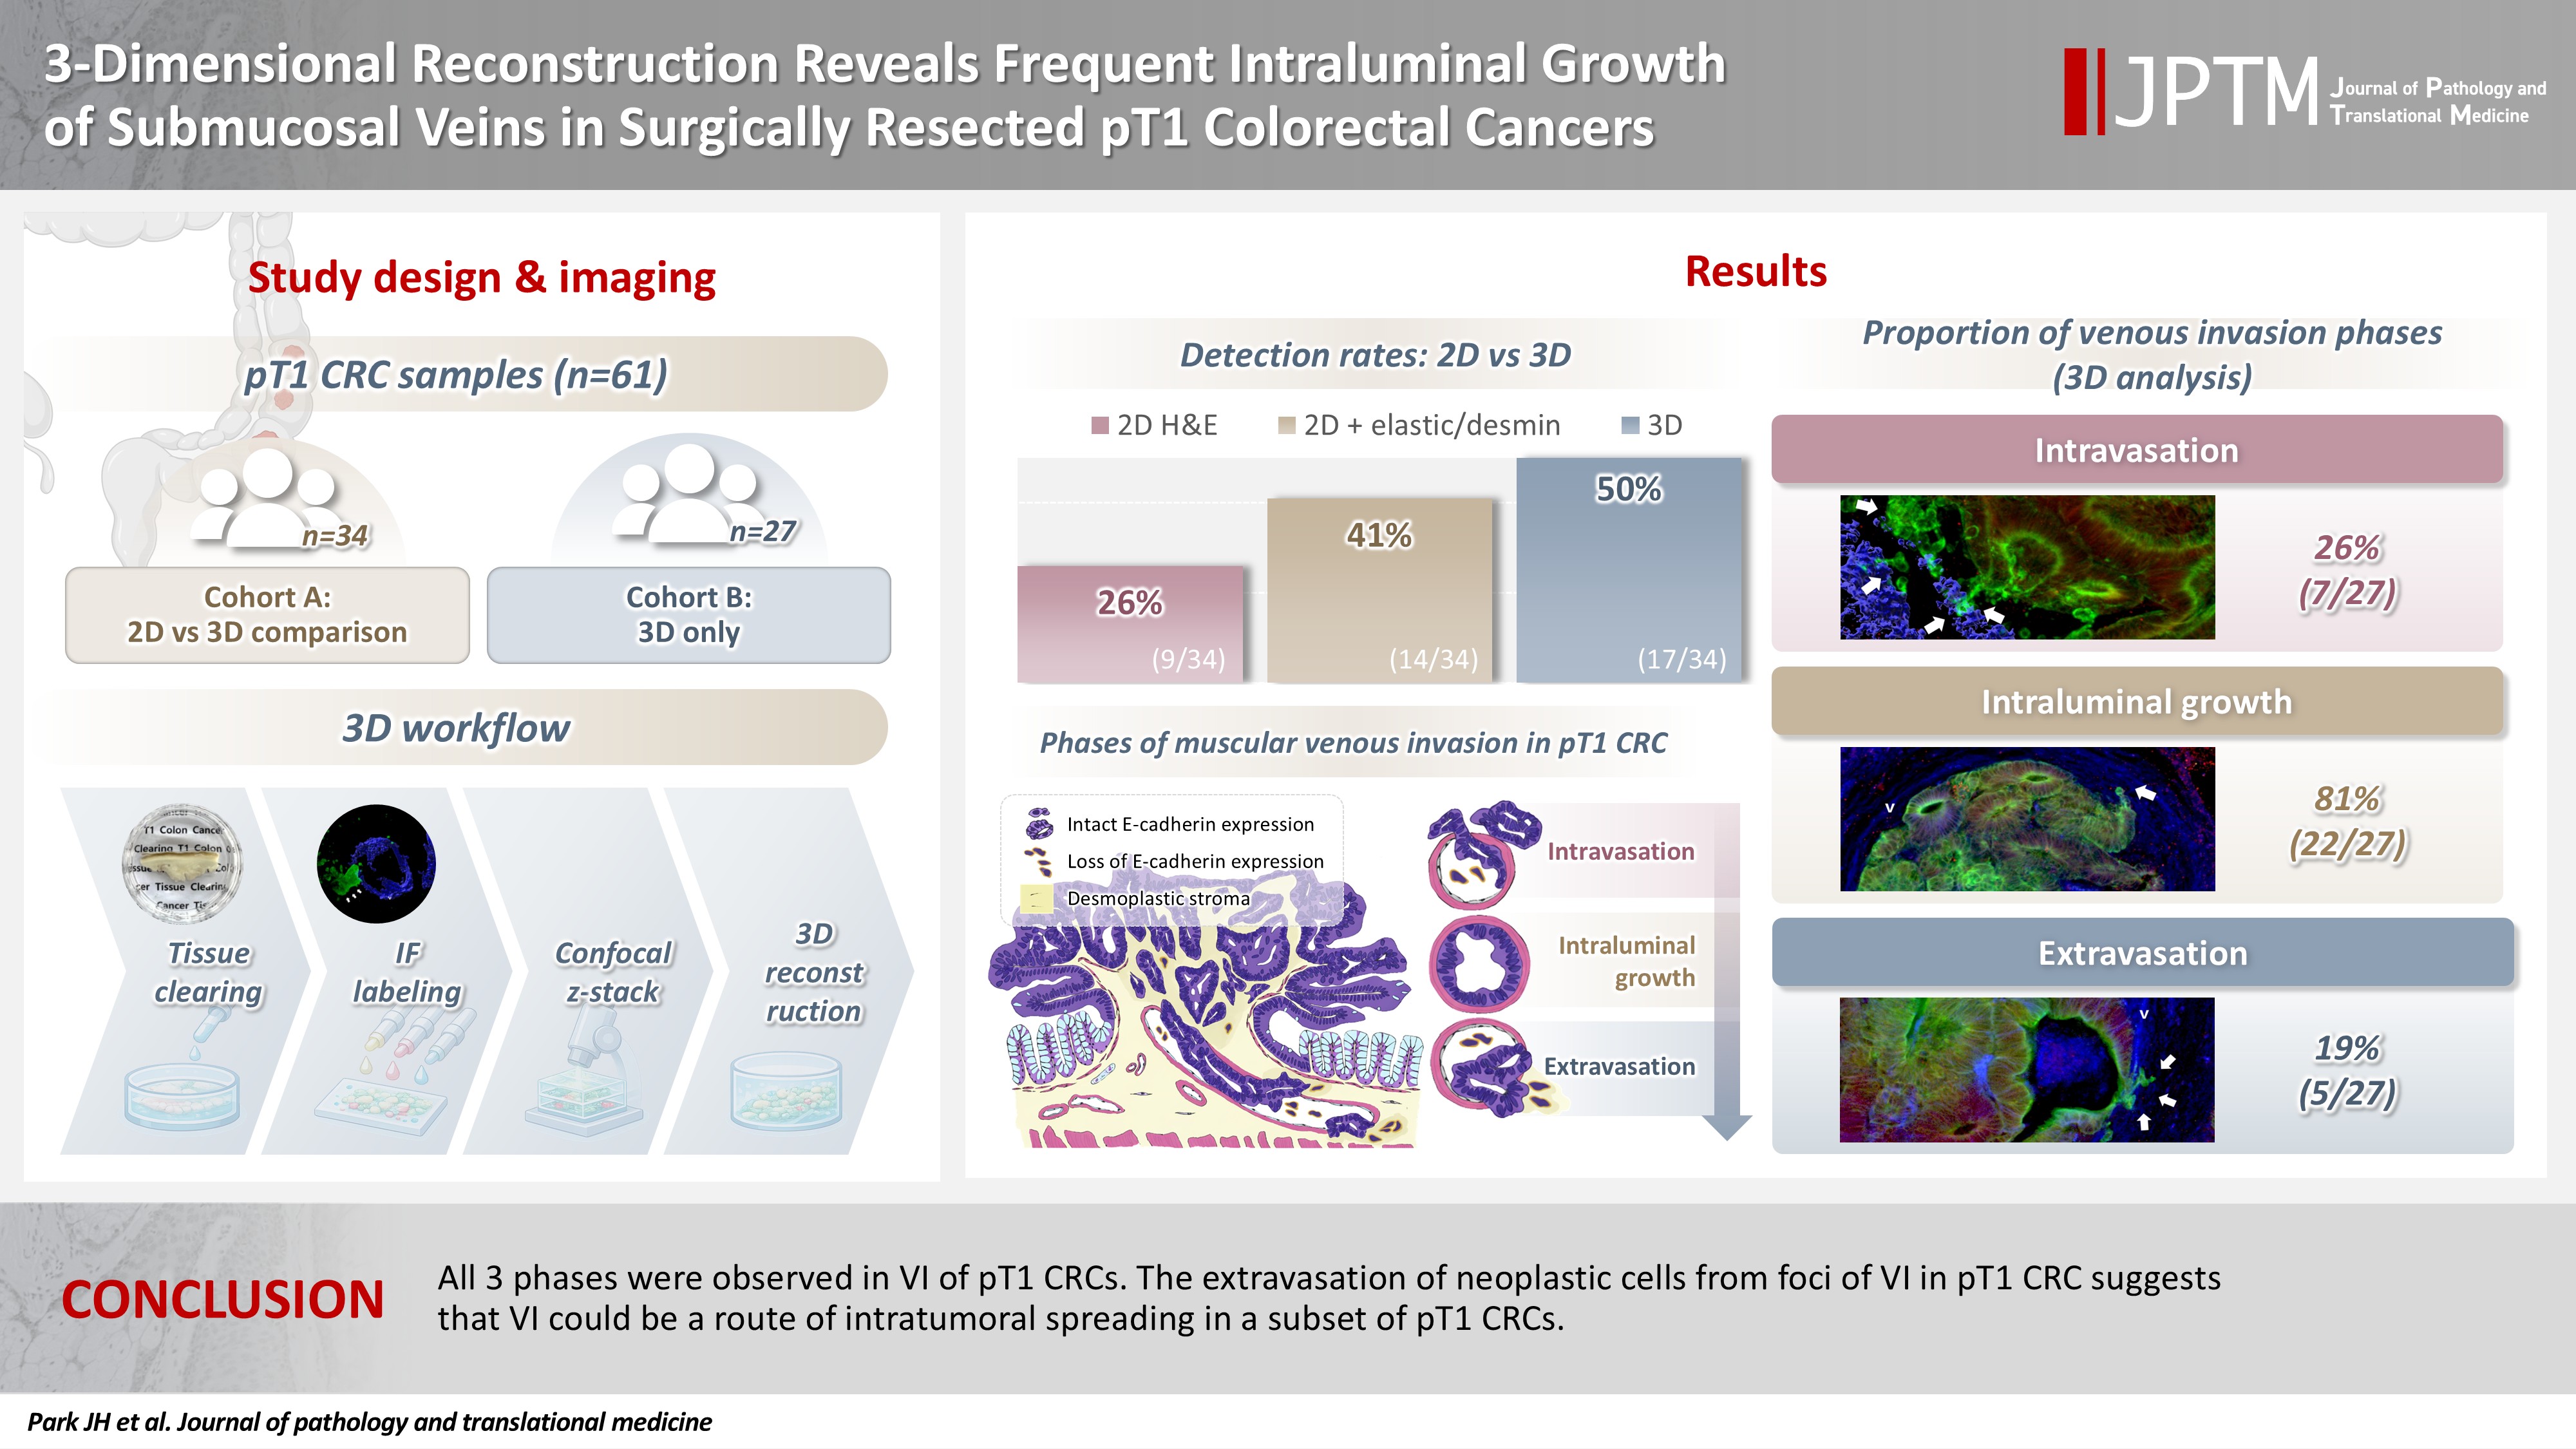
Thirty-four surgically resected pT1 CRCs were reevaluated for 2-dimensional (2D) VI using hematoxylin and eosin (H&E)–stained slides with additional elastic and desmin immunohistochemical staining (cohort A). Additionally, 27 pT1 CRCs without knowing VI status were selected for 3-dimensional (3D) VI evaluation only (cohort B). All 61 cases (cohorts A and B) were studied in 3D using tissue clearing.
Results
VI was detected more commonly in 3D (17/34, 50.0%) than in 2D H&E slide evaluation (9/34, 26.5%, p = .047). When VI was identified in 3D (27/61, 44.3%), the most common phase was that of intraluminal growth (22/27, 81.5%), followed by intravasation (7/27, 25.9%) and extravasation (5/27, 18.5%). E-cadherin expression was characterized in 3D in foci of VI and varied in each phase of invasion.
Conclusions
All three phases were observed in VI of pT1 CRCs. The extravasation of neoplastic cells from foci of VI in pT1 CRC suggests that VI could be a route of intratumoral spreading in a subset of pT1 CRCs.
INTRODUCTION
Colorectal cancer (CRC) is the second-most prevalent cancer with the third-highest mortality rate (11%) in Korea, whereas it is the third-most common cancer with the same mortality ranking in the United States [1,2]. The 5-year survival outcomes for individuals diagnosed with localized and regional CRC are 94% and 83%, respectively. However, the 5-year survival rate declines markedly to 20% among patients exhibiting distant metastases [1]. Distant metastases are detected in up to 16% of patients diagnosed with CRC, with the liver being the most common site [3,4]. Venous invasion (VI) is a critical step in the development of liver metastases as cancer cells can metastasize through the inferior mesenteric or portal veins [5-8]. VI can be detected in more than half of the surgically resected pathological pT2–T4 category (pT2–T4) CRCs with the help of stains, such as elastic, that highlight vessels [9-12]. Recently performed 3-dimensional (3D) evaluation of VI of pT2–T4 CRCs revealed phases of intravasation, intraluminal growth, and extravasation associated with VI [12].
CRCs with invasion limited to the submucosal layer are classified as pT1, and, in the absence of metastases, these cancers can be cured by complete surgical resection [13]. Lymph node metastasis occurs in approximately 8% to 13% of pT1 CRCs and lymphovascular invasion is highly associated with increased risk of lymph node metastasis [14-21]. With conventional 2-dimensional (2D) hematoxylin and eosin (H&E)–stained slides only, distinguishing among the different types of vessels, including small lymphatic vessels, capillaries, and postcapillary venules (vessels lacking a distinct smooth muscle layer), is extremely difficult, which is why all invasion into all of these vessels are collectively called lymphovascular invasion [22]. Since it is difficult to distinguish lymphatic invasion only with the commonly used H&E-stained slides, elastic staining, and desmin immunohistochemical staining can be performed to confirm the presence of VI and differentiate it from lymphatic invasion [23,24]. VI can be observed in any layer of the colorectum. However, its role in pT1 CRCs has not been systematically well-defined.
Therefore, the purpose of the present study is to investigate the patterns of VI in pT1 CRC tissues using tissue clearing, immunofluorescence labeling, confocal microscopy, and 3D image reconstruction.
MATERIALS AND METHODS
Patients and tissue preparation
Two cohorts were assembled following approval by the Institutional Review Board with a waiver of patient consent (approval number: 2023-1417). Cohort A consisted of 34 surgically resected pT1 CRC, preserved as formalin-fixed, paraffin-embedded (FFPE) tissue blocks between 2010 and 2023 from patients with (9 cases) or without (25 cases) a prior history of endoscopic mucosal resection (EMR) or endoscopic submucosal dissection (ESD). For enrichment of inclusion of a possible VI, 34 pT1 CRC cases with definite or suspicious foci of lymphovascular invasion on surgical pathology reports were included. For the nine cases with a prior history of EMR or ESD (7 cases with EMR and 2 cases with ESD), surgically resected pT1 CRC tissues were used instead of EMR or ESD pT1 CRCs, as the thermal artifacts of the bases of EMR and ESD specimens hinder complete tissue clearing due to protein denaturation. In contrast, the thermal artifacts of the EMR and ESD scar were completely healed in nine surgical resection specimens, because surgical resections were performed about 3 months after EMR or ESD. One representative FFPE tissue block containing muscular VI foci was chosen from each of the 34 cases in cohort A. All histopathologic features, including the presence of lymphovascular invasion, were reassessed by three experienced gastrointestinal pathologists (J.S., J.K., and S.M.H.) to ensure reliability and consistency of the clinicopathologic data. Additionally, 27 fresh-frozen pT1 CRC tissue slabs (cohort B) were acquired from the institutional biobank, Bio-Resource Center, which is a member of the Korea Biobank Network, without knowledge of their VI status (approval number: 2023-24[275]). All 61 pT1 CRC cases were studied for 3D pathologic evaluation.
Elastic staining and desmin immunohistochemical labeling of 2D microscope slides
The modified elastica van Gieson technique was employed for elastic staining on tumor blocks from the 34 cancers in cohort A. Desmin immunohistochemical labeling (1:200, D33, Dako, Glostrup, Denmark) was performed in the immunohistochemistry laboratory of the Department of Pathology at Asan Medical Center. Briefly, tissue sections of 4 μm thickness were deparaffinized and rehydrated through serial immersions in xylene and graded ethanol solutions. Endogenous peroxidase activity was blocked by incubation in 3% H2O2 for 10 minutes, followed by heat-induced antigen retrieval. Immunohistochemical labeling was performed with an autostainer (Benchmark XT, Ventana Medical Systems, Tucson, AZ, USA) in accordance with the manufacturer’s protocol. Sections were incubated at room temperature for 24 or 32 minutes with primary antibodies targeting desmin, followed by washing. Suspicious VI foci on H&E-stained slides were reassessed using elastic and desmin immunohistochemical labeling to enhance the identification of VI.
Sample preparation for 3D visualization
All FFPE (34 from cohort A) or fresh-frozen (27 from cohort B) tissue specimens underwent fixation in 10% buffered formalin and were maintained in a chilled solution of 0.02% sodium azide in phosphate-buffered saline (PBS). Tissues were dehydrated through a graded methanol series (50%, 80%, 90%, and three changes of 100%) at room temperature and incubated overnight at room temperature with a solution of 66% dichloromethane/33% MeOH. Tissue specimens were washed twice in 100% methanol to oxidize endogenous pigments and autofluorescent proteins, including red blood cells, and subsequently incubated at 4°C in a 5% hydrogen peroxide solution. The samples were rehydrated through serial dilutions of methanol and subsequently washed twice in PBS containing 0.2% Triton X-100 for 1 hour. Tissue samples were incubated at 37°C for 2 days in a solution of PBS/20% dimethyl sulfoxide/0.2% Triton X-100, and 0.3 mol/L glycine to enhance permeability.
Primary antibody binding for 3D visualization
CRC tissues were incubated at 37°C for 2 days in PBS containing 0.2% Triton X-100, 10% dimethyl sulfoxide, and 6% donkey serum to minimize nonspecific antigen-antibody interactions, followed by washing in PBS with 0.2% Tween-20 and 10 mg/mL heparin at 37°C for 1 hour. Heparin served to lower background labeling [12].
Primary antibodies used in this study included cytokeratin 19 (1:200, EP1580Y, rabbit monoclonal, Abcam, Cambridge, UK), desmin (goat polyclonal; 1:100, LifeSpan Biosciences, Shirley, MA, USA), CD31 (1:100, JC/70A, mouse monoclonal, Thermo Fisher Scientific, Waltham, MA, USA) and E-cadherin (1:150, M168, mouse monoclonal, Abcam). A maximum of three primary antibodies were applied simultaneously, and the antigen retrieval step was omitted. Following primary antibody labeling, tissue samples were washed five times for 1 hour each in PBS containing 0.2% Tween-20 and 10 mg/mL heparin. In CRCs, the dense desmoplastic stroma can function as a barrier that restricts antibody infiltration. Consequently, the following techniques were applied to enhance antibody penetration: (1) gradual increase of antibody concentration, (2) centrifugation, (3) use of pepsin-digested secondary antibody fragments, and (4) sonication.
Fluorescent labeling of antibodies for 3D visualization
Fragmented secondary antibodies, such as Alexa Fluor 488-conjugated AffiniPure F(ab')2 fragment donkey anti-rabbit IgG (Jackson Immuno Research, West Grove, PA, USA), DyLight 405-conjugated AffiniPure F(ab')2 fragment donkey anti-goat IgG (Jackson Immuno Research), and cyanine-3-conjugated AffiniPure F(ab')2 fragment donkey anti-mouse IgG were incubated at 37ºC for 4 days in PBS containing 3% donkey serum, 0.2% Tween-20, and 10 mg/mL heparin, while being protected from light. The tissue samples were centrifuged at 400 ×g for 12 hours daily and sonicated for 1 hour and washed five times for 1 hour each in PBS/0.2% Tween-20 and 10 mg/mL heparin solutions at room temperature. All procedures were performed while shielded from light to preserve fluorescence.
Tissue clearing for 3D visualization
The tissues were gradually dehydrated in ascending concentrations of methanol (50%, 80%, and 100%) and incubated for 3 hours in a 66% dichloromethane/33% methanol mixture. They were then treated twice with 100% dichloromethane for 15 minutes. The samples were then immersed in dibenzyl ether (DBE) overnight. Representative images of pT1 CRC tissues before and after tissue clearing are shown in Fig. 1.
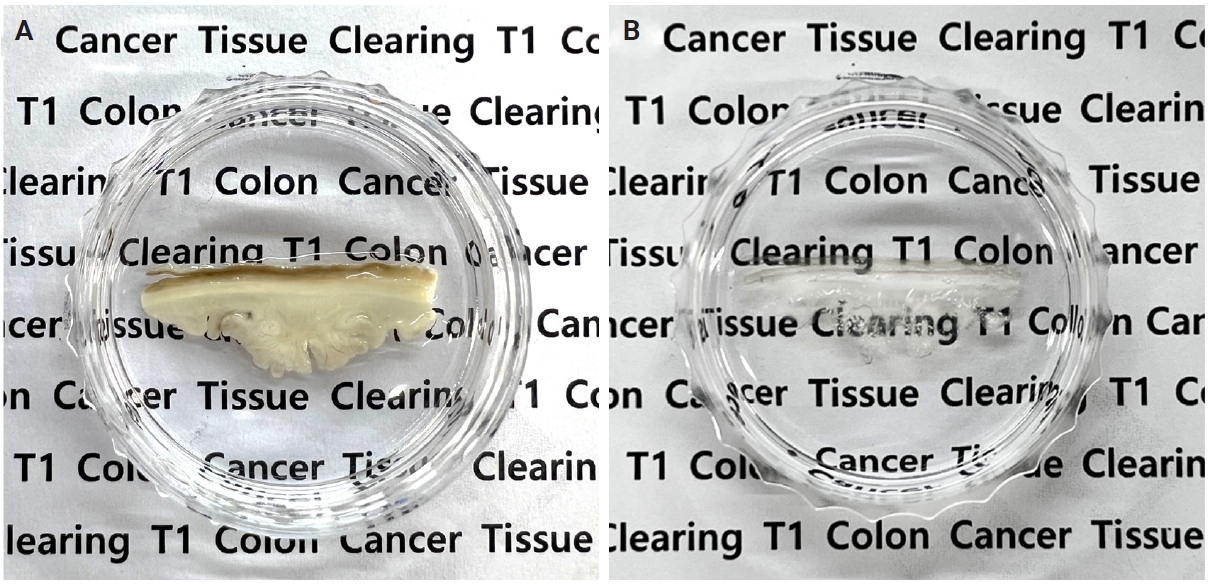
Representative images of pT1 colorectal cancer tissues before (A) and after (B) tissue clearing.
Visualization and 3D reconstruction
Immunolabeled cleared tissues were submerged in DBE within glass bottom culture dishes to match the refractive index between the glass, DBE, and tissue specimens. The specimens were imaged with an inverted confocal laser scanning microscope (LSM780, Carl Zeiss, Oberkochen, Germany). The signal of cytokeratin 19 conjugated to Alexa Fluor 488 was detected in both normal and malignant colorectal epithelial cells, using bandpass filter set 38 with an excitation range of 450/50 nm and emission range of 510/50 nm. The DyLight 405 signals indicate desmin expression in smooth muscle cells and were observed via a set of bandpass filters with an excitation range of 365 nm and an emission range of 445/50 nm. The Cyanine-3 signal of e-cadherin-labeled epithelial cells was observed using bandpass filter set 43 with an excitation range of 545/25 nm and an emission range of 605/70 nm. Despite treatment to reduce autofluorescence, residual signals persisted in the arterial elastic layers and collagen. This autofluorescence was useful for distinguishing arteries from veins. A z-stack image with a 2.5-μm interval was captured using a C-Apochromat 10×/0.45 W M27 objective lens, while a 1.5-μm interval z-stack image was obtained with a C Epiplan-Apochromat 20×/0.7 DIC M27 lens. The resulting continuous z-stack images were processed as single-layer images using Zen 2012 SP5 software (Carl Zeiss). Subsequently, the images were reconstructed into 3D images using IMARIS 9.8.0 software (Bitplane, Zurich, Switzerland) with each fluorescent signal rendered to distinctly visualize out-of-focus regions.
3D imaging and analysis
VI evaluation with 3D reconstruction for cohorts A and B was performed by two experienced gastrointestinal pathologists (J.S. and S.M.H.). In 3D analysis, VI was categorized into three phases: (1) intravasation, (2) intraluminal growth, and (3) extravasation, as previously described [12]. Briefly, the differentiation between intravasation and extravasation is determined by the positioning of cancer cell foci in reference to the broader aggregation of cancer cells, either within or external to the muscular vein. The intravasation phase involves cancer cells forming small groups that extend into the vein’s inner lining, while a considerably greater number of tumor cells are found beyond the muscular layer of the vein. Intraluminal growth refers to the accumulation of cancer cells inside the vein lumen, occurring without disruption to the muscular wall’s structure. The extravasation phase refers to a limited number of cancer cells migrating beyond the muscular layer of the vein, while a greater population remains within the vein lumen.
Statistical analysis
Statistical analysis was performed using IBM SPSS software ver. 21 (IBM Corp., Armonk, NY, USA). Continuous variables were tested by the Student t-test and categorical data were evaluated by the chi-square test or Fisher's exact test. Statistical significance was defined as a p-value below .05.
RESULTS
Characteristics of the cases
The clinicopathologic features of the 61 patients in cohorts A and B with pT1 CRC are detailed in Table 1. Overall, the patients in cohorts A and B had a mean age of 62.1 ± 8.9 and 62.6 ± 11.3 years, respectively. Most CRCs were tubular adenocarcinomas (33 cases, 97.1% in cohort A; 26 cases, 96.3% in cohort B), except for one mucinous carcinoma in each group. Residual tubular adenocarcinomas were identified in all nine surgical resection specimens after previous EMR or ESD of cohort A. Because cohort A was selected with more cases of lymphovascular invasion for enrichment of inclusion of a possible VI, CRCs in cohort A had more lymphovascular invasion (p < .001), nodal metastasis (p < .001), and tumor budding (p < .001) than pT1 CRCs in cohort B. Patients in cohort A were followed for a median of 26 months (range, 1 to 38 months). Throughout the follow-up, lung metastasis was observed in one patient. The median follow-up time of cohort B could not be applied because specimens came from the Bio-Resource Center.
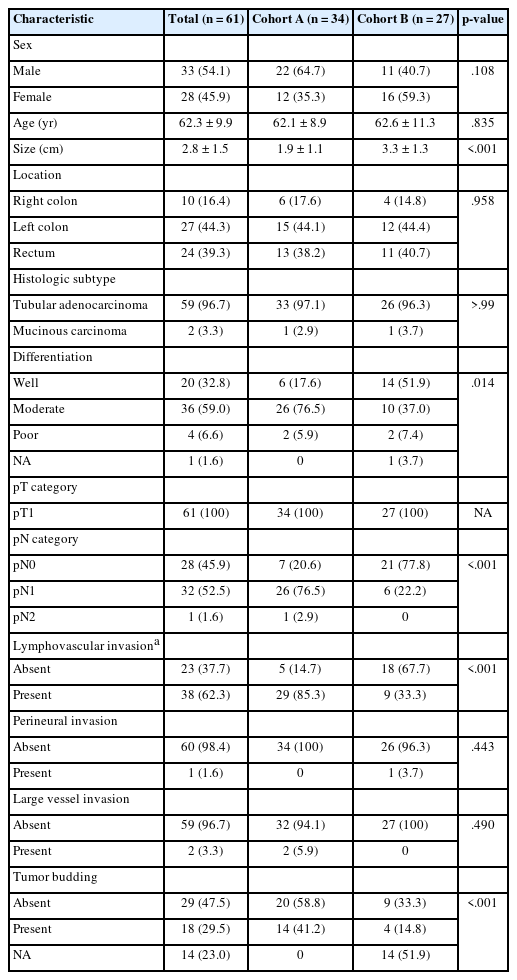
Clinicopathologic characteristics of cohort A (pT1 CRCs with enriched lymphovascular invasion) and cohort B (pT1 CRCs without knowing VI information) of pT1 CRC tissue
Tissue clearing of pT1 CRC tissues
Muscular veins were detected with desmin labeling. The distinction between veins and arteries relied on a combination of morphological features. Desmin immunolabeling of veins tended to be less pronounced than that of the arteries. The tunica media in muscular veins tended to exhibit reduced thickness relative to muscular arteries. A well-formed elastic lamina interna was observed in the arterial walls, appearing as autofluorescent concentric lines exhibiting a characteristic wavy pattern. As the assessment of VI is hindered by the normal expression of desmin in the muscularis mucosae, the current investigation concentrated on the VI of cancer cells within the submucosal layer.
Comparison of VI detected in 2D (H&E, elastic, desmin) versus 3D
Evaluation of VI with 2D H&E only and a combination of H&E, elastic, and desmin staining was available only in cohort A. Subsequently, the prevalence of VI in cohort A was evaluated by H&E staining alone, combined H&E, elastic, and desmin staining, and 3D reconstruction. The prevalence of VI was 9/34 (26.5%) in H&E only, 14/34 (41.2%) in a combination of H&E, elastic, and desmin staining, and 17/34 (50.0%) in 3D evaluation (Table 2). The combination of H&E, elastic, and desmin staining showed higher VI detection rates than in H&E slide evaluation alone; however, this difference did not reach statistical significance (p = .200). The difference in VI frequency between a combination of H&E, elastic, and desmin staining and 3D evaluation did not reach statistical significance (p = .465). However, 3D evaluation detected VI more frequently than in 2D H&E slide evaluation alone (p = .046). No significant difference in the prevalence of VI by 3D evaluation was observed between cohort A and cohort B (17/34, 50.0% vs. 10/27, 37.0%; p = .120) (Table 2).
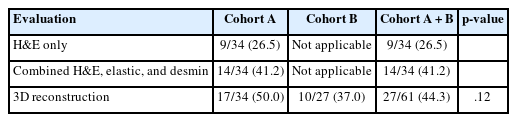
Frequency of venous invasion by H&E staining only, additional elastin and desmin staining and 3D evaluation
Since lymphovascular invasion is composed of lymphatic invasion and VI, we compared the lymphovascular invasion status in the surgical pathology report with the reevaluated VI status using H&E only, combined H&E, elastic, and desmin staining, and 3D reconstruction (Table 3). The proportion of VI of the lymphovascular invasion in cohort A was gradually increased from 27.6% (8/29) evaluated by H&E only, 44.8% (13/29) by combined H&E, elastic, and desmin staining, to 51.7% (15/29) by 3D reconstruction.
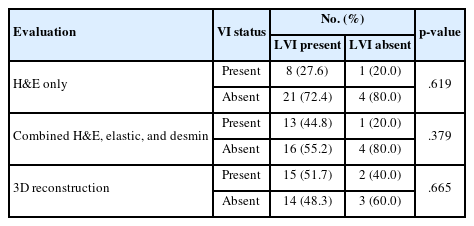
Comparison of LVI on surgical pathology report and re-evaluated venous invasion by H&E only, combined H&E, elastic, and desmin, and 3D reconstruction in cohort A
Comparison of VI detected by 3D reconstruction and clinicopathologic characteristics
We compared VI detected by 3D reconstruction and clinicopathologic characteristics among pT1 CRCs in all cohorts A and B (Table 4). VI detected by 3D reconstruction was more commonly observed in CRCs with lymphovascular invasion (p < .001). There was a marginal significance between VI detected by 3D reconstruction and pN1 (p = .050). However, there was no significant association between VI detected by 3D reconstruction and other clinicopathologic characteristics.
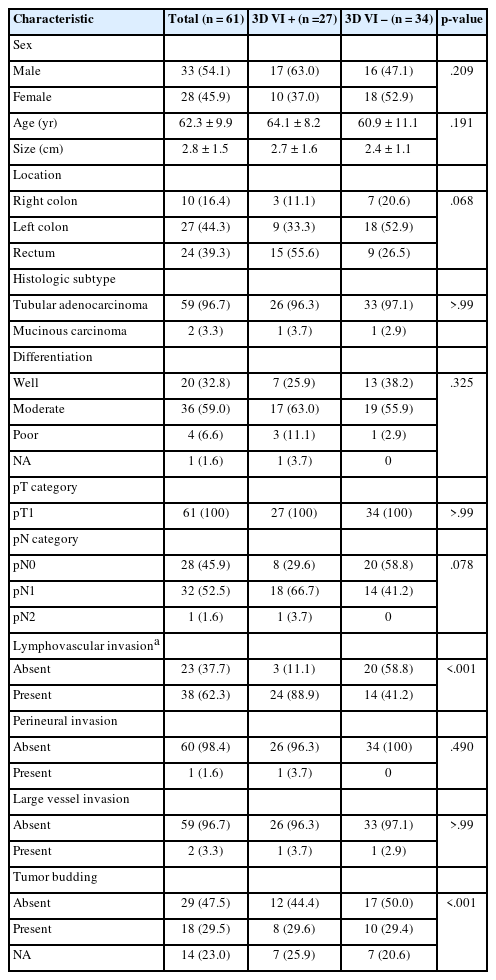
Comparison of VI detected by 3D reconstruction and clinicopathologic characteristics among pT1 colorectal cancers in all cohort
3D pathologic evaluation of VI of pT1 CRCs
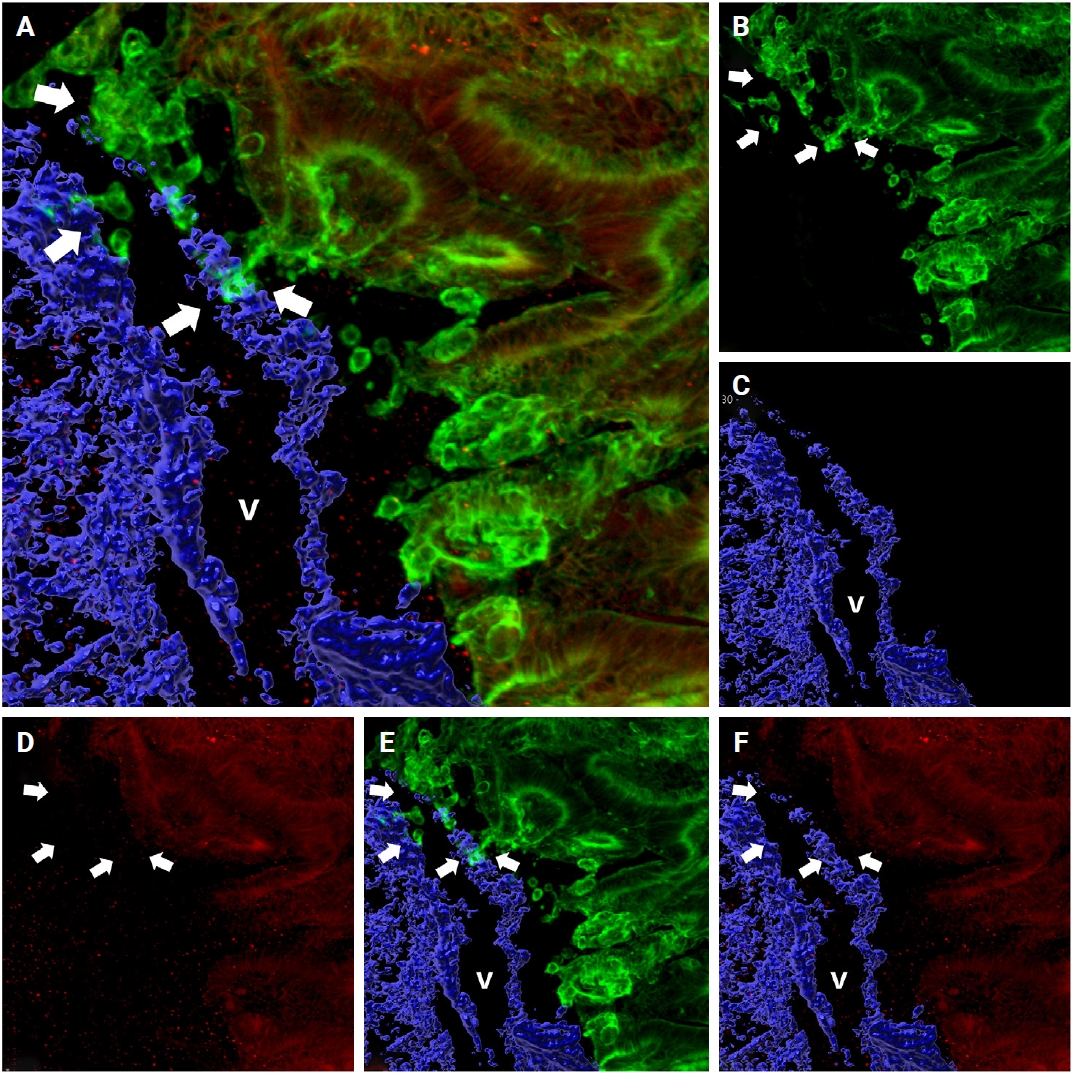
When cancer cells in the stroma are away from the muscular venous wall, they approach the vein to invade into blood vessels (Fig. 2). At this time, the cancer cells seem to extend projections toward the muscular veins, and small clusters are noted around the main projections.
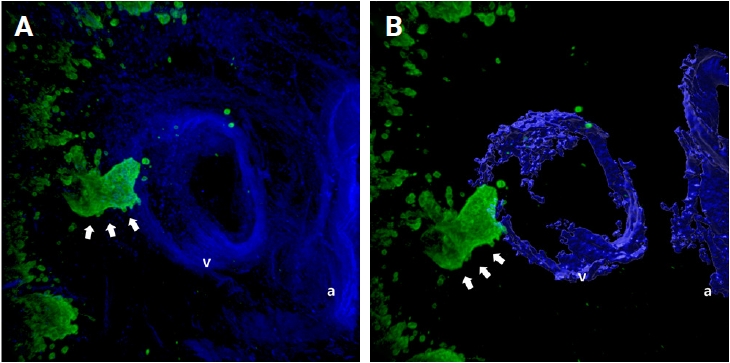
Representative images of the approaching of cancer cell clusters (arrows) to the muscular venous wall. (A) Merged cytokeratin 19 and desmin image. (B) Rendered image of (A). Green labeling for cytokeratin 19 highlights cancer cells, blue labeling for desmin highlights the muscular layer of the muscular vein. a, artery; v, vein.
In 27 out of 61 cases (44.3%) of thick tissue slabs from pT1 CRCs, 3D analysis revealed the presence of VI. We largely divided the process of VI into three phases: intravasation, intraluminal growth, and extravasation (Fig. 3).
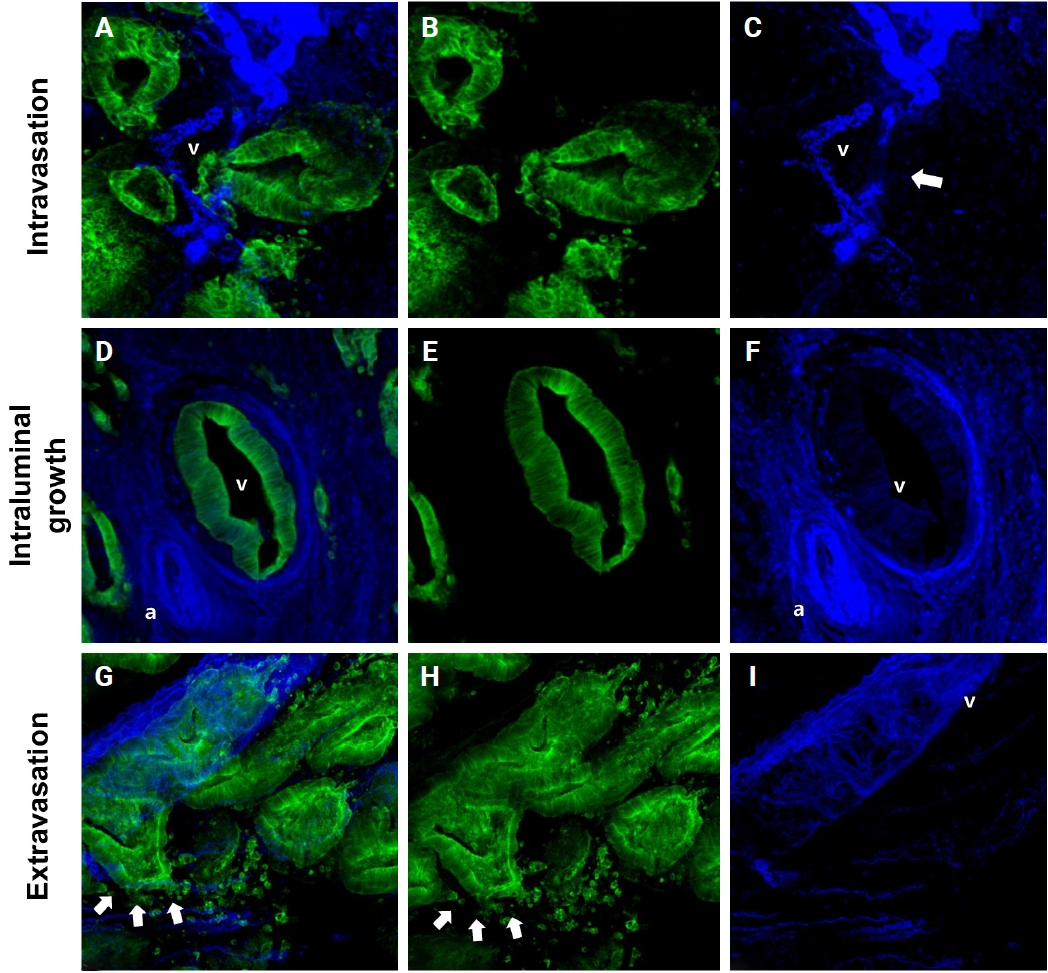
Representative images of the intravasation (A–C), intraluminal growth (D–F), and extravasation (G–I) phases of venous invasion. The multicolor immunofluorescence labeling of colorectal cancer tissue demonstrates the intravasation, intraluminal growth, and extravasation phases of the muscular venous invasion. The green labeling for cytokeratin 19 highlights the cancer cells; the blue labeling for desmin highlights the muscular layer of the muscular vein. (A–C) Intravasation phase; cancer cells (green) are penetrating the walls (arrow) of blood vessels (blue). (D–F) Intraluminal growth phase; cancer cells (green) maintained their tubular shape within the muscular venous wall (blue). (G–I) Extravasation phase, cancer cells (arrows) penetrate out from the walls of the muscular vein. (A, D, G) Merged cytokeratin 19, desmin image. (B, E, H) Cytokeratin 19 single image. (C, F, I) Desmin single image. Arrows indicate destruction of smooth muscle of muscular vein. a, artery; v, vein.
Intravasation was observed in seven of the 27 cases (25.9%) characterized by cancer cells crossing the media of the involved veins. The presence of cancer cells in the media was commonly linked to damage to the smooth muscle layer of the muscular vein, which was indicated by a loss, reduction, or fragmentation of the desmin signal (Fig. 3A–C).
Intraluminal growth was observed in 22 of the 27 cases (81.5%). After entering the veins, cancer cells grow in a tube-like shape along the inner surface and line up next to the inner wall of the veins (Fig. 3D–F). In certain instances, small clusters of fragmented cancer cells appeared protruding from the main tube and subsequently separated into smaller groups or individual cells within the veins.
Of the 27 CRCs with VI, five (18.5%) had foci of extravasation. Although a greater number of extravasation foci were observed compared to intravasation, the difference did not reach statistical significance (p = .377). When cancer cells moved out of the muscle layer of the vein wall, substantial, cohesive aggregates of cancer cells transformed into individual, dispersed cells or small clusters, extending from the lumen beyond the muscular venous wall, suggesting infiltration of the venous wall (Fig. 3G–I).
In addition to identifying each phase separately, we observed the co-occurrence of intravasation and intraluminal growth phases in three cases, and intraluminal growth with extravasation in five cases. All phases of intravasation, intraluminal growth, and extravasation were observed in one case (Fig. 4).
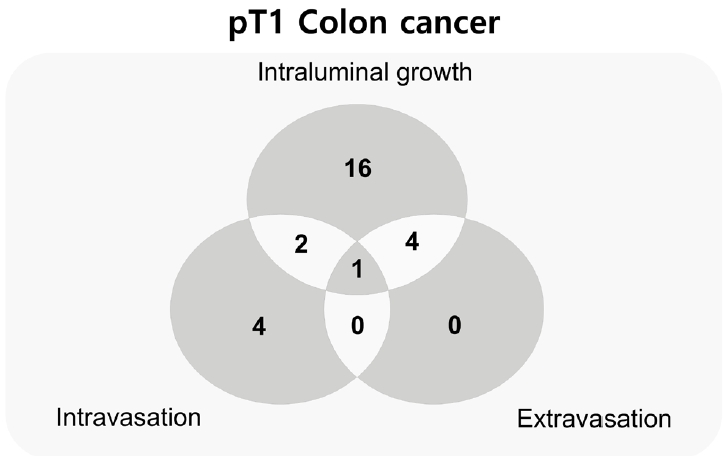
Venn diagram of the number of cases at each phase and mixed phases of muscular venous invasion of pT1 colorectal cancers.
Among the three phases, intraluminal growth occurred at a significantly higher frequency compared to intravasation (p < .001) and extravasation (p < .001) (Fig. 5). While a greater number of intravasation foci were identified relative to extravasation, this difference lacked statistical significance (p = .377). When cancer cells infiltrated through the muscular layer toward the outer side of the veins, they initially organized into cord-like structures before detaching into individual cancer cells or small clusters, following disruption of the muscular layer (extravasation) (Fig. 3G, H).
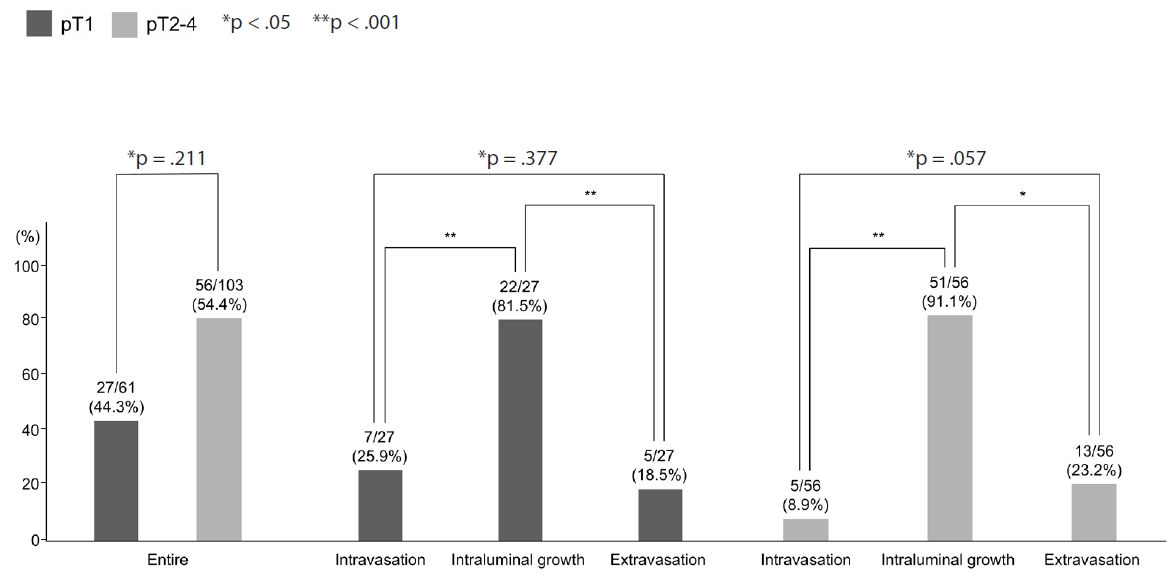
Comparison of each phase of the venous invasion between pT1 and pT2–4 colorectal cancers.
Comparison of VI between pT1 and pT2-T4 CRCs
We compared the prevalence of VI evaluated by 3D between the pT1 CRCs in this study and pT2–4 CRCs in a previous study that used similar techniques [12]. There was no significant difference (p = .258) in the prevalence of VI between pT1 CRCs in this study and pT2–4 CRCs in the previous study [12]. In addition, although there was more intravasation in pT1 CRCs and more extravasation in pT2–4 CRCs, the study found no significant difference in the prevalence of each phase of VI, including intravasation (p = .134), intraluminal growth (p = .186), and extravasation (p = .291) phases between pT1 CRCs in this study and pT2–4 CRCs in the previous study (Fig. 5).
Intraluminal growth was the most predominant phase of VI, occurring more frequently than other phases, such as intravasation and extravasation (p < .05).
Changes in E-cadherin expression throughout the VI process
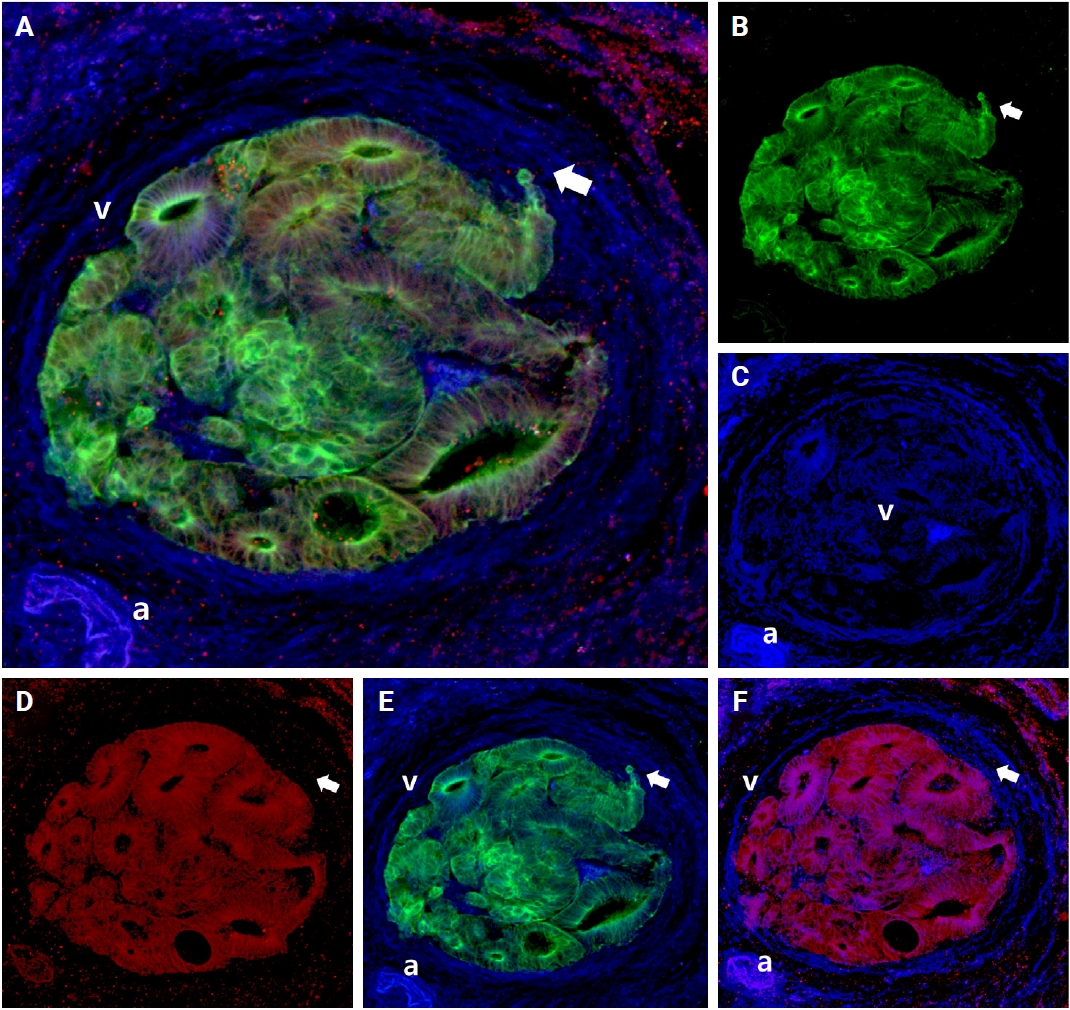
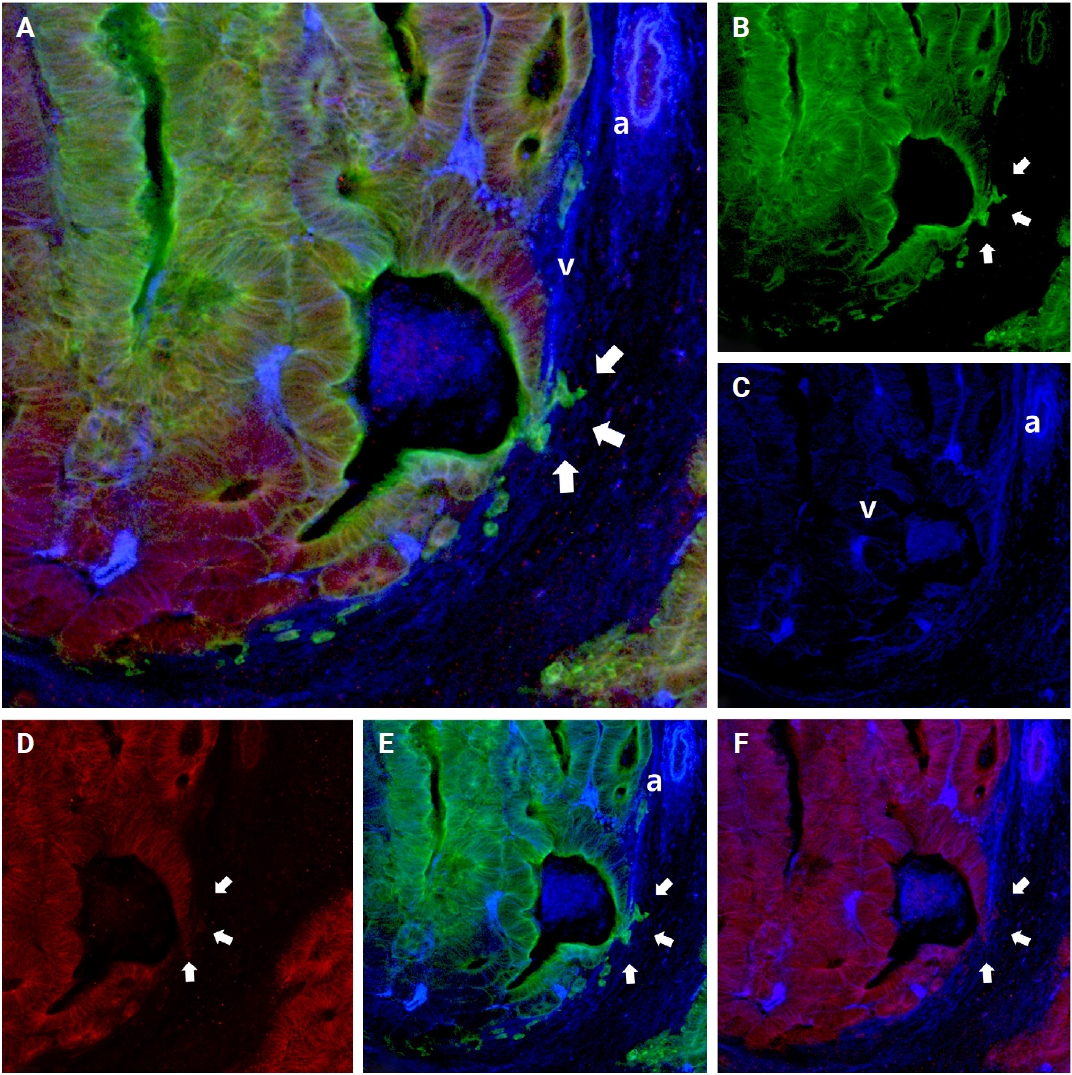
E-cadherin plays an essential role in cellular adhesion, cell-to-cell recognition, and maintenance of epithelial polarity. Loss of E-cadherin expression serves as an important marker for epithelial-to-mesenchymal transition (EMT). E-cadherin expression varied across the phases of VI, with intact E-cadherin expression detected in the cancer cell clusters at the foci of muscular vein wall invasion. However, a tongue-like projection of small clusters (arrows in Fig. 6) within the lumen, originating from the primary cancer cells outside the muscular layer, or isolated cancer cells (arrows in Fig. 6) and small clusters that penetrated the muscular layer within a venous lumen, exhibited loss of E-cadherin expression (intravasation phase) (Fig. 6).
Changes of E-cadherin expression during the intravasation phase. Intact E-cadherin expression was observed in the majority of cancer cell clusters outside the venous wall, but the loss of E-cadherin expression was observed in small numbers of cancer clusters (arrows) at the point of penetration and within the luminal portion of the muscular venous wall. (A) Merged cytokeratin 19, E-cadherin, and desmin image. Green labeling for cytokeratin 19 highlights cancer cells, red labeling indicates E-cadherin, and blue labeling for desmin highlights the muscular layer of muscular veins. (B) Cytokeratin 19 image. (C) Desmin image. (D) E-cadherin image. (E) Cytokeratin 19 and desmin image. (F) E-cadherin and desmin image. a, artery; v, vein.
E-cadherin expressions altered as cancer cells formed tube-like formations and gathered along the inside of the vein wall. In the muscle layer of the vein wall, some cancer cells with tongue-like projections lost E-cadherin expression (intraluminal growth) (arrows in Fig. 7). Likewise, several cancer cells disassociated from the primary tubular structure at the leading edge and exhibited a reduction in E-cadherin expression.
Changes of E-cadherin expression during the intraluminal growth phase. Multicolor immunofluorescence labeling of colorectal cancer tissue showing the intraluminal growth phase of the muscular venous invasion. The majority of cancer cells forming well-oriented tubular structures show E-cadherin expression. However, a few cancer cells with tongue-like projections showed loss of E-cadherin expression (arrow). (A) Merged cytokeratin 19, E-cadherin, and desmin image. Green labeling for cytokeratin 19 highlights cancer cells, red labeling indicates E-cadherin, and blue labeling for desmin highlights the muscular layer of muscular veins. (B) Cytokeratin 19 image. (C) Desmin image. (D) E-cadherin image. (E) Cytokeratin 19 and desmin image. (F) E-cadherin and desmin image. a, artery; v, vein.
When cancer cells left the muscle layer of the venous wall, large, cohesive clusters of cancer cells showed intact E-cadherin staining. Nonetheless, isolated neoplastic cells and small projections within the stroma next to the venous wall demonstrated decreased E-cadherin expression (arrows in Fig. 8).
Changes of E-cadherin expression during the extravasation phase. Multicolor immunofluorescence labeling of colorectal cancer tissue shows that the majority of cancer cells forming well-oriented tubular structures within the venous wall with E-cadherin expression. However, singly scattered cells and smaller numbers of cancer cells with tongue-like projections show a loss of E-cadherin expression (arrows). (A) A 3D reconstruction image of muscular venous invasion with a merged image of cytokeratin 19, E-cadherin, and desmin. Green labeling for cytokeratin 19 highlights cancer cells, red labeling indicates E-cadherin, and blue labeling for desmin highlights the muscular layer of muscular veins. (B) Cytokeratin 19 image. (C) Desmin image. (D) E-cadherin image. (E) Cytokeratin 19 and desmin image. (F) E-cadherin and desmin image. a, artery; v, vein.
DISCUSSION
The present study investigated submucosal VI in pT1 CRCs by 3D image analysis. The high prevalence of VI identified (37.0%) underscores the significance of VI even at this early stage of CRCs and indicates the necessity for a comprehensive evaluation to provide accurate prognostic and therapeutic decision-making. Additionally, the results of the current study align with our previous investigation on pT2–4 CRCs [12], which showed similar phases of tumor spread in both the early and later stages of the CRCs. All three phases of VI, which are intravasation, intraluminal growth, and extravasation, were observed in pT1 CRCs. Mixed phases of VI—intravasation, intraluminal growth, and extravasation—were also observed. The present study shows that extravasation is an important final step in the metastatic process, indicating that even in pT1 CRCs, extravasation can happen, allowing cancer cells to leave the muscular veins and spread out to the surrounding tissues. The extravasation of neoplastic cells within the colon tissue indicates that cancer cells use the muscular vein as one of the routes to spread out, in other words, “intratumoral spreading.”
Furthermore, both pT1 and pT2–4 CRCs exhibit similar patterns of E-cadherin expression changes across the phases of VI. Neoplastic cells that invade the venous wall often lose E-cadherin expression in their projections. Notably, the present observations indicated that E-cadherin was re-expressed when neoplastic cells gained access to the vascular lumen and lined the venous wall on the luminal side, mirroring the behavior observed in pT2–4 CRCs. At the extravasated sites, neoplastic cells often appeared as single dispersed cells or small clusters exhibiting loss of E-cadherin expression. This observation was consistent with the results of the previous study and concluded that E-cadherin expression was continuously changed across VI both in pT1 and pT2–4 CRCs. Based on our observations, we propose a sequence and classification of the phases of muscular VI in pT1 CRC, as illustrated in Fig. 9.
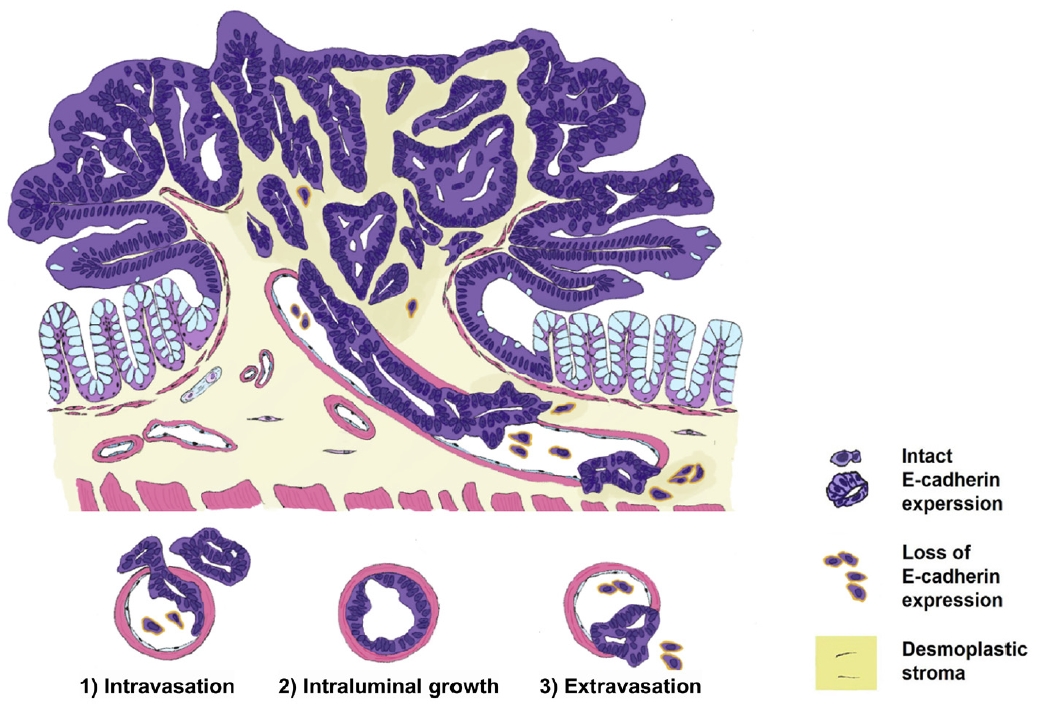
Proposed sequence and phases of muscular venous invasion of pT1 colorectal cancers. The loss and re-expression of E-cadherin were observed in the following 3 phases: (1) intravasation, (2) intraluminal growth, and (3) extravasation.
Applying additional elastic staining detected more foci of VI compared to routine 2D H&E staining used in previous studies [24-26]. For example, Kim and colleagues assessed 418 patients with CRCs in stages I to III, and observed VI in 11% using conventional H&E staining. They noted VI in 35% of the CRC cases with the addition of elastic staining [25]. Similarly, Fei et al. [24] noted that 35% of 277 patients with stage I to IV CRCs had VI with routine H&E staining alone, whereas 56% of patients demonstrated VI when elastic staining was additionally employed [25]. Despite the differing cohorts in previous studies (stages I to III by Kim et al. [25] and stages I to IV by Fei et al. [24]) compared to the present study (pT1), we observed an increased detection of VI with a combination of H&E, elastic, and desmin staining (41%) versus to H&E staining alone (Table 3). The findings of this study, in conjunction with previous research, suggest that additional elastic or desmin staining may identify additional foci of VI that are not discernible with H&E staining alone. The addition of elastic or desmin staining may be beneficial for detecting additional foci of VI when such foci are not clearly discernible on conventional H&E staining. In addition, 3D reconstruction detected more foci of VI, which were not noted by conventional 2D H&E staining nor by additional elastic staining and desmin immunolabeling (Fig. 10). The increased detection of VI in CRCs with 3D evaluation emphasizes its superiority in evaluating the complex architecture of CRCs with the presence of VI.
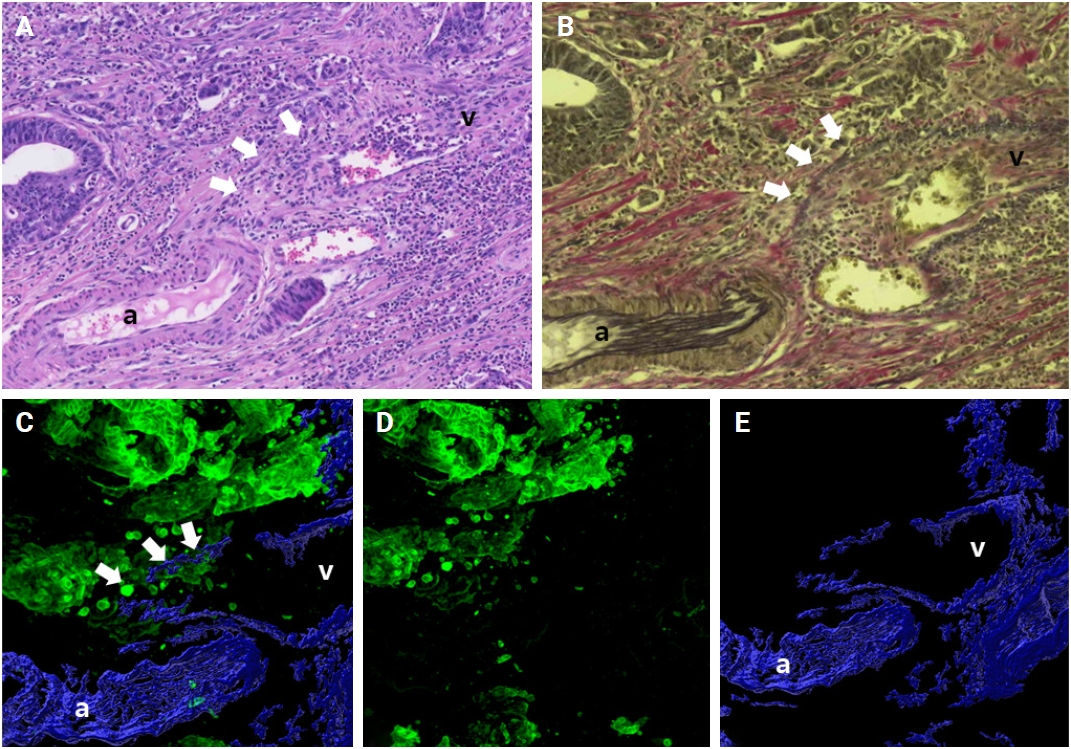
Venous invasion (white arrows) is not detected by conventional 2-dimensional hematoxylin and eosin staining (A) or by additional elastic staining (B), but detected by 3-dimensional reconstruction (C–E). (C) Merged cytokeratin 19 and desmin image. Green labeling for cytokeratin 19 highlights cancer cells and blue labeling for desmin highlights the muscular layer of muscular veins. (D) Cytokeratin 19 image. (E) Desmin image. a, artery; v, vein.
In one cohort of pT1 CRCs specimens analyzed in the present study, nine pT1 CRCs were previously subjected to EMR or ESD, nevertheless, residual tubular adenocarcinomas were observed in all nine resected specimens, and a significant incidence of VI was also identified. Based on the clinical protocols for managing pT1 CRCs, EMR or ESD of pT1 CRCs containing high-risk histopathologic features, such as CRCs with poor differentiation, presence of lymphovascular invasion, high tumor budding, and resection marginal involvement, necessitates further surgical resections [27,28]. The high prevalence of muscular VI observed in the present study may indicate an increased possibility of distant metastasis of CRCs. During the follow-up period, we observed lung metastasis in one case. VI was detected on the 3D reconstruction and additional elastic and desmin staining evaluation, but not on conventional H&E slide evaluation.
In recent years, the examination of VI in CRCs has attracted considerable interest, especially regarding its effects on disease progression and patient outcomes. Table 5 summarizes that several prior studies have shown varying prevalence of VI, exhibiting significant discrepancies in recurrence rates and diagnostic criteria. The previous studies indicated up to 20% of VI in pT1 CRCs [29-31]. The incidence of VI detected by 2D H&E staining in the present study was 26.5% (9/34), which is comparable to the previous studies. The incidence of VI was higher when assessed using surgical resection specimens compared to EMR or ESD specimens in the previous study. These data may suggest varying inclusion criteria for the high risk of recurrence in surgical resection specimens.
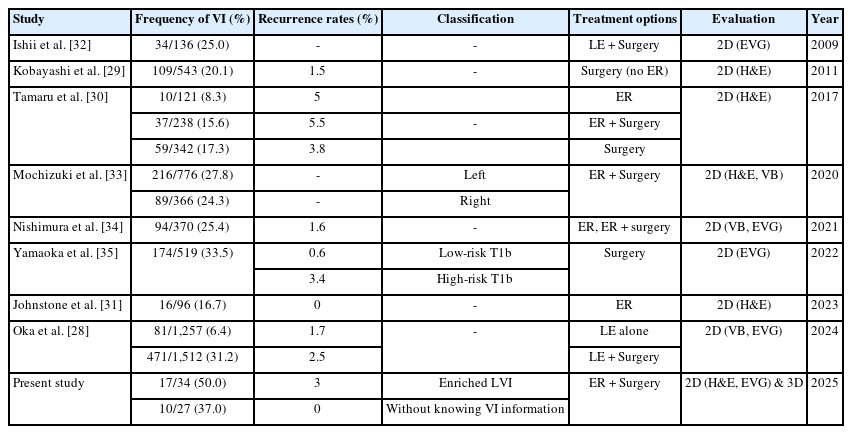
Frequency of VI of pT1 colorectal cancers in the previous studies
Using additional elastic staining methods, such as Victoria Blue and Elastica van Gieson staining, has been shown to improve the detection rate of VI from 25% to 34% [32-35]. The rate of VI with additional elastic and desmin staining in the present study was 41.2% (14/34), slightly higher than in previous studies. Consistent with the previous studies, additional elastic staining revealed a higher number of VI foci in the assessment of pT1 CRCs compared to H&E alone.
To the best of our knowledge, this is the first study to investigate VI in pT1 CRCs using 3D pathologic evaluation. About half of the surgically resected pT1 CRCs contained VI. These findings highlight how important 3D histopathological reconstruction is for better understanding the structure of CRC and VI. The absence of 3D evaluations in earlier studies has under-evaluated VI in pT1 CRCs. Identifying muscular VI is important for the treatment of patients with CRCs before distant metastasis occurs. Some previous studies evaluated the metastatic rate of endoscopically or surgically resected pT1 CRCs, which ranged from 0.6% to 3% [28-31,34,35]. Distant lung metastasis was observed in one of the 34 cases (2.9%) with VI in pT1 CRCs in the present study, and these results align with those of the previous studies [28-31,34,35].
Despite providing valuable insights, this study has several limitations that should be acknowledged. First, the relatively small sample size of the cohort may have limited the statistical power of the study, potentially impacting the generalizability of the findings, as pT1 CRCs not so frequently require surgical intervention. Second, though various markers of EMT—such as ZEB1, ZEB2, TWIST1, vimentin, and N-cadherin—have been identified, this study focused solely on E-cadherin immunolabeling. This was necessitated by the constraint of using up to four antibodies simultaneously in 3D reconstruction. Future investigations incorporating E-cadherin together with additional EMT markers may enhance our understanding and further validate our conclusions. Furthermore, the proposed 3D-based VI detection approach was designed primarily for research purposes to explore its feasibility and potential value. Although the method demonstrated promising performance for detecting more foci of VI, the clinical application of 3D visualization is currently impractical due to the long experiment time of about 2 weeks for the experimental procedure. Developing the advanced 3D visualization with reduced experiment time of tissue clearing in the future may make this technique applicable for clinical diagnosis.
In conclusion, this study highlights the importance of 3D histopathological reconstruction for identifying VI in pT1 CRCs, showing that about 37% of pT1 CRCs have VI. All three phases of VI—intravasation, intraluminal growth, and extravasation—were detected. Notably, loss followed by re-expression of E-cadherin was frequently observed across the phases of VI, suggesting that EMT is not continuously maintained in the process of VI in pT1 CRCs. The present study also suggests that VI may serve as a pathway for intratumoral spreading in a subset of pT1 CRCs, which offers new insights into disease management and prognosis in patients with pT1 CRCs.
Notes
Ethics Statement
Institutional Review Board approval with a waiver of patient consent was obtained (approval number: 2023-1417). The biospecimen and data used in this study was provided Asan Bio-Resource Center, the institutional biobank, a member of the Korea Biobank Network (approval number: 2023-24[275]).
Availability of Data and Material
The datasets generated or analyzed during the study are available from the corresponding author on reasonable request.
Code Availability
Not applicable.
Author Contributions
Conceptualization: JP, RH, SH. Formal analysis: JP, SH. Investigation: JP, MK, YK, BL, JS, JS. Funding acquisition: SH. Methodology: JP, RH, SH. Software: JP. Supervision: RH, SH. Writing—original draft: JP, SH. Writing—review & editing: JP, DY, CP, JK, RH, SH. Approval of final manuscript: all authors.
Conflicts of Interest
The authors declare that they have no potential conflicts of interest.
Funding Statement
This work was supported by the National Research Foundation of Korea (NRF) grant funded by the Korea goverment (MSIT) (No. RS-2023-NR077117) to SH.
Acknowledgments
This work was presented, in part, at the annual meeting of the Korean Society of Pathologists 2024, Seoul, Republic of Korea, October 31, 2024.
The biospecimen and data used in this study were were partly provided by the Asan Bio-Resource Center, Korea Biobank Network, which is supported by the National Institute of Health (NIH) research project: 2023-24 (275).