Progastrin, annexin A2, and tumor-associated macrophages in gastric adenocarcinoma
Article information

Abstract
Background
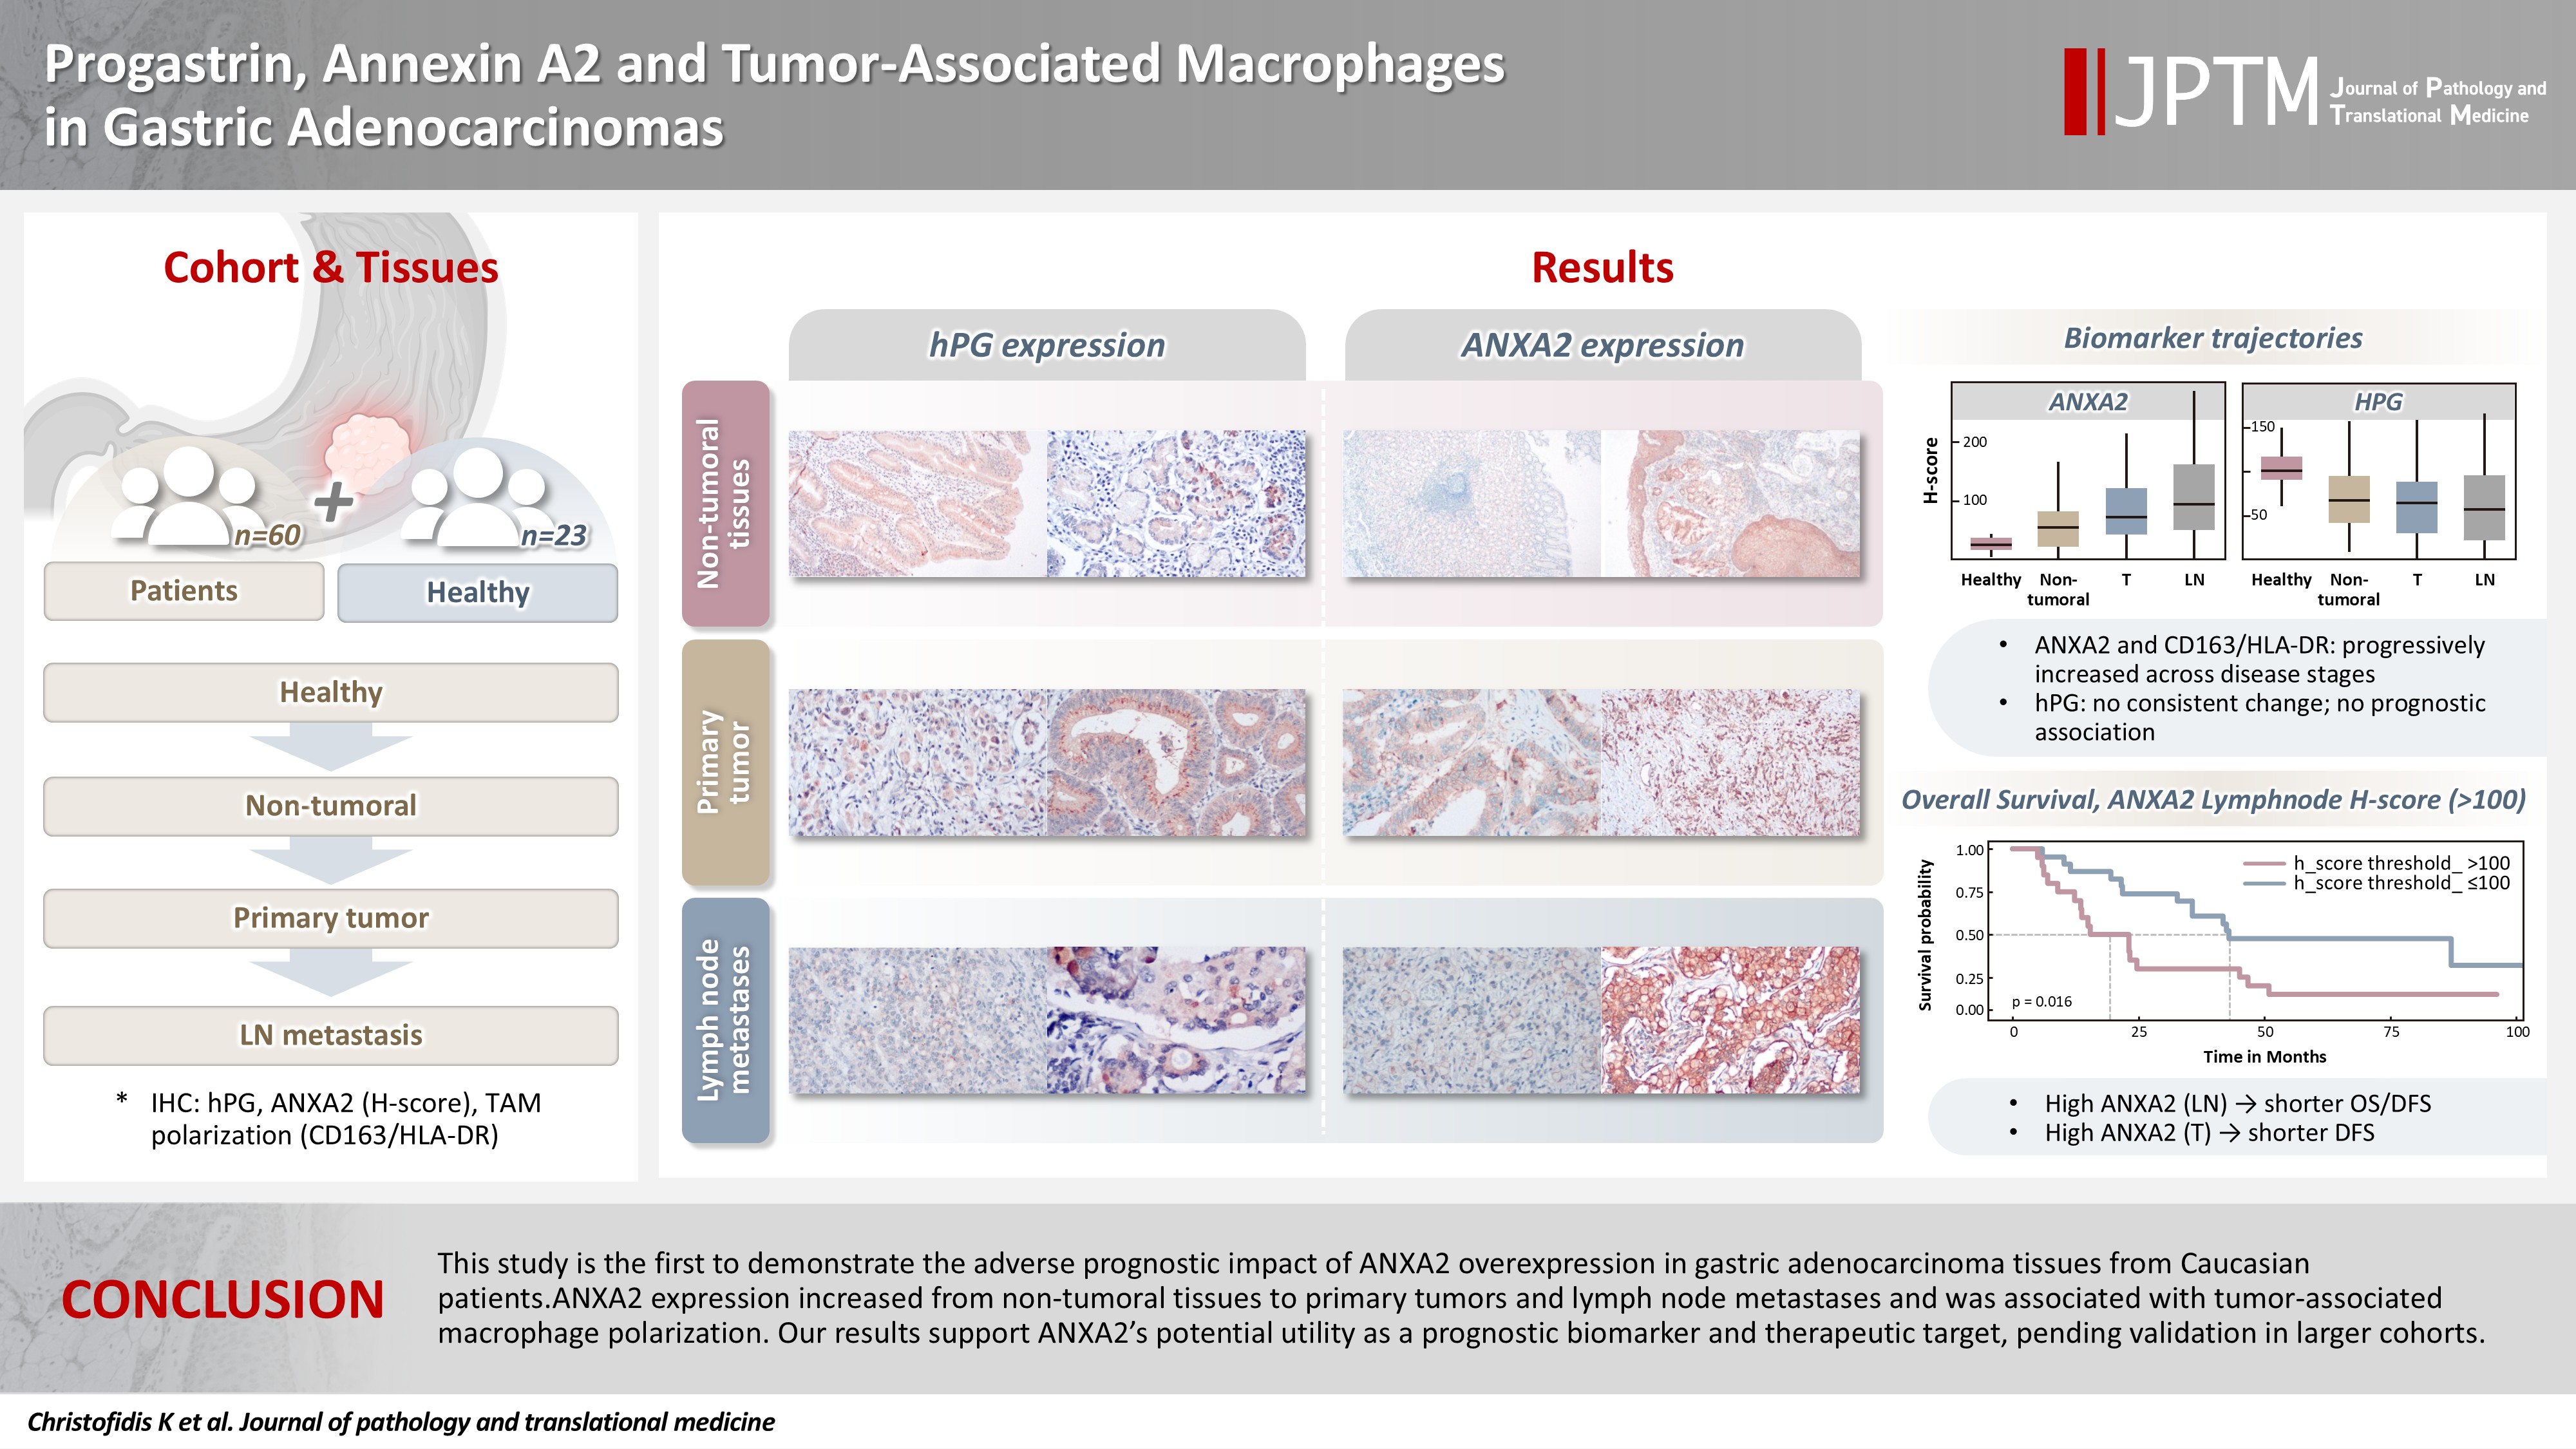
Gastric adenocarcinoma is a major cause of cancer mortality worldwide, and reliable biomarkers remain insufficient. This study investigates the immunohistochemical expression of progastrin (hPG) and annexin A2 (ANXA2) and the polarization of tumor-associated macrophages in gastric adenocarcinoma to explore their potential prognostic and biological significance.
Methods
A retrospective analysis was conducted on formalin-fixed, paraffin-embedded tissue samples from 60 patients with gastric adenocarcinoma (primary tumors, lymph node metastases, and non-tumoral gastric mucosa) and gastric biopsies from 23 healthy controls. The expression of hPG and ANXA2 was quantified using the H-score, and the CD163/human leukocyte antigen–DR (HLA-DR) ratio was used to represent macrophage polarization (M2/M1). Statistical analyses included non-parametric tests, Spearman correlations, Kaplan-Meier survival curves, and Cox proportional-hazards models.
Results
ANXA2 expression was significantly elevated in cancer cells from primary tumors and lymph node metastases, compared with the non-tumoral gastric mucosa tissues and gastric mucosa tissues from healthy controls. ANXA2 expression increased with the tumor grade. High ANXA2 levels were associated with shorter overall and disease-free survival, but they did not have independent prognostic value. Although hPG expression correlated positively with ANXA2, it showed no significant prognostic association. The CD163/HLA-DR ratio increased with tumor progression and negatively correlated with ANXA2, but it did not influence survival outcomes.
Conclusions
This study is the first to demonstrate the adverse prognostic impact of ANXA2 overexpression in gastric adenocarcinoma tissues from Caucasian patients. Our results suggest that ANXA2 might have utility as a prognostic biomarker and therapeutic target, if further large-scale studies validate and expand our findings.
INTRODUCTION
Gastric cancer is the fifth most common cancer globally, with 968,350 new cases and 659,853 deaths annually. Its incidence rises with age, with an average age at diagnosis of 70 years. Gastric cancer is anatomically classified into cardia and non-cardia subtypes. Chronic Helicobacter pylori infection is the main cause of 90% of non-cardia gastric cancers, and additional risk factors include diet, alcohol, smoking, and Epstein-Barr virus infection. H. pylori eradication treatments, as well as improved nutrition and hygiene, have led to a decline in non-cardia gastric cancer incidence. Cardia cancers are less associated with H. pylori (20%) and often linked to obesity and gastroesophageal reflux. Their incidence tends to be high in a younger population than non-cardia gastric cancers [1-3]. A family history, particularly of hereditary diffuse gastric cancer caused by mutations in the cadherin 1 gene, accounts for less than 10% of cases [4,5].
Gastric adenocarcinomas are histologically classified according to the WHO 2019 guidelines into tubular, poorly cohesive (including signet-ring cell carcinoma), and mixed adenocarcinomas. Rare subtypes include the papillary, mucinous, hepatoid, micropapillary and fundic-gland type adenocarcinomas, carcinoma with lymphoid stroma, and mucoepidermoid, Paneth cell, and parietal cell carcinomas [6]. Despite progress in medicine, gastric adenocarcinoma still lacks early detection methods, sensitive biomarkers, and effective therapies [7,8].
Progastrin (hPG), an 80-amino-acid precursor of amidated gastrin, is synthesized in gastric antral G cells [9,10]. Normally, non-amidated gastrin makes up <10% of secreted peptide forms. Elevated levels are seen in some pathological states, including cancer [11,12], due to GAST gene overexpression on chromosome 17q21 [11,13,14] and deficient processing enzymes in tumors [15-17]. hPG has been shown to promote cancer cell proliferation [18], resistance to apoptosis [19], and disruption of cell junctions [20] and support cancer stem cell properties [18,21] and angiogenesis [22]. It also suppresses M2 macrophage polarization and Wnt ligand secretion [23]. hPG acts via multiple pathways, including Wnt/β-catenin, KRAS, MEK-ERK, phosphoinositide 3-kinase/Akt, nuclear factor кB, and SMAD4 [24], and it is found in tumor cells and stroma [25]. Increased hPG levels have been found in patient samples from 11 different types of cancer, suggesting that it might have value as a biomarker [11]. Most studies have examined serum hPG levels [26–36]; only a few have researched its expression in tumor tissues [37-40]. Little research to date has examined the role of hPG in gastric adenocarcinomas, and what has been done has mainly used cell lines and mouse models [41-43]. The receptors for hPG are still unidentified, though annexin A2 (ANXA2) is a proposed candidate [44,45].
ANXA2 is a 36-kDa phospholipid-binding protein encoded on chromosome 15q22.2 [46-48]. It regulates multiple cellular functions and is implicated in tumorigenesis through pathways involving c-Myc, STAT3, SNAIL, TWIST, ARP3, MIEN1, LIMK, and CFL1 [49]. ANXA2 also seems to be critical for hPG’s oncogenic action, at least in colon cancer cells [45,50]. ANXA2 is overexpressed in gastric cancer and localized mainly at tumor cell membranes, where it promotes the destabilization of epithelial junctions and increases the secretion of matrix metalloproteinases, thereby enhancing invasion and metastasis [51-55]. ANXA2 is also linked to c-erbB-2 overexpression and poor patient outcomes [56]. Silencing ANXA2 can reduce tumor proliferation, reverse chemoresistance, and limit metastasis, underscoring its therapeutic relevance [57-60].
Tumor-associated macrophages (TAMs) are a critical component of the tumor microenvironment. Upon activation, macrophages polarize into multiple phenotypes with distinct roles. Activated macrophages are categorized as the M1 phenotype, which induces inflammation and shows microbicidal and tumor suppressive activity, and the M2 phenotype, which has immunoregulatory activity that contributes to both tissue healing and cancer development. Many more phenotypes exist between those two ends of the spectrum. M1 markers include human leukocyte antigen–DR (HLA-DR), CD86, inducible nitric oxide synthase, and pSTAT1, and M2 markers include CD163, CD204, and CD206 [61]. M1 polarization is induced by Toll-like receptor ligands, tumor necrosis factor α, interferon-α, and colony-stimulating factor 2. On the other hand, interleukin (IL) 4, IL10, IL13, transforming growth factor β (TGF-β), and prostaglandin E2 promote M2 differentiation [62]. A high M2/M1 TAM ratio is associated with worse prognosis in several cancers [63], including gastric cancer [64–68], and has been linked to some aspects of gastric adenocarcinoma oncogenesis [69-71]. As previously mentioned, hPG has been reported to suppress the differentiation of TAMs toward the M2 phenotype and reduce their expression of Wnt ligands [23]. It is also interesting that ANXA2 is expressed on the surfaces of macrophages, where it serves as a recognition element and mediates their activation [72].
In this study, we investigate the immunohistochemical expression of hPG and ANXA2 and the phenotypes of TAMs in gastric adenocarcinoma patients, with the hope of revealing possible interplay among them and any associations with prognostic factors and thus shed light on gastric cancer tumorigenesis and potentially propose new biomarkers.
MATERIALS AND METHODS
Patients and tissue samples
This retrospective study was carried out on gastrectomy specimens from 60 patients who underwent surgery for gastric adenocarcinomas at the First Department of Surgery of Laiko University Hospital, National and Kapodistrian University of Athens (NKUA), between 2014 and 2020. Clinical and pathological data, including demographics, surgical procedures, TNM classification, pre- and postoperative therapy, and follow-up information (recurrence, disease-free, and overall survival [OS]) were prospectively recorded. Selected clinicopathological characteristics are summarized in Table 1.
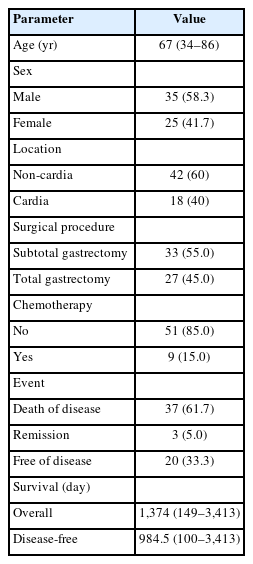
Epidemiological and clinical characteristics of the patients
Formalin-fixed, paraffin-embedded tissue samples from those patients were retrieved from the archives of the Pathology Department of the same hospital. Sections from the primary gastric adenocarcinoma and any lymph node metastases were studied. Two control groups were included: non-tumoral gastric mucosa adjacent to the carcinomas derived from the same patients’ surgical specimens and lesional-free gastric biopsies from 23 healthy, age- and sex-matched subjects without any history of gastric cancer. All cases were anonymized, with each sample assigned an alphanumeric code to protect the identity of the individuals. Permission for this scientific use of patient data was obtained from the Research Ethics and Deontology Committee, NKUA (492/18-07-2022). Individual consent was waived because the study was retrospective.
Immunohistochemical staining and evaluation
Immunohistochemistry (IHC) was performed according to standard procedures on 3–4 µm-thick tissue sections, which were stained with commercially available rabbit monoclonal IgG antibodies against HLA-DR (clone EP96 at 1:200 dilution, Bio SB, Santa Barbara, CA, USA), CD163 (clone D6U1J at 1:250–1:1,000 dilution, Cell Signaling Technology, Inc., Danvers, MA, USA), and ANXA2 (clone D11G2 at 1:200–1:800 dilution, Cell Signaling Technology, Inc.). No hPG antibodies are commercially available. A rabbit polyclonal antibody (1137 at 1:1,000 dilution) was kindly provided by Professor Arthur Shulkes and his research team at the University of Melbourne, Victoria, Australia.
An IHC evaluation to assess the expression of hPG, ANXA2, CD163, and HLA-DR at the protein level was performed by two surgical pathologists (K.C. and S.S.) who were blinded to clinicopathological information. The evaluation was performed by both pathologists simultaneously using a double-headed-microscope. At least 10 high-power fields (HPFs) were scanned for each IHC stain in every case. The scoring system for hPG (cytoplasmic staining) (Fig. 1) and ANXA2 (membranous staining) (Fig. 2) was set based on the percentage (0%–100%) of stained epithelial cells (gastric adenocarcinoma cells in neoplastic tissues and normal gastric mucosa epithelial cells in the controls) and the intensity of the immunostain (0, no staining; 1, weak; 2, moderate; 3, strong). We calculated the H-scores for these two stains using the following formula:
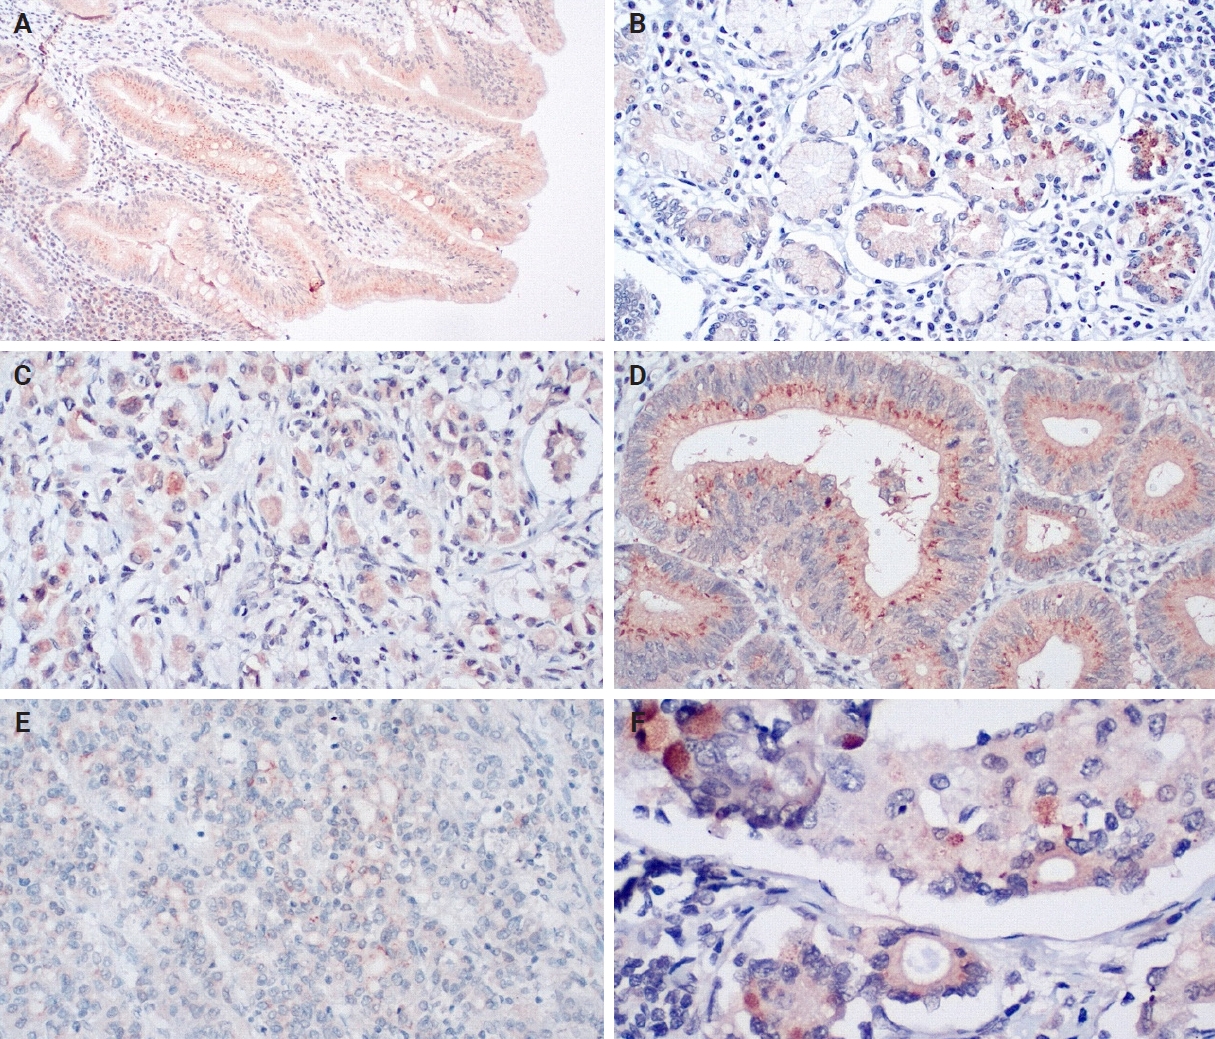
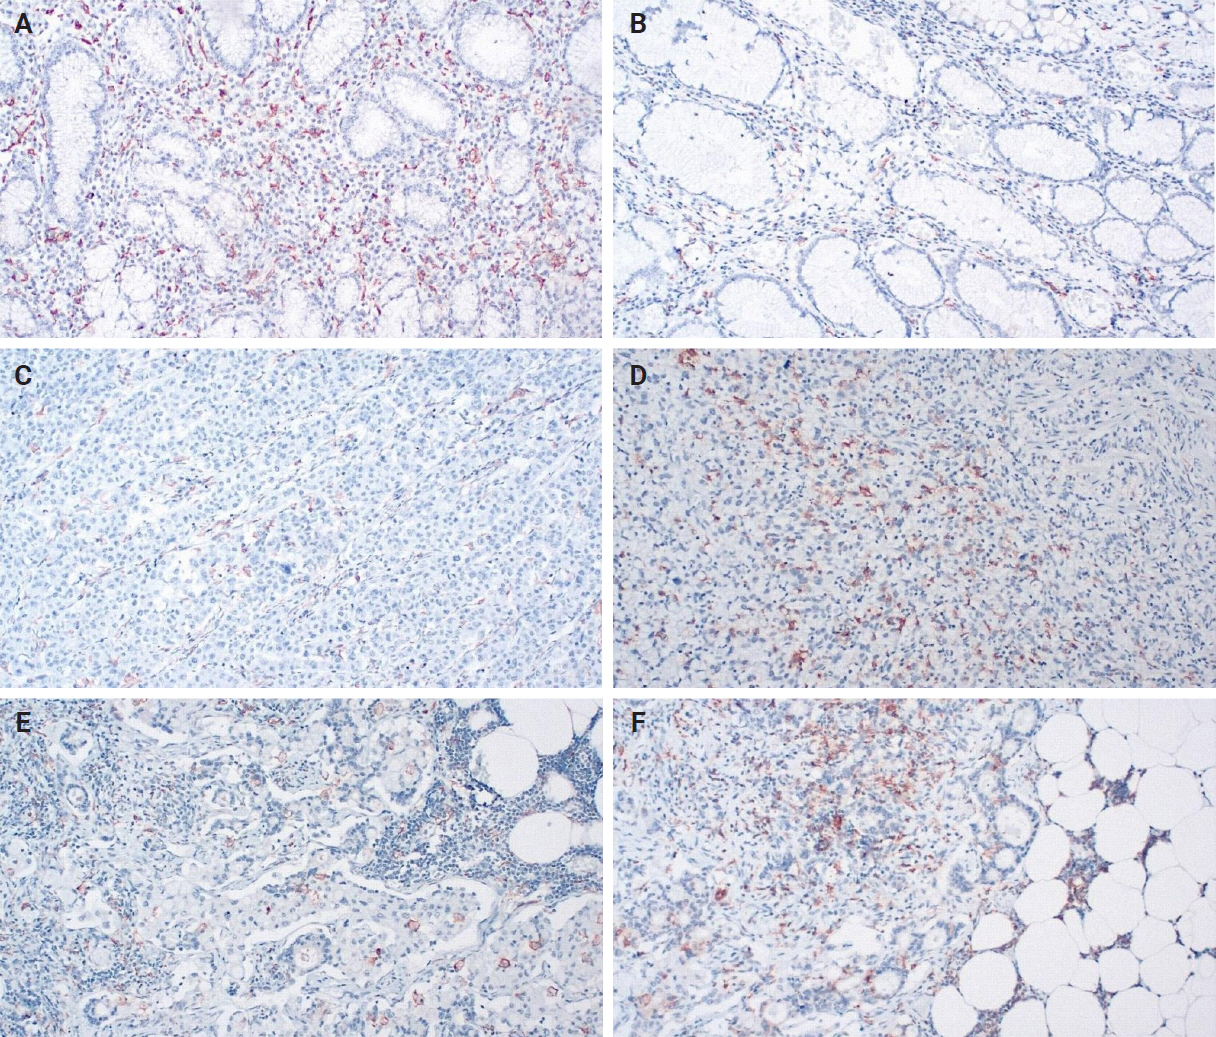
Progastrin expression in non-tumoral tissues (A, B, moderate and strong expression), primary tumor tissues (C, D, weak and strong expression), and lymph node metastases (E, F, moderate and strong expression). Note the variety and heterogeneity of staining intensity, even among similar-looking cells from the same area.
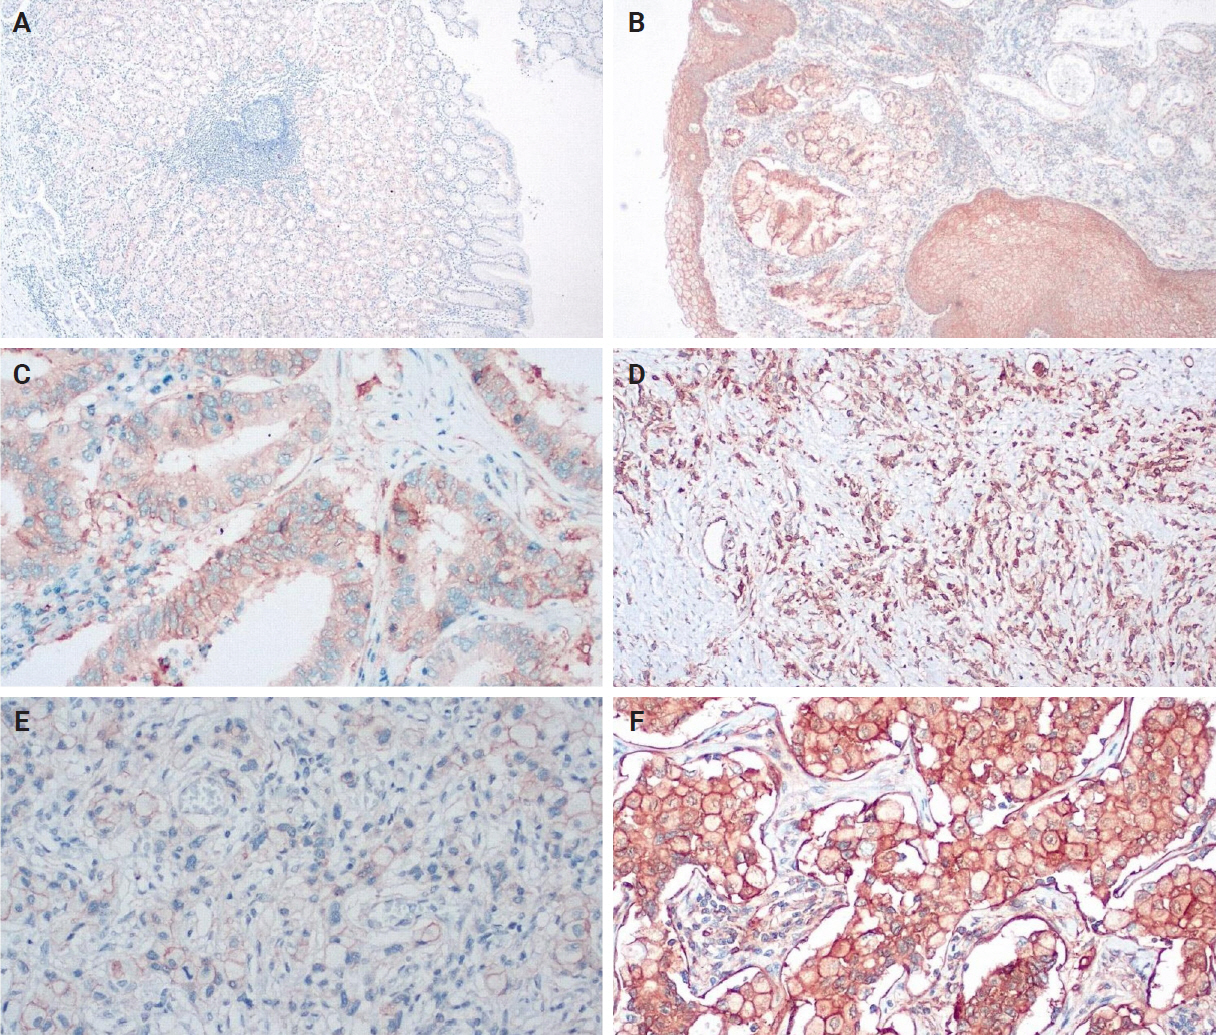
Annexin A2 expression in non-tumoral tissues (A, B, weak and strong expression), primary tumor tissues (C, D, moderate and strong expression), and lymph node metastases (E, F, weak and strong expression).
H-score = 1 × (% cells with weak staining) + 2 × (% cells with moderate staining) + 3 × (% cells with strong staining)
H-score values can range from 0 to 300. Based on the distribution of values, an H-score threshold of 100 was applied to compare survival groups. H-scores < 100 signify low expression, and H-scores ≥ 100 signify high expression for these stains.
When evaluating CD163 and HLA-DR, the total number of positive macrophages per 10 HPFs was calculated for each immunostain (Fig. 3). The ratio of CD163/HLA-DR was assessed, with values greater than 1 signifying a predominance of M2 macrophages over M1 macrophages.
Human leukocyte antigen–DR (A, C, E) and CD163 expression (B, D, F) in non-tumoral tissues (A, B), primary tumor tissues (C, D), and lymph node metastases (E, F).
Statistical analysis
All statistical analyses were performed using R version 4.1.2 (2021-11-01; R Foundation for Statistical Computing, Vienna, Austria). Data are expressed as frequencies, means with standard deviations, or medians with interquartile ranges, as appropriate. Quantitative variables were compared with Student’s t test or the Mann-Whitney test for normally distributed and non-normally distributed variables, respectively. Qualitative variables were compared with the chi-squared test or Fisher’s exact test, as appropriate. Relationships between parameters were assessed using Spearman’s correlation coefficients.
To investigate IHC expression differences, we applied a non-parametric Wilcoxon test for paired samples, when dealing with samples from the same patient, or a non-parametric Wilcoxon test for unpaired samples, when the samples came from different patients. Correlations among the expressions of hPG and ANXA2 and the CD163/HLA-DR ratio in tumor or lymph node metastasis tissue were investigated by Spearman’s rank correlation coefficients (ρ). A p-value was calculated to determine statistical significance. Relationships between the expression of hPG and ANXA2 and the CD163/HLA-DR ratio and patients’ clinicopathological parameters (T, N, stage, grade, and histological subtype) were assessed using a Kruskal-Wallis ANOVA. The Dunn test was used to assess the ability of the Kruskal-Wallis ANOVA to differentiate among subgroups.
To investigate the different projected outcomes for OS and disease-free survival (DFS) according to the expressions of hPG and ANXA2 and the CD163/HLA-DR ratio in tumor and lymph node metastasis tissues, survival curves were estimated using the Kaplan-Meier method, and differences between groups were compared using the log-rank test to obtain a p-value. Cox proportional hazards analyses were performed to evaluate whether ANXA2 expression, dichotomized with an H-score threshold of 100, was associated with patient DFS and OS in both the primary tumors and lymph-node metastases. For each of these cases, a univariable model (ANXA2 alone) and a multivariable model (adjusted for sex, age, tumor histological subtype, location, grade, and stage) were compared using likelihood-ratio tests (LRTs) to evaluate the independent prognostic value of ANXA2. All p-values <0.05 were considered statistically significant.
RESULTS
Our IHC evaluation of hPG, ANXA2, CD163, and HLA-DR expression was feasible in all of the tumoral (primary gastric tumors [T] and lymph node metastases [LN]) and normal-looking tissues (non-tumoral gastric tissues from the same patients [non-tumoral] and healthy controls [healthy]). The staining pattern for hPG was cytoplasmic, indicative of the protein location. The H-scores ranged as follows: 0–159 in T samples, 0–166 in LN samples, 8–157 in patients’ non-tumoral tissues, and 35–160 in the healthy controls. The staining pattern for ANXA2 was membranous, supportive of its role as a receptor. The H-scores ranged as follows: 0–242 in T samples, 0–285 in LN samples, 3–166 in patients’ non-tumoral tissues, and 5–107 in the healthy controls. The CD163/HLA-DR ratio ranged as follows: 0.074–6.952 in T samples, 0.150–4.267 in LN samples, 0.195–3.310 in patients’ non-tumoral tissues, and 0.116–1.055 in the healthy controls. Summary distributions of the hPG, ANXA2, and CD163/HLA-DR values in the various tissues examined are depicted in Supplementary Table S1.
Both ANXA2 and the CD163/HLA-DR ratio seem to rise from healthy to non-tumoral to T tissue to LN metastases, whereas hPG expression decreases (Fig. 4). The p-values in the figure indicate whether the corresponding pairs differ significantly (Supplementary Table S2), as will be explained in the next section.
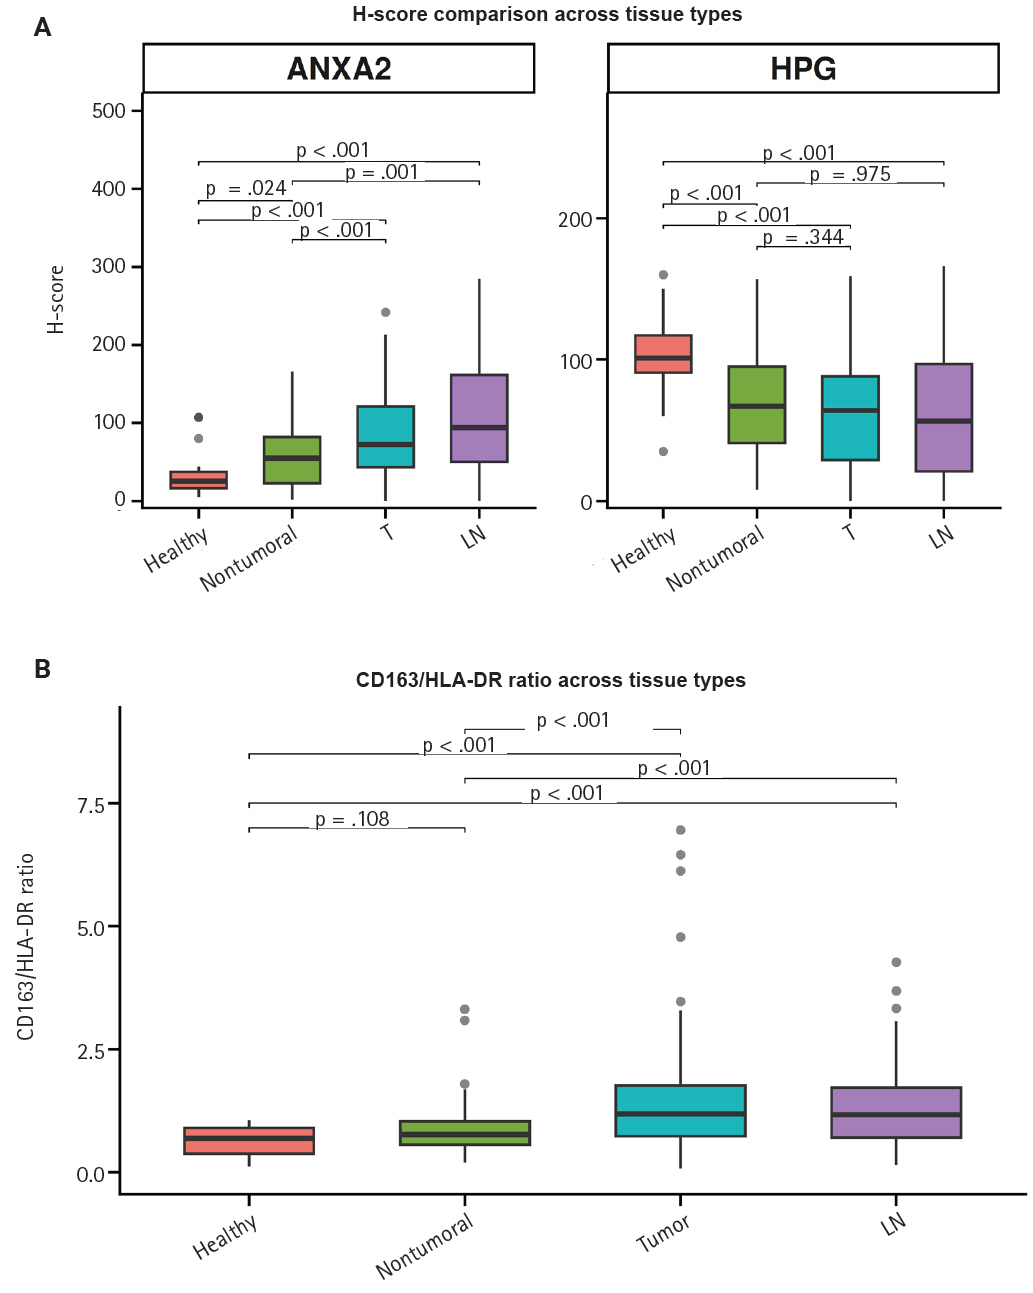
Comparison of the progastrin (hPG) and annexin A2 (ANXA2) H-scores (A) and the CD163/human leukocyte antigen–DR (HLA-DR) ratio (B) values in gastric mucosa from healthy controls (healthy), patients’ non-tumoral gastric mucosa (non-tumoral), primary tumors (T), and lymph node metastases (LN). The p-values over the brackets indicate whether the corresponding pairs differ significantly.
Differential expression of hPG, ANXA2, and CD163/HLA-DR
As hinted by the summary distributions, the expressions of hPG and ANXA2 and the CD163/HLA-DR ratio differ between tumoral (T and LN) and healthy-looking tissues (non-tumoral and healthy). We continued our analysis by researching the statistical importance of the expression differences. All of our tests showed statistically significant differential expression (p < .001), except for the one between hPG (T) or hPG (LN) and non-tumoral gastric tissues from the same gastrectomy specimen (p = .344 and p = .957, respectively).
We further tested the markers’ differential expression between the two kinds of control tissues (non-tumoral and healthy). Those tests also highlighted statistically important differential expression (p < .001 and p = .024), except for the one comparing the CD163/HLA-DR ratio between the two types of control tissues (p = .108). These results are summarized in Supplementary Table S2.
Correlations among hPG and ANXA2 expression and the CD163/HLA-DR
We noticed that the expressions of hPG and ANXA2 and the CD163/HLA-DR ratio in the primary tumors are linked to each marker’s value in the corresponding LN metastasis. More precisely, the values show a statistically significant (p < .001) positive correlation (rho = 0.597 and rho = 0.617), indicating that higher expression in the primary tumor correlates with higher expression in the LN metastasis. These expression correlations are summarized in Supplementary Table S3 and depicted in a scatterplot in Fig. 5 to visualize their direction and magnitude.
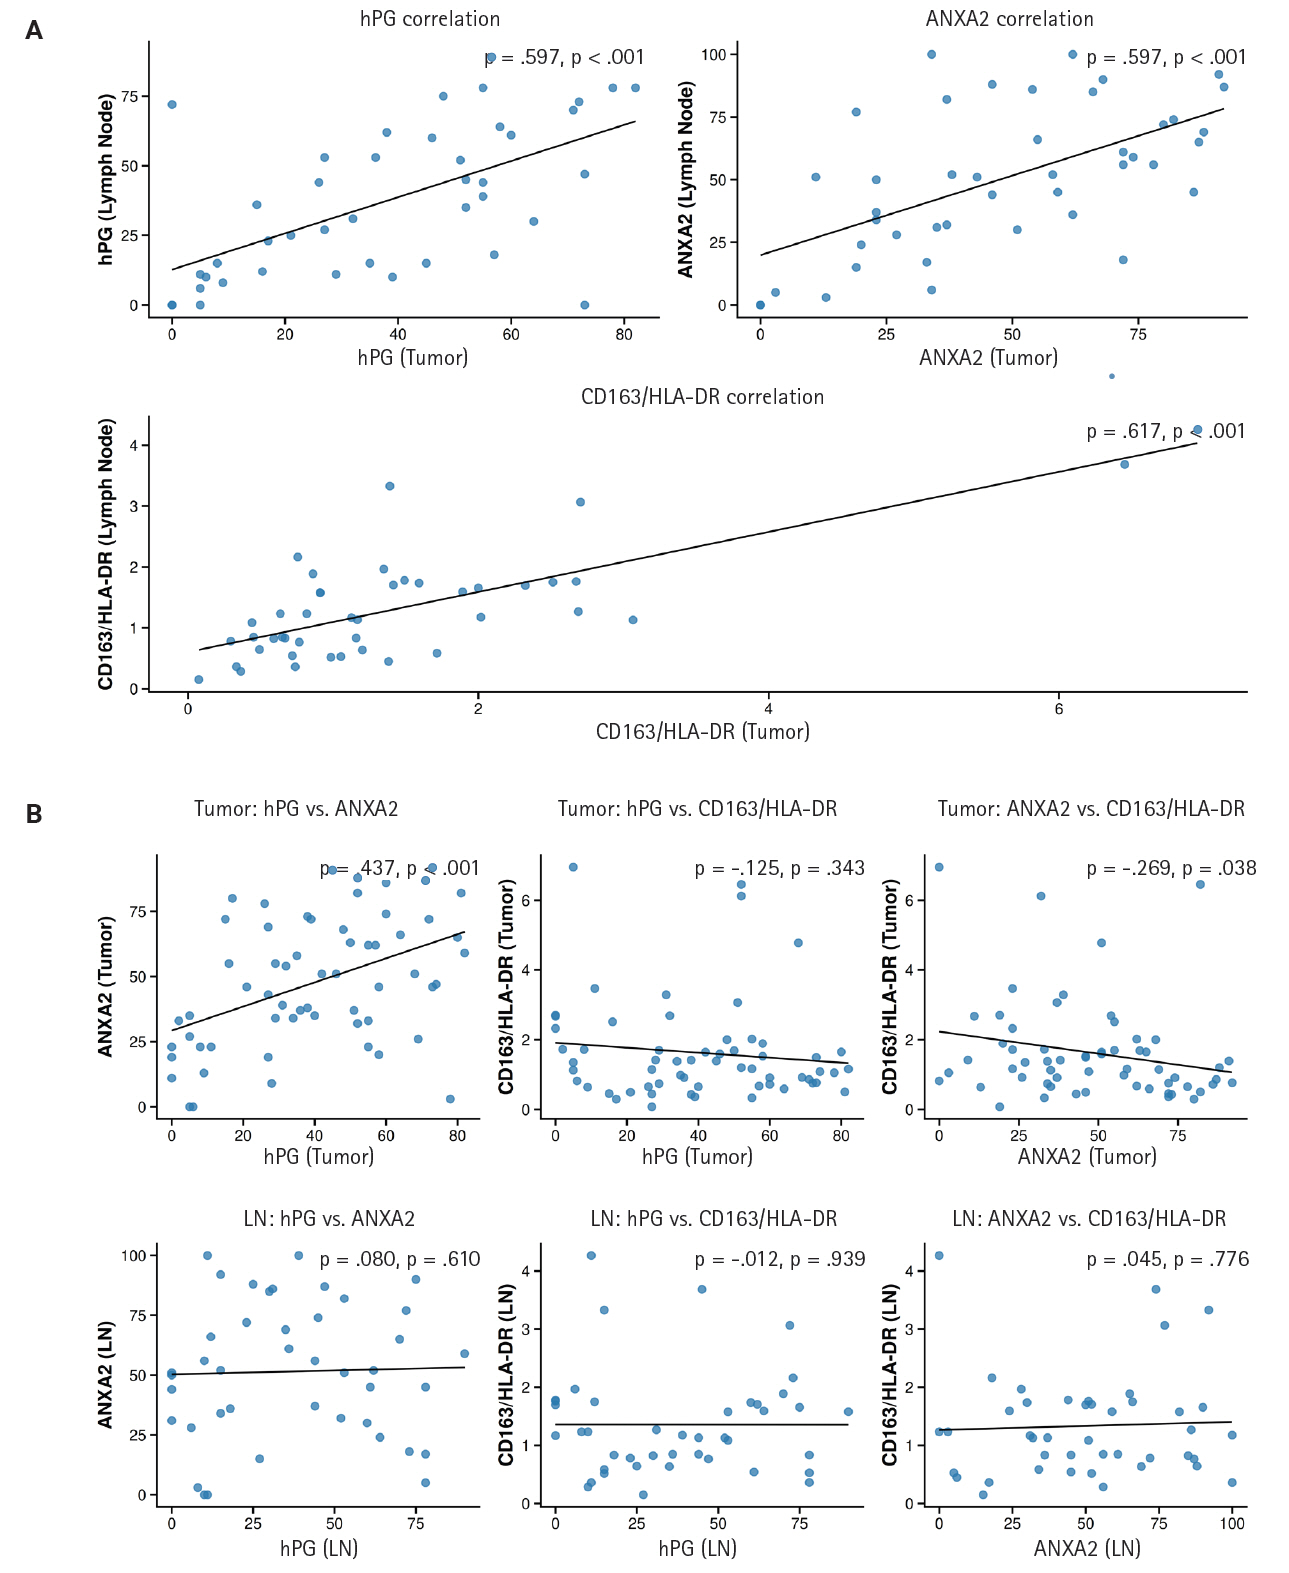
(A) Correlations among progastrin (hPG) and annexin A2 (ANXA2) expression and the CD163/human leukocyte antigen–DR (HLA-DR) ratio in primary tumors (y-axis) versus lymph node metastases (x-axis). All the correlations depicted are statistically significant and positive. (B) Correlations among hPG and ANXA2 expression, hPG and the CD163/HLA-DR ratio, and ANXA2 and the CD163/HLA-DR ratio in primary tumors and lymph node metastases (LN). Notice the statistically significant positive correlation between ANXA2 and hPG expression and the negative correlation between ANXA2 expression and the CD163/HLA-DR ratio in primary tumor tissues. In the upper right corner of each subplot of the scatterplot is the rho (ρ) value, which indicates the direction and magnitude of each correlation, and the p-value, which represents the significance of the correlation.
We also investigated the correlations among the different markers’ expressions in both the primary tumors and LN metastases. A statistically significant (p < .001) positive correlation (rho = 0.437) between ANXA2 and hPG expression and a statistically significant (p = .038) negative correlation (rho = –0.269) between ANXA2 expression and the CD163/HLA-DR ratio were observed in the primary tumor tissues. No other expression correlation came to light in the rest of the tests performed. Supplementary Table S4 and the scatterplot in Fig. 5 present the results of these correlation tests.
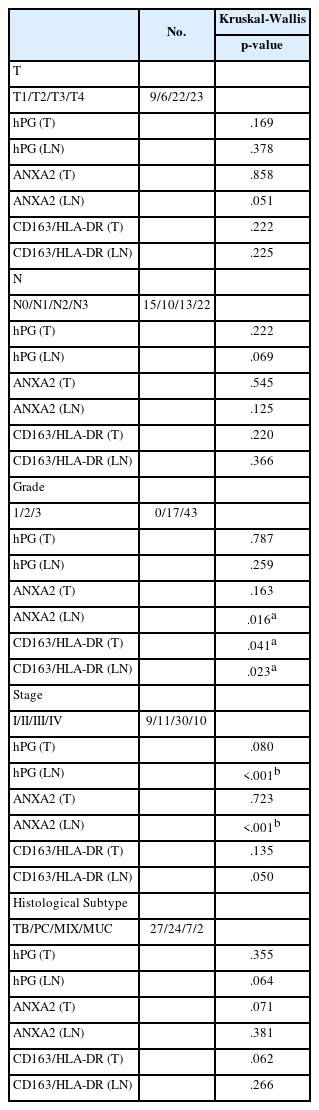
hPG and ANXA2 expression and CD163/HLA-DR in relation to clinicopathological parameters
hPG and ANXA2 expression, the hPG/ANXA2 ratio, and the CD163/HLA-DR ratio in T and LN tissues were studied in relation to common clinicopathological parameters (T and N, grade, stage, and histological subtype). All the parameters were distributed into their respective subcategories. A Kruskal-Wallis non-parametric ANOVA was performed to assess whether groups differed significantly. This investigation was expanded with Dunn’s test with Bonferroni adjustment to ensure that the adjusted p-values retained their significance.
We found a statistically significant ANXA2 expression difference between tumor grades 2 and 3 (p = .016) in LN tissue. Moreover, a statistically significant difference between tumor grades 2 and 3 in the CD163/HLA-DR ratio in T and LN tissues also came to light (p = .041 and p = .023, respectively) (Table 2). ANXA2 expression in LN tissue seems to increase as the grade progresses from 2 to 3. On the other hand, the CD163/HLA-DR ratio in T and LN tissues appears to decrease as the tumor grade increases (Supplementary Table S5).
Evaluation of the differential expression of hPG and ANXA2 and the CD163/HLA-DR ratio among groups
The significant p-values observed for hPG and ANXA2 expression differences between tumor stages in LN tissues did not retain their statistical significance after adjustment. These results indicate a failure to properly differentiate the values of these patients’ clinicopathological parameters based on the expression of these antigens, so we discarded those correlations (Table 2).
Marker expression and projected patient survival outcomes
We investigated the different projected OS and DFS outcomes according to the expression of all the markers in tumoral tissues. The expression of ANXA2 in both the T and LN tissues produced survival curves that differed significantly, with worse survival outcomes associated with higher ANXA2 expression. As shown in Supplementary Table S6, both OS and DFS are severely affected when ANXA2 expression is high (p = .016–.035). Patients with high ANXA2 expression in their LN tissues showed the worst prognosis. The survival analysis results for ANXA2 are plotted in combined plots to compare the different survival groups (Fig. 6). As such, the population was divided into two distinct strata, patients with ANXA2 H-score values < 100 (low expression) and patients with ANXA2 H-score values ≥ 100 (high expression).
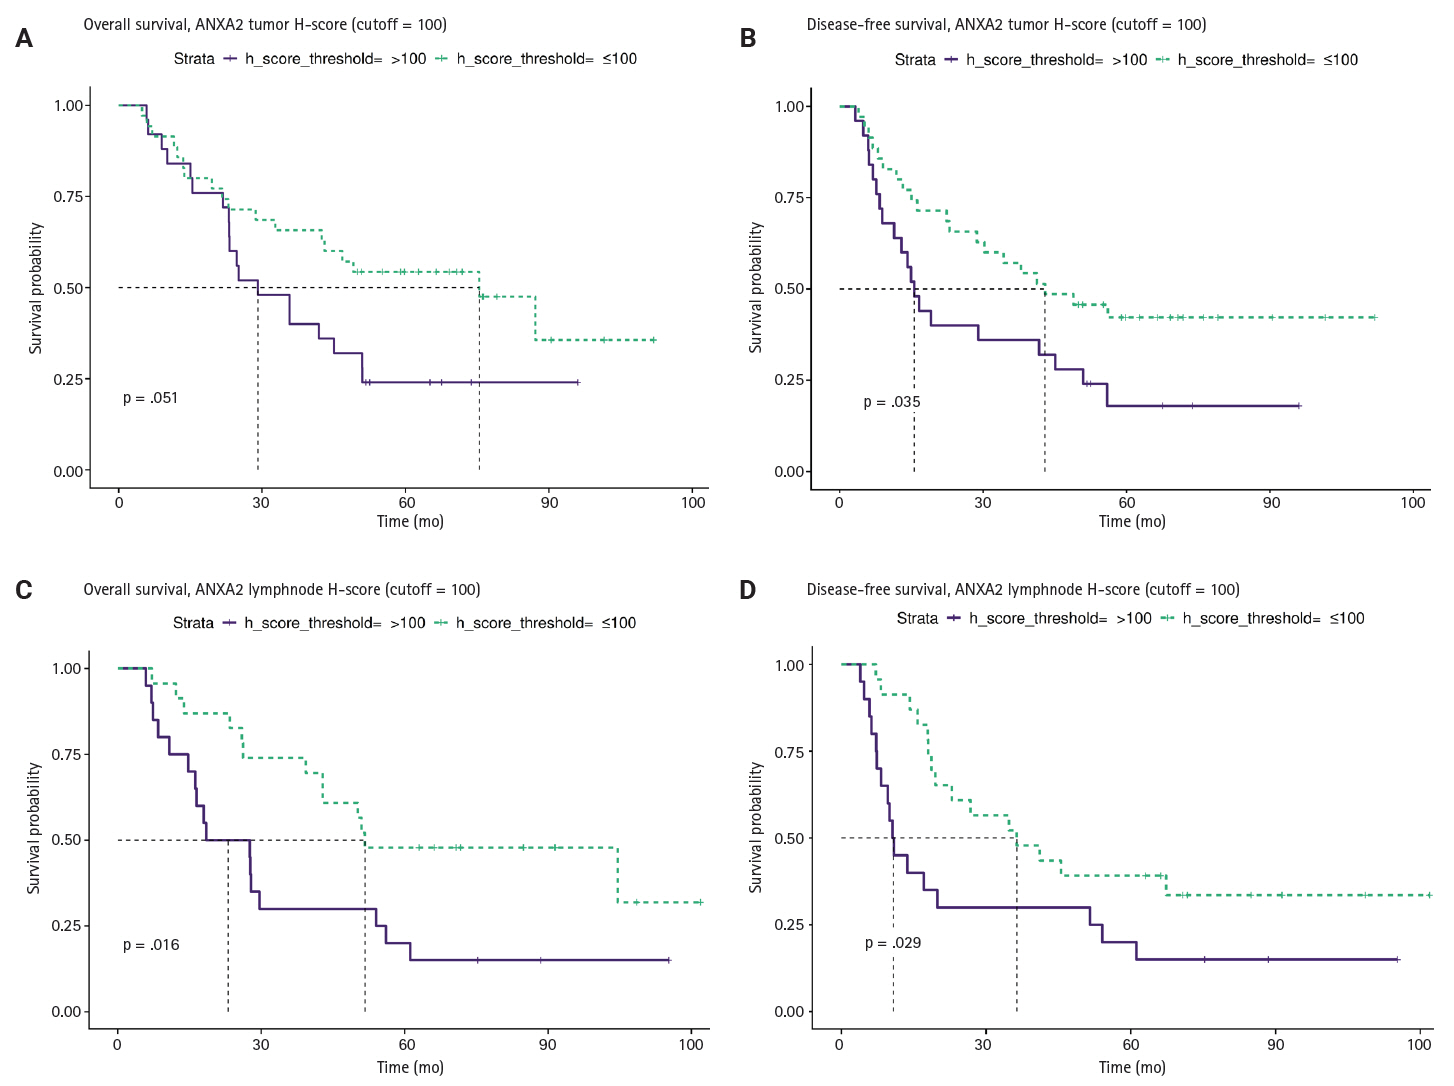
Comparison of survival curves depicting patients’ overall (A, C) and disease-free survival (B, D) stratified by high and low annexin A2 (ANXA2) expression in tumors and lymph node metastases. Survival is worse for patients with high ANXA2 expression.
When we evaluated the effects of hPG levels on patient survival, higher expression seemed to coincide with better survival outcomes. However, as shown in Supplementary Table S6, all the tests have p-values higher than .05, making the trend non-significant. Consequently, patients’ OS and DFS were not influenced by hPG expression. Likewise, we assessed the CD163/HLA-DR ratio for differences in survival using a threshold of 1, with values <1 showing a greater influence of HLA-DR, and values ≥1 indicating that CD163 is more influential. Although the ratio seemed to be higher in patients with better survival outcomes, the results were not statistically significant (p > .05).
In the next step of our analysis, we evaluated the independent prognostic value of ANXA2. First, we evaluated its expression’s relationship with patient survival on its own in all conditions (univariable analyses). Then, we added common clinicopathological variables (sex, age, histological subtype, location, grade, stage) to the model to determine whether they significantly improved the model fit (multivariable analysis).
In the univariable analysis of the primary tumors (T), low ANXA2 expression (H-score ≤ 100) showed a statistically significant association with longer DFS (hazard ratio [HR], 0.52; 95% confidence interval [CI], 0.28 to 0.97; p = .039) and a non-significant association with improved OS (HR, 0.53; 95% CI, 0.27 to 1.01; p = .054). However, in the multivariable analysis, those associations were attenuated and became non-significant (DFS: HR, 0.55; p = .110; OS: HR, 0.66; p = .310). Moreover, the LRTs were significant (DFS LRT p = .02; OS LRT p = .024), indicating that the block of clinical covariates provided significantly more prognostic information than the ANXA2-only model. Therefore, the prognostic effect of ANXA2 in T tissues is not independent and is largely explained by other clinicopathological variables.
In the univariable analysis of LN tissues, low ANXA2 expression (H-score ≤ 100) was associated with improved DFS (HR, 0.47; 95% CI, 0.23 to 0.94; p = .033) and OS (HR, 0.42; 95% CI, 0.20 to 0.87; p = .020). After the multivariable adjustment, the HRs, for ANXA2 remained similar, but they lost their statistical significance (DFS: HR, 0.48; p = .096; OS: HR, 0.50; p = .130). In addition, the LRTs in this case were non-significant (DFS: p = .560; OS: p = .440), indicating that the added clinical variables did not significantly improve the model fit over the ANXA2-only model. Together, these findings indicate that although ANXA2 in LN tissues is a strong prognostic marker, it does not provide significant independent information because its effects are confounded by or overlap with those of the clinicopathological factors. A summary of these findings is displayed in Table 3.
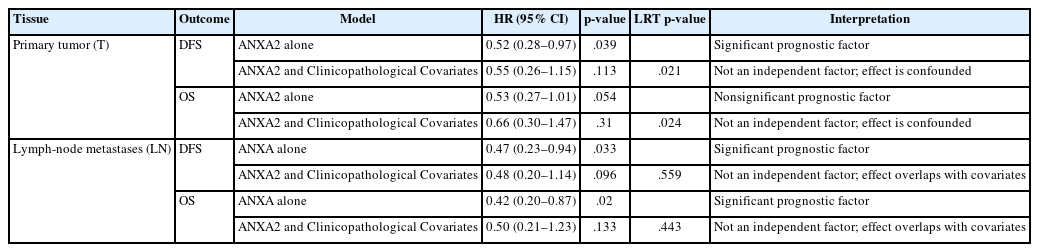
Summary of Cox proportional hazards models assessing the independent prognostic value of ANXA2 expression (dichotomized at an H-score of 100)
DISCUSSION
Gastric adenocarcinoma remains a major global health problem. Despite medical advances, the prognosis for advanced-stage gastric cancer remains poor. In this retrospective study, we studied hPG, ANXA2, and TAMs to determine their potential roles in gastric cancer progression and their prognostic significance. We investigated their expression in primary gastric adenocarcinomas (T) and their lymph node metastases (LN), in non-tumoral gastric tissue adjacent to the adenocarcinomas (non-tumoral), and in unremarkable gastric mucosa from healthy subjects (healthy). A thorough investigation was conducted to discern these markers’ summary distributions, differential expressions, expression correlations, and relationships with patients’ clinicopathological parameters and survival outcomes.
In our results, ANXA2 emerged as a protagonist in gastric adenocarcinoma oncogenesis. Its expression was significantly elevated in the neoplastic cells of T and LN tissues, compared with epithelial cells in the non-tumoral gastric mucosa adjacent to the adenocarcinomas and the gastric mucosa of healthy controls. The gradual increase in ANXA2 expression from healthy gastric tissues to non-tumoral mucosa in the vicinity of carcinoma to primary adenocarcinoma tissue and then lymph node metastases hints at its role in the development of gastric adenocarcinomas. In addition, we found that ANXA2 expression differed significantly between tumor grades, with higher ANXA2 levels in grade 3 tumors than grade 2 tumors, further supporting the notion that ANXA2 is linked to adverse tumor characteristics. Our results also indicate that higher levels of ANXA2 in T and LN tissues were associated with worse OS and DFS. Patients with higher ANXA2 expression in their LN tissues exhibited the poorest prognosis. These findings align with those of prior studies, which found that ANXA2 overexpression was associated with aggressive gastric cancer behavior and worse patient prognosis. Four studies conducted in Asian populations [51-53,56] and one in a South American population [54] showed that ANXA2 upregulation correlated with a higher tumor grade, increased size, venous invasion, lymph node and distal metastases, and an advanced stage. The association between ANXA2 expression and gastric cancer patient survival was previously evaluated in only two Asian cohorts, which reported poor survival rates in patients with ANXA2-overexpressing gastric cancer, though just one of them showed ANXA2 to be an independent prognostic factor in this setting [51]. To the best of our knowledge, this study is the first to highlight that poor prognosis is linked to ANXA2 protein overexpression in gastric adenocarcinoma in a Caucasian population, even though our data failed to demonstrate that it has independent prognostic value, probably because of the relatively small number of patients in our dataset.
Some data are available about the putative mechanism by which ANXA2 promotes gastric adenocarcinoma. First, in patient tissue studies, its upregulation was linked to reduced e-cadherin expression by Han et al. [52] and to c-erbB-2 overexpression by Emoto et al. [56]. Second, Tas et al. [60] found high ANXA2 serum levels in chemotherapy-resistant patients. Research in human gastric cancer cell lines demonstrated that ANXA2 inhibition reduced tumor cell migration and matrix metalloproteinase secretion [53]. Moreover, Leal et al. [54] found that ANXA2 upregulation enhanced gastric cancer cell invasion, and Zhang et al. [57] showed that silencing it reversed tumor cell chemoresistance to cisplatin. Xie et al. [58] confirmed the role of ANXA2 in tumor cell proliferation and survival, as well as the therapeutic potential of its silencing, and Mao et al. [59] identified the EphA2–YES1–ANXA2 axis as a potential therapeutic target in gastric adenocarcinoma. Furthermore, H. pylori seems to be able to induce ANXA2 and S100A7 overexpression, thereby destabilizing epithelial junctions and promoting carcinogenesis [55].
Our study demonstrates the important role that ANXA2 plays in gastric cancer tumorigenesis and progression and suggests a threshold of expression (H-score = 100) above which patient survival is significantly compromised. Because IHC can easily detect protein overexpression in human tissues, the ANXA2 H-score could serve as a prognostic biomarker, if larger-scale studies further elucidate the extent of the negative effects on patient prognosis implied by our results. Furthermore, given that blocking its expression or disrupting its interactions with other proteins is feasible, ANXA2 emerges as a candidate therapeutic target for patients with ANXA2-overexpressing gastric adenocarcinomas. In this context, the H-score could serve as a marker predicting a therapeutic response.
hPG, a precursor form of gastrin, has been implicated in carcinogenesis due to its involvement in various signaling pathways that promote tumor growth and survival [24]. Studies using gastric cancer cell lines and mouse models have linked hPG upregulation to aggressive tumor characteristics. More specifically, antral cells that express the progastrin receptor cholecystokinin 2 receptor (CCK2R) have been shown to exhibit some traits of stem cells [41]. hPG increases Lgr5 expression and promotes organoid formation in CCK2R+/Lgr5– cells and differentiation into Lgr5+ stem cells [42].
Our study, which is, to our knowledge, the first to use IHC to investigate hPG expression in human gastric cancer tissues, shows some conflicting findings. On the one hand, hPG expression correlated positively with ANXA2 expression in the primary tumors, providing further support for the ligand (hPG)–receptor (ANXA2) relationship proposed in previous studies investigating hPG receptors [45,50]. On the other hand, tissue sections from primary tumors, lymph node metastases, and non-tumoral gastric mucosa from gastric cancer patients had significantly decreased hPG protein expression, compared with the levels in the healthy controls. Moreover, hPG expression showed no statistically significant differences between T and LN tissues and the adjacent non-tumoral gastric tissues. Importantly, our cohort did not show any significant correlation between hPG expression and the patients’ clinicopathological parameters. Our findings are partly in contrast with the only other publication to have investigated how hPG levels in gastric cancer patients correlate with survival outcomes. In that recent study, Amjadi et al. [43] reported that increased serum hPG levels were found in patients with gastric cancer, compared with their gastric-cancer-free participants. However, similar to our findings, hPG levels were not statistically related to tumor prognostic features such as stage, grade, or metastatic potential [43]. Furthermore, in our dataset, we did not identify any statistically significant differences in survival outcomes according to the hPG expression level. Both OS and DFS were unaffected by the hPG levels in the primary tumors and lymph node metastases. It is interesting that an investigation of other human malignancies linked high hPG levels with worse clinical outcomes [11]. However, most previous research has focused on serum titers [28,30,32,33,36], rather than tissue [38] hPG expression levels. Therefore, the lack of prognostic significance in our study could imply that only the hPG serum concentration, as opposed to tissue protein expression, has prognostic value. However, taking all the data together, a more likely scenario is that hPG is not a reliable prognostic biomarker for gastric adenocarcinoma, indicating that the oncogenic development of this cancer relies on other molecular mechanisms and pathways. On the other hand, it is possible that our small sample was not adequate to reveal hPG’s prognostic significance. Future research with a sizable set of patients might unmask any effects of hPG on gastric cancer prognosis. Another possible limitation of our study is that no antibody specific to hPG is commercially available, and the specificity of the one we used might not have been optimal and potentially shown some cross-reactivity. That possibility could also explain the lack of significant differential expression between the neoplastic and normal-looking tissues in this study because gastrin is normally expressed in gastric tissue.
TAMs are key components of the tumor microenvironment that can adopt different phenotypes depending on the signals they receive from the tumor milieu. The M1 phenotype is typically associated with inflammation, microbicidal, and tumor suppressive activity, and the M2 phenotype is typically associated with tissue repair and tumor promotion [61,62]. The oncogenic role of the M2 macrophage phenotype and its association with aggressive tumor features, such as high grades, has been demonstrated by previous studies on human gastric cancer tissues, including two meta-analyses [64-68]. Moreover, M2 was found to be the main TAM phenotype in intraperitoneal metastases of advanced human gastric cancer [69], and high levels of M2 TAMs were shown to be linked to the epithelial–mesenchymal transition, and both of them had independent negative prognostic value and were possibly linked to the TGF-β signaling pathway [70]. In addition, a predominance of M2 over M1 TAMs in human gastric adenoma stroma was shown to increase the likelihood that it would transform into gastric adenocarcinoma [71].
In this study, we used the CD163/HLA-DR ratio to assess TAM polarization, with CD163 marking M2 macrophages, and HLA-DR marking M1 macrophages. The CD163/HLA-DR ratio increased significantly from healthy to non-tumoral tissues to primary gastric tumors to lymph node metastases, suggesting an increasing concentration of M2 macrophages as the disease progresses. This finding is in line with previous studies that showed an association between a shift in macrophages toward the M2 phenotype in lymph node metastatic disease and advanced TNM stage. It is of note that, in the present cohort, the CD163/HLA-DR ratio differed significantly between tumoral and normal-looking (non-tumoral and healthy) tissues, without a statistically significant difference between the non-tumoral and healthy tissues. This finding could imply that macrophage polarization toward an M2 phenotype in the tumor microenvironment is not an early event in gastric carcinogenesis but requires an accumulation of cancerous hits.
The literature supports an association between an increase in M2 TAMs and poor patient survival [64-68]. In this study, despite the observed changes in TAM polarization, the CD163/HLA-DR ratio showed no significant correlation with patient survival. In addition, the CD163/HLA-DR ratio in T and LN tissues decreased from tumor grade 2 to 3, in contrast to previous reports that demonstrated a link between a predominance of the M2 phenotype and poor histological differentiation [68]. Our findings are difficult to interpret and might be attributable to the small sample size of our cohort. Interestingly, we found a statistically significant negative correlation between ANXA2 expression and the CD163/HLA-DR ratio in tumor tissues, indicating that tumors with high ANXA2 expression might have a lower proportion of M2 TAMs. Although that result initially seems counterintuitive, given the known tumor-promoting roles of both ANXA2 and M2 macrophages, it is possible that ANXA2 overexpression triggers some compensatory mechanisms in the tumor microenvironment, including the induction of the M1 macrophage phenotype.
Although our study provides some valuable insights into the roles of hPG, ANXA2, and TAMs in gastric adenocarcinomas, several limitations should be acknowledged. First, our study was based on a relatively small sample, which might have prevented some statistical trends from coming to light. Studies with more patient samples are needed to validate our results and shed more light on the ways ANXA2 expression affects patient prognosis and explore the potential clinical applications of our findings in gastric cancer. Additionally, as already discussed, no specific hPG antibody was commercially available, and we have insufficient documentation about the specificity of the antibody we used. Furthermore, although we focused on the expression of hPG, ANXA2, and TAMs in primary gastric tumors and their lymph node metastases, future studies could investigate their role in circulating tumor cells and distant metastases to provide a more comprehensive understanding of their role in gastric adenocarcinoma. Moreover, although we demonstrated a significant negative correlation between the increased ANXA2 expression in neoplastic cells and patient survival, the molecular mechanisms underlying the oncogenic effects of ANXA2 in gastric cancer remain largely unclear. Future studies should focus on elucidating the signaling pathways activated by ANXA2 in gastric cancer cells and determining how those pathways interact with other molecules or components of the tumor microenvironment. Additionally, an exploration of the potential therapeutic utility of targeting ANXA2, either alone or in combination with other treatments, could open new avenues for the management of gastric cancer.
In conclusion, we are here the first to highlight the dismal prognosis associated with ANXA2 overexpression in a Caucasian population of gastric cancer patients. Additionally, our work, which is the first to use IHC to investigate hPG in human gastric cancer tissues, found no significant correlation between hPG expression and patients’ clinicopathological parameters or survival outcomes. Finally, we verified the polarization of the tumor microenvironment toward M2-like macrophages as gastric cancer progresses. Future research should aim to validate our findings in larger cohorts and explore the therapeutic potential of targeting ANXA2, as well as of modifying the TAM phenotype, in gastric adenocarcinoma patients.
Supplementary Information
The Data Supplement is available with this article at https://doi.org/10.4132/jptm.2025.12.20.
Notes
Ethics Statement
The study was conducted in accordance with the Declaration of Helsinki and approved by the Institutional Ethics Committee of Laiko General Hospital of Athens, Greece (492/18-07-2022). Individual consent was waived due to the nature of the study.
Availability of Data and Material
The data presented in this study are included in the article/supplementary material. Further inquiries can be directed at the corresponding author(s).
Code Availability
Not applicable.
Author Contributions
Conceptualization: KC, NC, DS, SS. Formal analysis: KC, SMP. Investigation: KC. Methodology: KC, SS. Project administration: SS. Software: SMP. Supervision: NK, DS, SS. Validation: KC, SMP, RF, NC, NK, DS, SS. Visualization: KC, RF, NC, SS. Writing—original draft: KC. Writing—review and editing: KC, SMP, DS, SS. Approval of final manuscript: all authors.
Conflicts of Interest
The authors declare that they have no potential conflicts of interest.
Funding Statement
No funding to declare.
Acknowledgements
We would like to express our gratitude to Professor Arthur Shulkes and his team, including Chelsea Dumesny, for providing us with the progastrin antibody (1137).