A single-institution demographic study of pathologically proven renal disease in kidney transplant recipients over the last 33 years
Article information

Abstract
Background
While the number of kidney transplants for end-stage renal disease (ESRD) is increasing, studies examining the long-term demographic analyses based on pathological diagnosis of transplant kidney remain limited.
Methods
We conducted a retrospective analysis of 4,188 transplant recipients who underwent either biopsy or nephrectomy from 1991 to 2023 at Seoul St. Mary’s Hospital.
Results
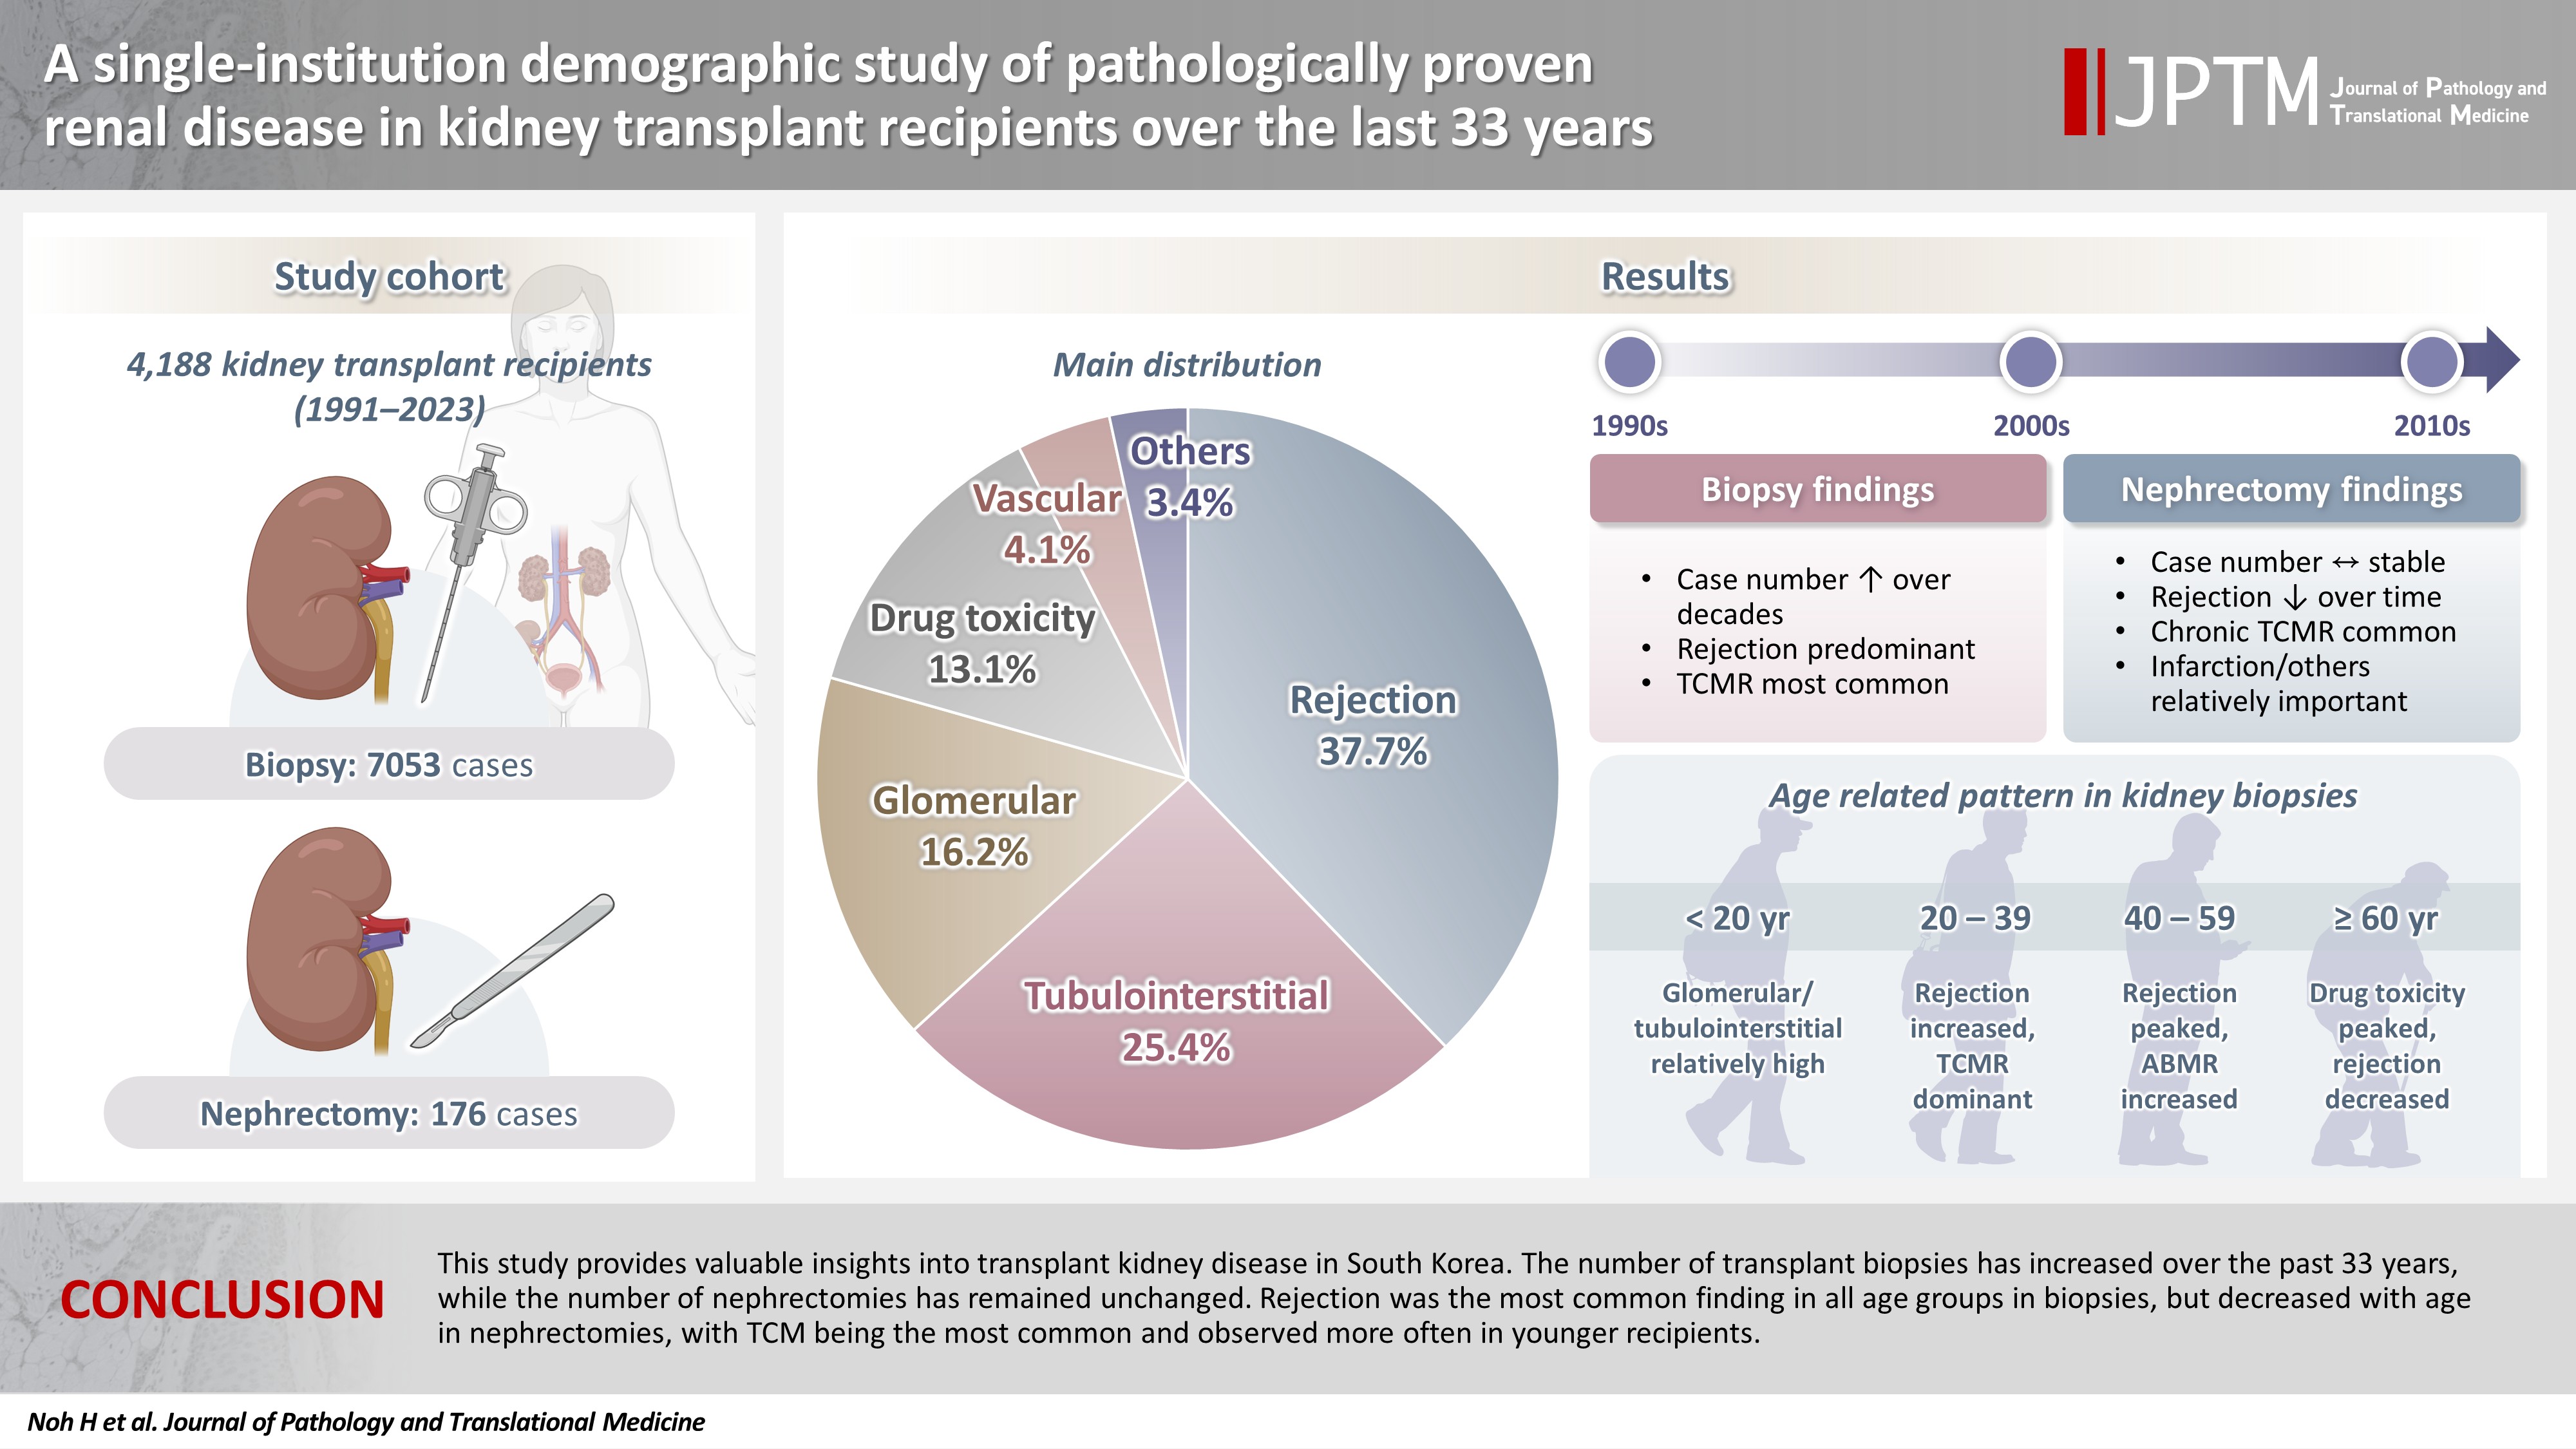
Among 7,229 pathologically confirmed cases, rejection was the most prevalent (37.7%), followed by tubulointerstitial (25.4%), glomerular, drug toxicity, and vascular diseases. In 7,053 transplant biopsies, rejection was predominant across all age groups, with T-cell mediated (TCM) category being the most common (60.1%), followed by antibody-mediated and mixed. Drug toxicity increased with age (p = .047), while glomerular and tubulointerstitial diseases were highest in recipients under 20 (p < .001). Among glomerular diseases, IgA-related glomerulonephritis (45.2%) was the most common. In 176 transplant nephrectomies, the most common diagnosis was rejection (33.5%), followed by renal infarction (19.9%), tubulointerstitial, vascular, glomerular disease, and drug toxicity. “Others” included infarction, ESRD, and lymphangiectasia, which increased with age (p = .011). In nephrectomy cases, rejection decreased over time, with chronic TCM rejection (40.7%) being the most frequent.
Conclusions
This study provides valuable insights into transplant kidney disease in South Korea. The number of transplant biopsies has increased over the past 33 years, while the number of nephrectomies has remained unchanged. Rejection was the most common finding in all age groups in biopsies, but decreased with age in nephrectomies, with TCM being the most common and observed more often in younger recipients.
INTRODUCTION
Kidney transplantation (KT) is the main treatment for end-stage renal disease (ESRD), but maintaining the transplanted kidney remains a challenge [1,2]. Biopsies are routinely performed to diagnose and manage various conditions affecting transplanted kidneys, and if the recipient's condition worsens, transplant nephrectomy is performed [2]. According to the Global Burden of Disease, Injuries, and Risk Factor Study, 697.5 million people had chronic kidney disease in 2017, which corresponds to a global prevalence of 9.1%, and resulted in 1.2 million deaths [3]. Furthermore, as of 2016, Korea recorded the sixth-highest incidence of ESRD worldwide, exceeding 300 cases per million [4], and this trend is particularly pronounced due to the aging population and the increase in diabetic nephropathy (DMN) [5]. Since the first KT in Korea was performed in 1969 [6], there has been a steady rise in the number of transplant recipients [7]. Numerous studies have explored the clinical outcomes of KT, examining success and failure rates and their causes [8-12], and to determine the reasons for kidney transplant losses [13-20]. However, few studies have conducted long-term demographic analyses based on pathological diagnoses [21,22].
In this study, we retrospectively reviewed all transplant kidney diseases performed over a 33-year period at Seoul St. Mary's Hospital in South Korea, to conduct a long-term demographic analysis based on the pathological diagnosis of transplant kidneys.
MATERIALS AND METHODS
Recipient population
Our retrospective investigation encompassed 4,188 recipients who underwent pathology examinations of transplanted kidneys at Seoul St. Mary’s Hospital from January 1991 to December 2023. We reviewed pathological and clinical records of the recipients. Exclusion criteria included incomplete medical records, inadequate tissue specimens, frozen biopsy specimens, and donor/recipient renal artery biopsy specimens.
This study aimed to investigate renal inflammatory diseases in transplanted kidneys, excluding tumors. We collected the data on: kidney specimen type (either biopsy or surgical), date of procedure, recipient age, sex, transplantation status and histopathologic diagnosis. This study considered each tissue (biopsy or nephrectomy) separately. That is, if multiple pathological diagnoses were present in a single tissue, these diagnoses were counted separately. If multiple diagnoses from a single transplant kidney biopsy or nephrectomy specimen were received, the one that appeared to be the primary cause of renal allograft dysfunction prompting the diagnostic procedure was designated as the major diagnosis. This was used to analyze correlations between the recipient's sex, age, time of diagnosis, and the disease. Other diagnoses were counted as minor diagnoses. All major and minor diagnoses were used to analyze the frequency and distribution of each disease. Each case was diagnosed according to the pathological diagnostic entity, and then was classified based on disease type, demographic data, and changes over time.
Data source
Our study included both biopsy and nephrectomy specimens to ensure comprehensive analysis of entire renal diseases in transplant kidneys. We analyzed them separately and classified into the following six disease types based on pathologic diagnoses: Rejection, drug toxicity, glomerular disease, tubulointerstitial disease, vascular disease, and “Others” (diagnoses not fitting clearly into the previous five types).
The pathologic classification of rejection in transplanted kidneys was based on the 1997 Banff classification [23], incorporating updates from the Banff 2019 [24] and Banff 2022 [25] kidney meeting reports. Rejection was classified into T-cell mediated (TCM), antibody-mediated (ABM), and mixed categories. TCM included three categories: borderline change, acute T-cell mediated rejection (TCMR), and chronic TCMR. ABM included hyperacute rejection, acute antibody-mediated rejection (ABMR), chronic ABMR, microvascular inflammation (MVI), donor-specific antibody (DSA) negative and C4d negative, acute/chronic transplant glomerulopathy, and C4d staining without evidence of rejection. Mixed category included cases in which diagnoses from both of the aforementioned categories were simultaneously presented in one transplant recipient. All recipients diagnosed with drug toxicity were those who used immunosuppressants, specifically calcineurin inhibitors such as cyclosporine A and FK506.
Glomerular disease was classified according to the following three criteria: first, classification according to pathological diagnostic entity; second, classification according to morphologic category; third, classification according to etiologic category. According to the morphologic category, glomerular disease was classified into proliferative, non-proliferative, sclerosing, mixed (diseases with two or more of the previous categories), and other (diseases not fitting into the previous categories). According to the etiological category, glomerular disease was classified into primary, secondary, hereditary, mixed (diseases with both primary and secondary features), and unknown (diseases not fitting into the previous categories).
Tubulointerstitial and vascular diseases were classified according to the pathological diagnostic entity. All cases were analyzed across three consecutive decades (1991–2000, 2001–2010, and 2011–2020). To examine correlations between recipient age and disease types, participants were stratified into four age groups (under 20 years, 20–39 years, 40–59 years, and over 60 years).
Statistical analyses
Continuous variables were presented as mean ± standard deviation and compared using ANOVA or the Kruskal-Wallis test. When significant differences were observed, Tukey’s honestly significant difference test and pairwise comparisons of proportions with Bonferroni correction were performed for post-hoc analysis. Categorical variables were reported as frequency (%) and compared using the chi-squared test. For the analysis of the trend in disease prevalence over the time period, linear regression analysis was used.
RESULTS
Renal disease in transplant kidney
A total of 4,188 recipients with renal disease in transplant kidneys (4,072 biopsies and 116 nephrectomies) were enrolled. The sex ratio was 1.60:1 (Fig. 1A), and the mean age was 44.7 ± 12.2 years. In total, 7,229 major and minor renal diagnoses were made in all recipients by biopsy or nephrectomy. Among them, rejection was diagnosed in 2,723 cases (37.7%), showing the highest frequency, followed by tubulointerstitial (1,837 cases, 25.4%), glomerular (1,174 cases, 16.2%), drug toxicity (949 cases, 13.1%), and vascular diseases (295 cases, 4.1%) (Fig. 1B). When the mean age and sex ratio of the recipients who underwent biopsy or nephrectomy were compared in Table 1, no significant differences were observed between the two groups in terms of age and sex ratio.
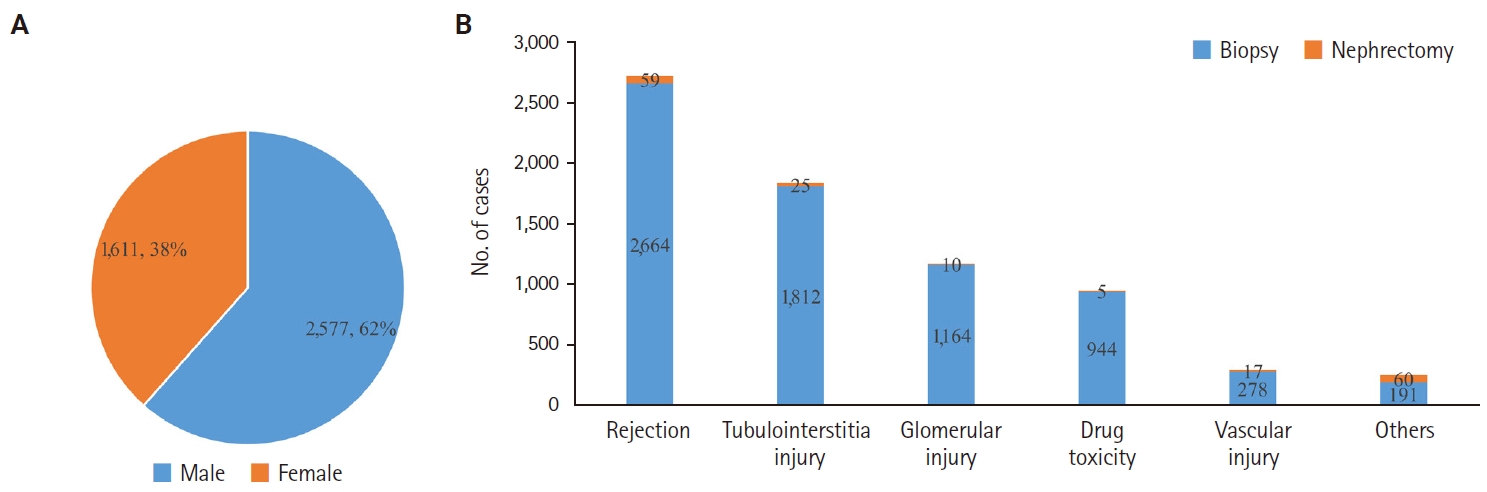
(A) Sex ratio of 4,188 patients with transplant kidney disease including biopsy and nephrectomy. (B) Diagnostic categories of kidney disease in transplant biopsy and nephrectomy cases.
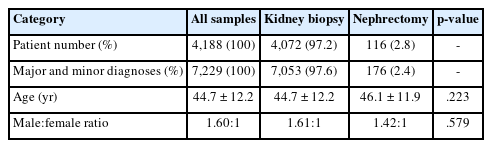
Demographic data of 4,188 patients with renal disease in transplant kidney
Renal disease in transplant kidney biopsy
The sex ratio of 4,072 recipients who underwent renal biopsy was 1.61:1, and the mean age was 44.7 ± 12.2 years (Table 1). The incidence of renal diseases diagnosed through biopsy began to increase in the 20s, peaked in the 40s, and then gradually decreased until the 60s (Fig. 2A). A total of 2,072 recipients were diagnosed with rejection. The number started to increase in their 10s, 20s, and 30s, peaked in their 40s, and decreased in the 50s, 60s, and over 70s. The number of recipients diagnosed with drug toxicity was 337, and it began to increase in their 10s, 20s, 30s, 40s, reached a peak in their 50s, and declined in 60s, and over 70s. The number of glomerular disease recipients was 707, and it began to increase in their 10s, 20s, and 30s, peaked in their 40s, and then decreased in 50s, 60s, and over 70s. Tubulointerstitial diseases were diagnosed in 701 recipients, and the incidence started to increase in their 10s, 20s, and 30s, peaked in their 40s, and decreased in 50s, 60s, and over 70s. Vascular disease was diagnosed in 76 recipients, with the highest prevalence in their 30s, 40s, and 50s, followed by those in their 60s, 20s, 70s or older, and teenagers.
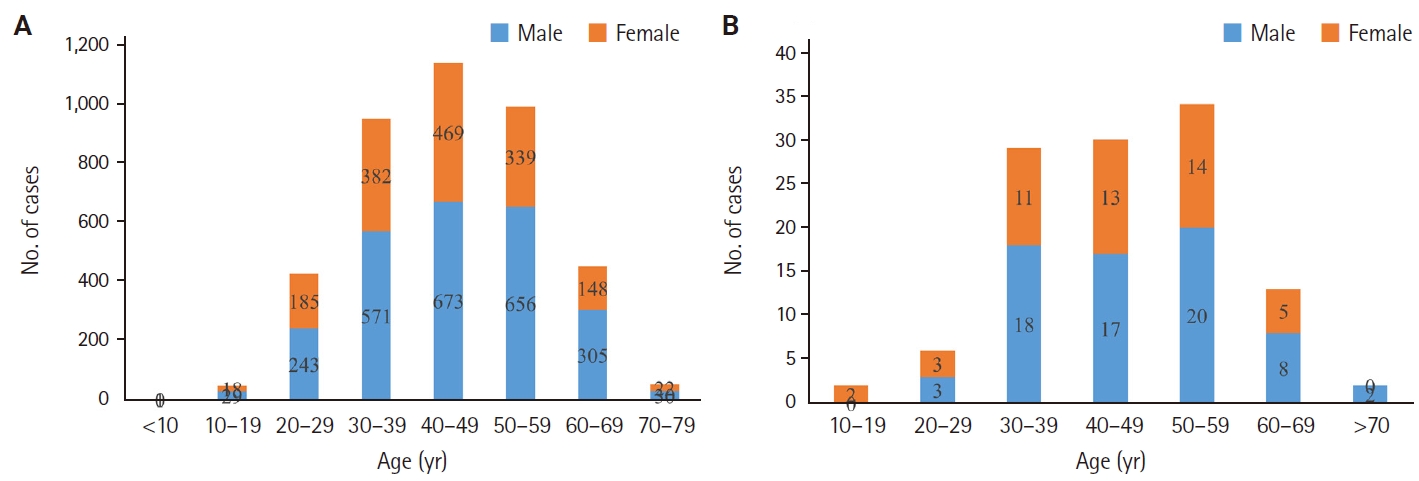
(A) Age and sex distribution of 4,072 patients who underwent biopsy for transplant kidney disease. (B) Age and sex distribution of 116 patients who underwent nephrectomy for transplant kidney disease.
Trends of renal disease in transplant kidney biopsy
Decadal changes of biopsies performed for transplant renal disease
The number of transplant biopsies increased 2.19-fold over three decades from the 1990s (846 recipients) to the 2000s (1,007 recipients) and the 2010s (1,849 recipients).
Decadal changes of transplant biopsies classified by renal disease types
Rejection rates decreased from the 1990s (576 recipients, 68.1%) to the 2000s (415 recipients, 41.2%), but they increased in the 2010s (904 recipients, 48.9%). Except for rejection, the number and frequency of other renal diseases increased from the 1990s to the 2000s and 2010s (Fig. 3). The changes in the proportions of each disease types were as follows: drug toxicity - 1990s (37 recipients, 4.4%), 2000s (98 recipients, 9.7%), and 2010s (184 recipients, 10.0%); tubulointerstitial - 1990s (82 recipients, 9.7%), 2000s (180 recipients, 17.9%), and 2010s (355 recipients, 19.2%); glomerular - 1990s (92 recipients, 10.9%), 2000s (213 recipients, 21.2%), and 2010s (322 recipients, 17.4%). No consistent change was observed in vascular diseases over time: 1990s (6 cases, 0.7%), 2000s (39 cases, 3.9%), and 2010s (27 cases, 1.5%).
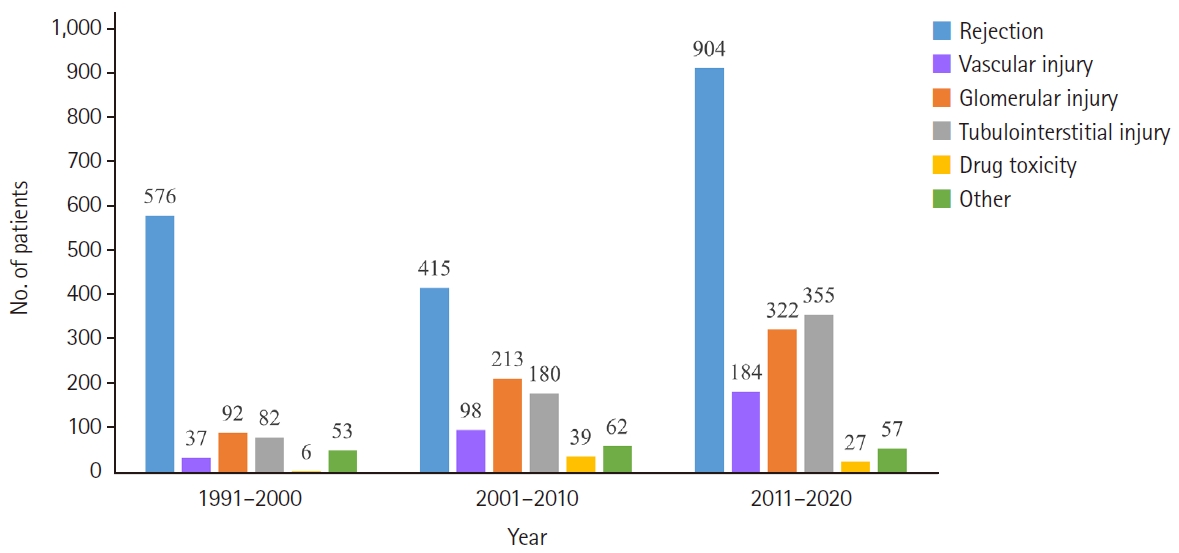
Trends over three decades in the distribution of renal disease types in 3,702 transplant biopsy patients. They were analyzed for three consecutive decades (1991–2000, 2001–2010, and 2011–2020).
Differences in transplant renal disease types by age groups
The distribution of renal disease was classified by age group (Fig. 4). Rejection represented the highest proportion in all age groups, reaching its peak frequency of 52.6% in their 40s and 50s. The proportion of drug toxicity increased with age, peaking in those over 60 years (11.9%) (p = .047). In contrast, glomerular (25.0%) and tubulointerstitial diseases (22.9%) accounted for the highest proportion in recipients under 20 years (p < .001). Furthermore, an analysis of age distribution across rejection categories (Fig. 5) revealed that TCM (42.0 ± 11.6 years) was more common in younger recipients compared to ABM (47.5 ± 11.0 years) and mixed (48.1 ± 11.7 years) categories (p < .001).
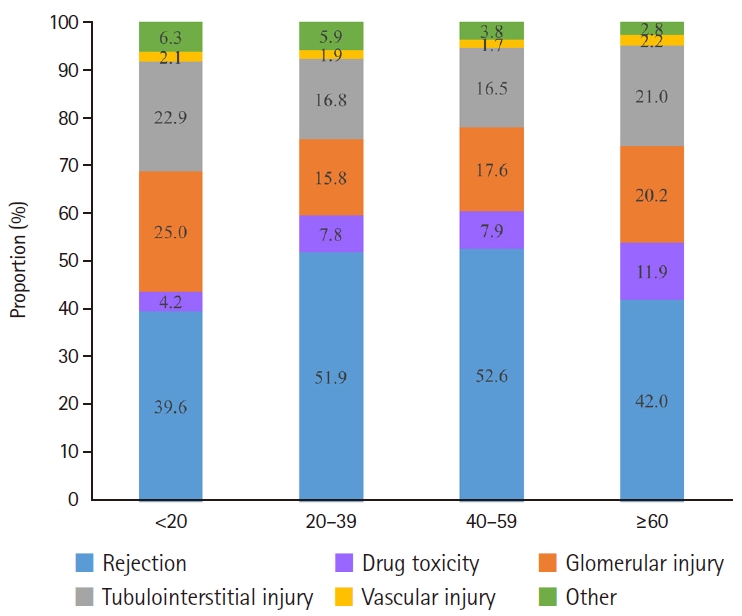
Proportional analysis of renal disease types among four age groups in transplant kidney biopsies. Patients were stratified into four age groups; under 20 years, 20–39 years, 40–59 years, and over 60 years. The proportion of drug toxicity increased with age, peaking in those over 60 years (p = .047). Glomerular and tubulointerstitial diseases accounted for the highest proportions in recipients under 20 years (p < .001).
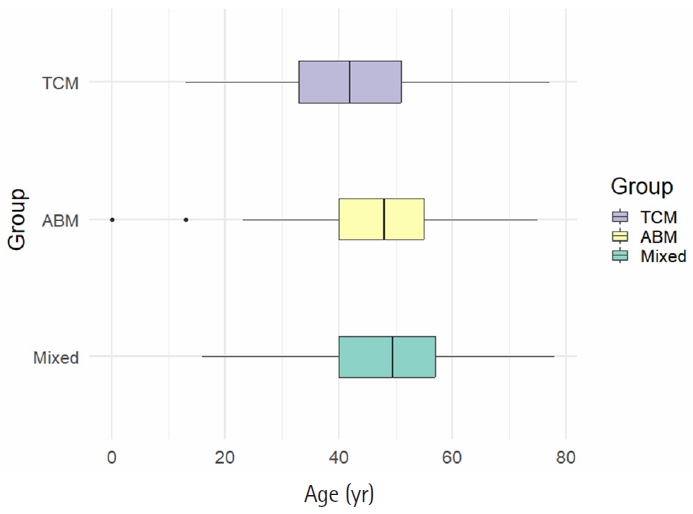
Box plot analysis of age distribution according to rejection categories in transplant kidney biopsy. The mean age and standard deviation of each group was as follows: T-cell mediated (TCM) (42.0 ± 11.6 years), antibody mediated (ABM) (47.5 ± 11.0 years), and mixed (48.1 ± 11.7 years) (p < .001).
When the glomerular morphologic categories were analyzed by age (Fig. 6A), proliferative (mean age, 44.3 ± 11.2 years) and non-proliferative (46.2 ± 13.9 years) glomerulonephritis (GN) were found in younger recipients, whereas sclerosing (51.4 ± 12.8 years) and mixed (51 ± 11.3 years) GN were found in older recipients (p = .001). In an analysis by etiological categories (Fig. 6B), the mean ages were as follows: primary (43.9 ± 11.9 years), secondary (53.5 ± 12.4 years), hereditary (47 ± 9.42 years), and mixed GN (52.3 ± 12.8 years). Recipients with primary GN were notably younger at the time of diagnosis (p < .001).
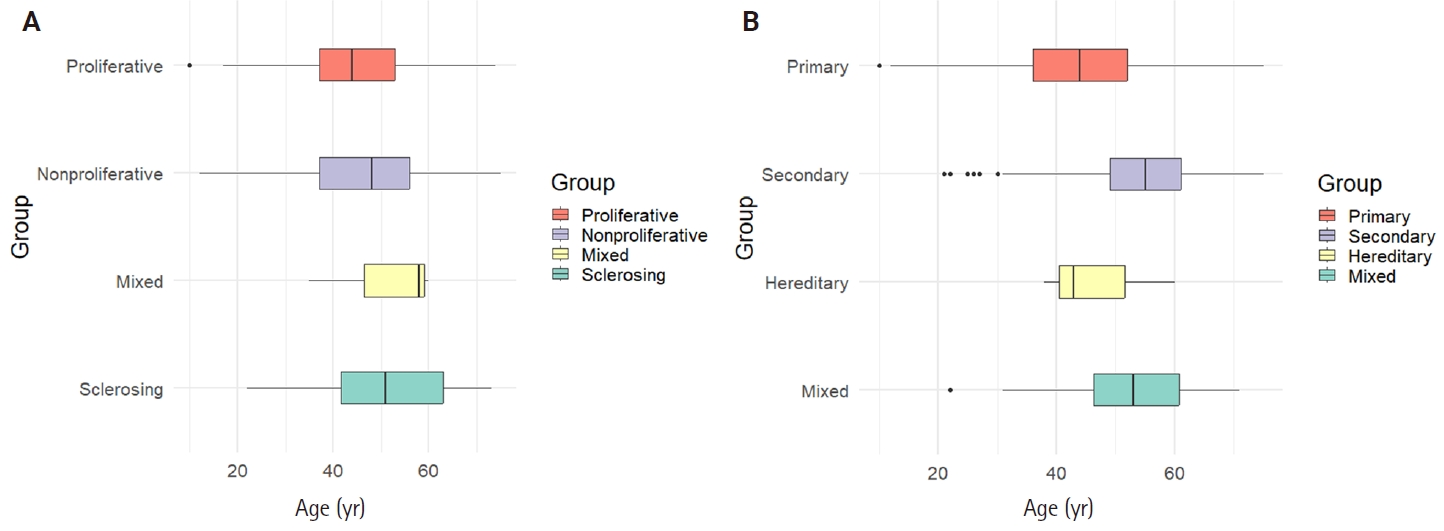
Box plot analysis of age distribution according to glomerular disease categories in transplant kidney biopsy. (A) Morphologic categories of glomerular disease. The mean age and standard deviation of each group was as follows: proliferative (44.3 ± 11.2 years), non-proliferative (46.2 ± 13.9 years), mixed (51 ± 11.3 years), and sclerosing (51.4 ± 12.8 years) (p = .001). (B) Etiologic categories of glomerular disease. The mean age and standard deviation of each group was as follows: primary (43.9 ± 11.9 years), secondary (53.5 ± 12.4 years), hereditary (47 ± 9.42 years), and mixed (52.3 ± 12.8 years) (p <.001).
Demographics and pathologic diagnostic entities in transplant biopsy
Demographic findings on renal diseases diagnosed through biopsy are shown in Table 2. A total of 7,053 cases were diagnosed in 4,072 recipients. Rejection was the most prevalent (2,664 cases, 37.8%), followed by tubulointerstitial (1,812 cases, 25.7%), glomerular (1,164 cases, 16.5%), drug toxicity (944 cases, 13.4%), and vascular diseases (278 cases, 3.9%). There was a significant variation in mean age by disease type (p = .007), primarily due to the significantly lower mean age of patients in the "Others" category. Post-hoc Tukey analysis revealed that patients in the "Others" category were significantly younger than those in the drug toxicity, glomerular disease, and tubulointerstitial disease groups (all adjusted p <.01). After excluding the "Others" category, only the rejection and drug toxicity groups showed a significant age difference (adjusted p = .024).

Demographic data of 4,072 patients with renal disease in transplant kidney biopsy
When observing the frequency of occurrence by sex, drug toxicity was observed to have a slightly higher proportion of men compared to other groups, indicating a significant difference among disease types (p = .002). Post-hoc pairwise comparisons with Bonferroni correction revealed a significant difference in sex distribution only between the rejection and drug toxicity groups. This remained true both in the analysis including “Others” categories (adjusted p =.003) and in the analysis excluding “Others” categories (adjusted p = .002). No other comparisons showed statistically significant differences.
Pathologic diagnostic entities of rejection in transplant biopsy
Rejection was categorized based on the Banff classification, with 2,664 cases diagnosed in 2,072 recipients (Table 3). The TCM category (1,602 cases, 60.1%) was the most frequently diagnosed, followed by ABM (629 cases, 23.6%) and mixed categories (433 cases, 16.2%). Borderline change was the most predominant at 34.3%, followed by acute (21.3%) and chronic (4.5%) TCMR. In the ABM category, ABMR was the most common (10.4%) when combining hyperacute, acute, and chronic. In addition, 167 cases (6.3%) were diagnosed in MVI, DSA negative, and C4d negative, and transplant glomerulopathy accounted for 115 cases (4.3%). Mixed category consisted of 433 cases (16.2%), with MVI and TCMR (133 cases, 5.0%) being the most common, followed by MVI and borderline change (123 cases, 4.6%), ABMR and TCMR (94 cases, 3.5%), and ABMR and borderline change (83 cases, 3.1%).
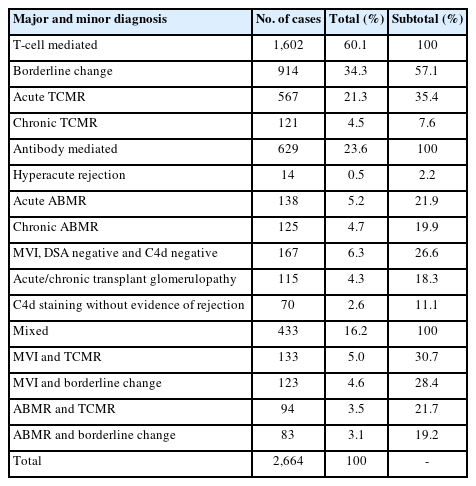
Classification of 2,664 transplant biopsies according to the rejection and diagnostic categories
Pathologic diagnostic entities of drug toxicity in transplant biopsy
Drug toxicity was diagnosed in 944 cases (13.4%) among 337 recipients, with a 2.3 times higher incidence in males. The diagnoses were calcineurin inhibitor nephrotoxicity (267 cases, 79.2%), cyclosporine A nephrotoxicity (62 cases, 18.4%), FK506 nephrotoxicity (4 cases, 1.2%), and immunosuppressant nephrotoxicity (4 cases, 1.2%).
Pathologic diagnostic entities of glomerular disease in transplant biopsy
Glomerular disease was classified according to the pathologic diagnostic entity, with 1,164 cases diagnosed in 707 recipients (Table 4). IgA-related GN (526 cases, 45.2%) accounted for the highest frequency. This was followed by podocytopathy (146 cases, 12.5%), mesangial change/GN (140 cases, 12.0%), and diabetic renal disease (112 cases, 9.6%). Further details on each glomerular diagnostic entity are provided in Supplementary Table S1.
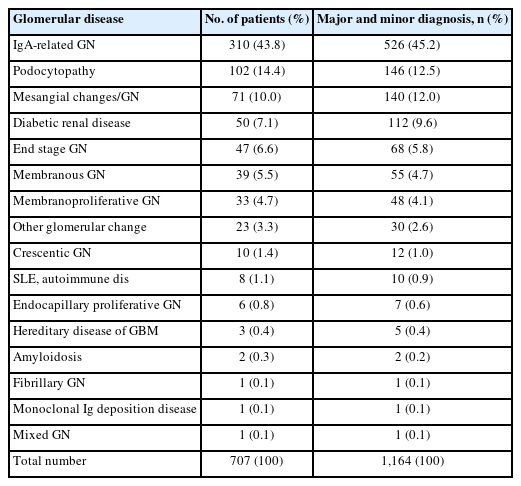
Classification of 1,164 transplant biopsies according to diagnostic categories of glomerular disease
Classification of glomerular diseases by morphologic category
Upon classification of glomerular diseases by morphologic category, proliferative GN (680 cases, 58.4%) was the most common, followed by non-proliferative (413 cases, 35.5%), sclerosing (68 cases, 5.8%), and mixed GN (3 cases, 0.3%). Among proliferative GN types, IgA nephropathy (IgAN) was the most common (523 cases, 76.9%) (Table 5). Among non-proliferative GN types, DMN was the most common (109 cases, 26.4%), followed by focal segmental glomerulosclerosis (FSGS) (75 cases, 18.2%), and membranous GN (MGN) (55 cases, 13.3%) (Table 5). The sclerosing GN category included chronic sclerosing GN (41 cases, 60.3%) and diffuse glomerulosclerosis (27 cases, 39.7%). In the mixed GN category, immunotactoid GN, light chain deposition disease, and mixed IgA and MGN were each diagnosed in one case (33.3%).
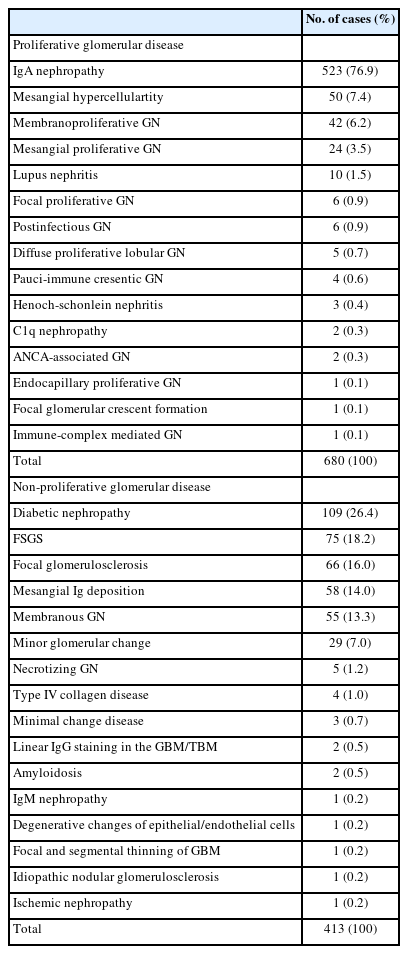
Classification of transplant biopsies according to diagnostic categories of proliferative (n = 680) and non-proliferative (n = 413) glomerular diseases
Classification of glomerular diseases by etiologic category
Classification of glomerular diseases by etiologic category showed the following distribution: primary (941 cases, 80.8%), secondary (142 cases, 12.2%), unknown (41 cases, 3.5%), mixed (35 cases, 3.0%), and hereditary (5 cases, 0.4%). For primary GN, IgAN (523 cases, 55.6%) accounted for the highest, followed by FSGS (75 cases, 8.0%) and focal glomerulosclerosis (66 cases, 7.0%) (Table 6). In secondary GN, DMN (109 cases, 76.8%) was the most common, followed by lupus nephritis (10 cases, 7.0%) (Table 6). Among mixed GN, diffuse glomerulosclerosis (27 cases, 77.1%) was predominant. Hereditary GN included type IV collagen disease (4 cases, 80.0%) and focal and segmental thinning of glomerular basement membrane (1 case, 20.0%).
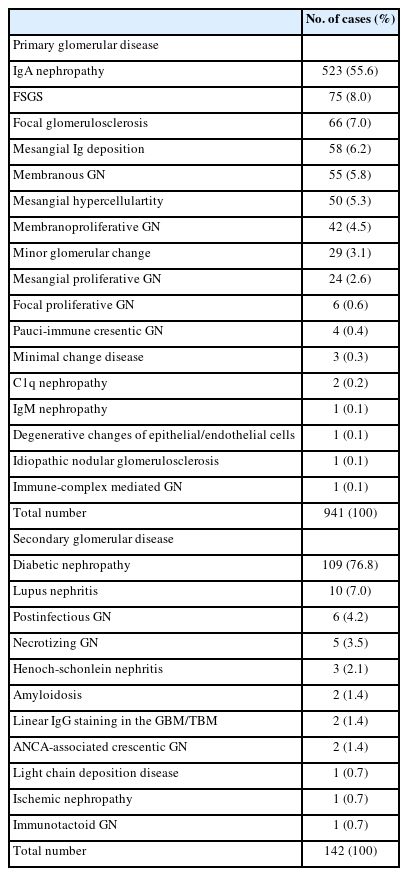
Classification of transplant biopsies according to diagnostic categories of primary (n = 941) and secondary (n = 142) glomerular diseases
Pathologic diagnostic entities of tubulointerstitial disease in transplant biopsy
In transplant biopsies, 1,812 cases (25.7%) were diagnosed as tubulointerstitial diseases in 701 recipients (Table 7). The most prevalent was interstitial fibrosis/tubular atrophy (IF/TA) (971 cases, 53.6%), followed by acute tubular necrosis (483 cases, 26.7%) and virus infection (139 cases, 7.7%). More detailed information on tubulointerstitial diagnostic entities is available in Supplementary Table S2.
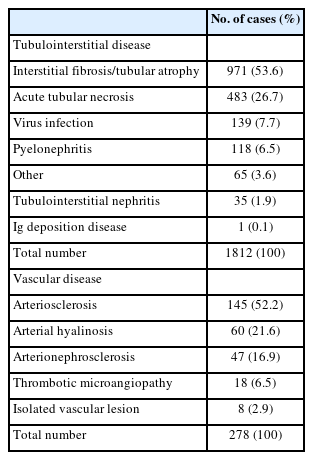
Classification of transplant biopsies according to diagnostic categories of tubulointerstitial (n = 1,812) and vascular (n = 278) diseases
Pathologic diagnostic entities of vascular disease in transplant biopsy
The number of vascular diseases was 278 cases (3.9%) diagnosed among 76 recipients (Table 7). Arteriosclerosis was the most commonly diagnosed entity (145 cases, 52.2%), followed by arterial hyalinosis (60 cases, 21.6%), arterionephrosclerosis (47 cases, 16.9%), thrombotic microangiopathy (TMA) (18 cases, 6.5%), and isolated vascular lesion (8 cases, 2.9%). More detailed information on each vascular diagnostic entity can be found in Supplementary Table S3.
Renal disease in transplant nephrectomy
A total of 176 diagnoses were made in 116 recipients who underwent transplant nephrectomy (Table 8). The mean age was 46.1 ± 11.9 years and the sex ratio was 1.42:1. When all diseases were categorized according to disease types, “Others” (60 cases, 34.1%) was the most common, followed by rejection (59 cases, 33.5%), tubulointerstitial (25 cases, 14.2%), vascular (17 cases, 9.7%), glomerular (10 cases, 5.7%), and drug toxicity (5 cases, 2.8%). The age and sex distribution of all recipients who underwent nephrectomy is shown in Fig. 2B. The number of recipients increased significantly in the 30s, passed through the 40s, peaked in the 50s, and then decreased after the 60s.

Demographic data of 116 patients who underwent transplant nephrectomy
Trends of renal disease in transplant nephrectomy
Decadal changes of nephrectomies performed for renal disease
Fig. 7 illustrates the changes in renal disease types over a 30-year period. The number of nephrectomies remained stable across the three decades: 1990s (30 recipients), 2000s (38 recipients), and 2010s (32 recipients).
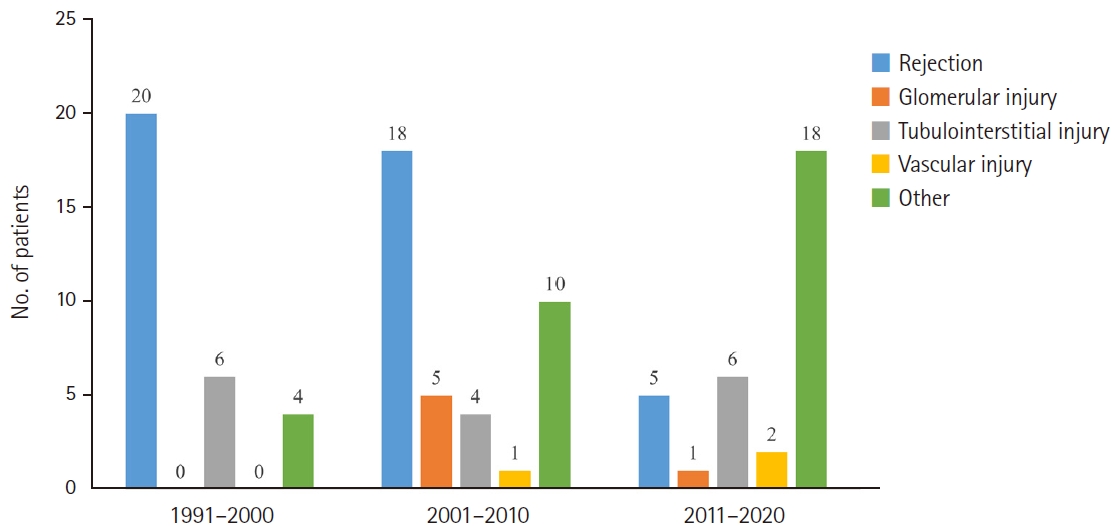
Three-decade trends in renal disease types in 100 patients undergoing transplant nephrectomy. They were analyzed for three consecutive decades (1991–2000, 2001–2010, and 2011–2020).
Decadal changes of nephrectomies classified by renal disease types
When analyzing the change in disease frequency over the 30 years, rejection in nephrectomy steadily decreased from the 1990s (20 cases, 66.7%) to the 2000s (18 cases, 47.4%) and the 2010s (5 cases, 15.6%) (Fig. 7). There were no significant changes in tubulointerstitial and vascular diseases over time. “Others” increased from the 1990s (4 cases, 13.3%) to the 2000s (10 cases, 26.3%) and the 2010s (18 cases, 56.3%).
Differences in renal disease types by age group
The distribution of renal diseases in nephrectomy specimens was analyzed by age groups (Fig. 8). All recipients younger than 20 years were diagnosed with rejection. Characteristically, the proportion of “Others” diagnosed after the 20s was 28.6% and increased with age, reaching the highest frequency (66.7%) in the ≥60 years group (p = .011). When the categories of rejection were analyzed by age (Fig. 9), TCM (40.2 ± 12.1 years) and ABM (42.9 ± 14.9 years) were found in younger recipients, while mixed category (53.5 ± 9.8 years) was found in older recipients.
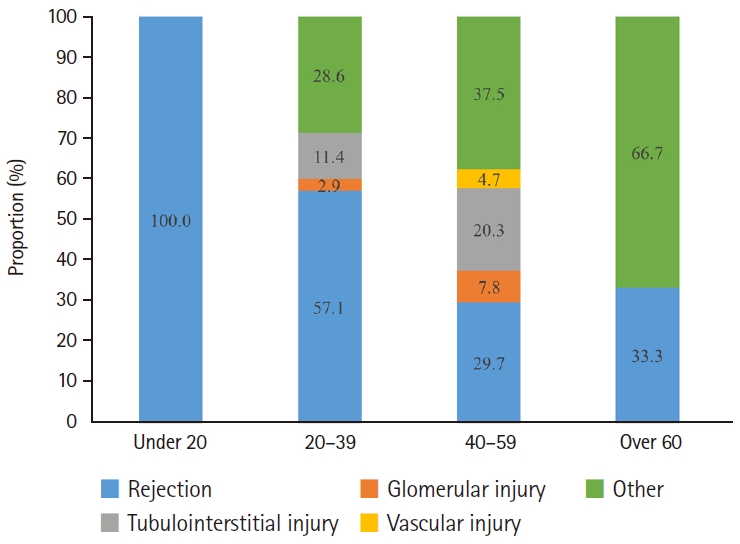
Proportional analysis of renal disease types among four age groups in transplant nephrectomies. Patients were stratified into four groups; under 20 years, 20–39 years, 40–59 years, and over 60 years. The proportion of other diseases diagnosed after the age of 20 increased with age, reaching the highest frequency in the over 60 age group (p = .011).
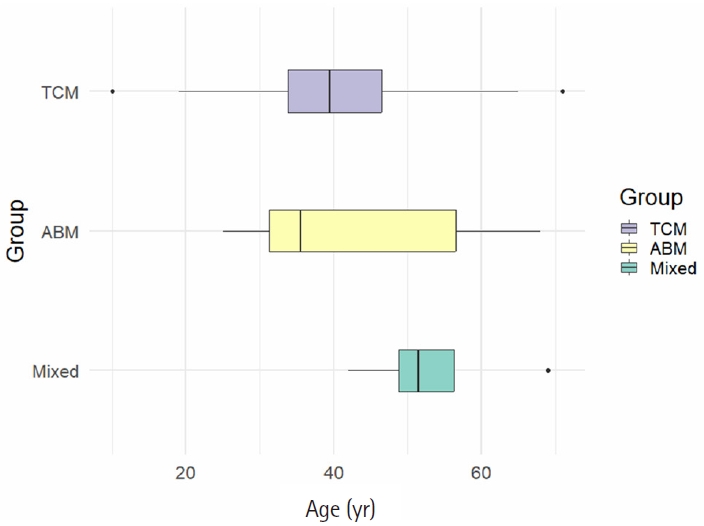
Box plot analysis of age distribution according to rejection categories in transplant nephrectomy. The mean age and standard deviation of each group was as follows: T-cell mediated (TCM) (40.2 ± 12.1 years), antibody mediated (ABM) (42.9 ± 14.9 years), and mixed (53.5 ± 9.8 years) (p = .187).
Pathologic diagnostic entities of renal disease in transplant nephrectomy
The most common diagnosis in patients who underwent nephrectomy was rejection (59 cases, 33.5%), of which chronic TCMR (24 cases, 40.7%) was the most common, followed by acute TCMR. Renal infarction was the second most common diagnosis, occurring in 35 cases (19.9%). Drug toxicity was diagnosed in five cases of calcineurin inhibitor nephrotoxicity. Among glomerular diseases (10 cases, 5.7%), chronic sclerosing GN (3 cases, 30.0%) was the most common. When glomerular diseases were classified by morphologic category, the distributions were as follows: proliferative (3 cases, 30%), non-proliferative (2 cases, 20%), and sclerosing GN (5 cases, 50%). When classified by etiologic category, the distribution of each category was as follows: primary (3 cases, 30%), unknown (3 cases, 30%), secondary (2 cases, 20%), and mixed GN (2 cases, 20%). Among the tubulointerstitial diseases (25 cases, 14.2%), IF/TA (12 cases, 48%) was the most common, followed by pyelonephritis (7 cases, 28%). The diagnoses of vascular diseases (17 cases, 9.7%) included arteriosclerosis (12 cases, 70.6%) and TMA (5 cases, 29.4%). More detailed information on each pathologic diagnostic entity is available in Supplementary Table S4.
DISCUSSION
In this study, we retrospectively analyzed all renal diseases diagnosed through pathological examination in 7,229 transplanted kidneys from 4,188 recipients over the past 33 years. Among them, rejection was a major threat to transplanted kidneys both in the biopsy (2,664 cases, 37.8%) and the nephrectomy (59 cases, 33.5%), and these findings are similar to those in a previous report [17,19-22,26]. Our study also indicated a predominance of male recipients across all disease types with the exception vascular disease in nephrectomies. Previous reports have also reported a male predominance in renal disease after transplantation [10,21,27-29].
In our biopsy group, rejection accounted for the highest proportion in all age groups, with the highest frequency of 52.6% in recipients aged 40–59 years. Furthermore, we found that TCM category (42.0±11.6 years) was predominantly observed in younger recipients compared to ABM (47.5±11.0 years) and mixed (48.1±11.7 years) (p < .001) categories. Previous studies have shown that recipients with mixed rejection (mean age, 41.9 years) were younger than those with TCMR (47.4) or ABMR (49.7) (p = .012), and exhibited the worst prognosis [21,30]. Among the rejection cases in our biopsies, TCM category was predominant (n = 1,602, 60.1%), with borderline change, indicating suspicion of acute TCMR, accounting for 34.3%, more frequently diagnosed than acute (21.3%) or chronic TCMR (4.5%). This contrasts with previous reports, which found borderline changes in biopsies from functioning allografts to be diagnosed in 9% to 13.8% of cases [19,27]. This discrepancy may be due to the fact that the protocol biopsy was performed routinely on day 14 after transplantation in this study.
Among our biopsies, TCMR (25.8%) was diagnosed more commonly than ABMR (10.4%) and mixed TCMR/ABMR (3.5%). Although the results from various studies on pathological diagnosis in transplant recipients were diverse, and rejection was the most common diagnosis [21,22,28]. A 4-year analysis of allograft biopsy reports from 2017 in Türkiye [28] revealed that acute TCMR (14.1%) was diagnosed more commonly than acute ABMR (4%) and mixed rejection (5.7%). However, data from 139 transplant recipients reported in Korea from 2006 to 2018, ABMR (41.7%) was more common than TCMR (34.5%) or mixed rejection (23.7%), where mixed rejection had the worst prognosis [21]. According to the study by Halloran et al. [22], TCMR frequently occurred in the early stages and diminished over time, and was absent after 10 years, which was hypothesized as adaptive T-cell tolerance due to long-term immunosuppression. Conversely, ABMR became common after the first month and increased over time, and was strongly associated with graft failure unlike TCMR [22]. Such discrepancies may be due to the fact that our study including all diagnosed cases regardless of graft function, whereas most other studies focused on cases with graft failure.
Many studies have documented the various causes of renal graft failure after KT [13-20], revealing considerable regional and temporal variations. Rejection was the predominant cause of allograft loss from the 1970s to the 1990s [16,18], followed by vascular thrombosis, rejection, GN, IF/TA, and polyoma virus nephropathy from the 1990s to the 2010s [13,15,18,19]. Betjes et al. [20] reported that rejection was the primary cause of graft failure, and found that TCMR was the most common in the first 5 years after transplantation, but its incidence decreased thereafter, whereas ABMR incidence increased annually by 1.1%. In a multicenter study in Australia during the 2010s, rejection was the cause of graft loss in 47.5%, with chronic ABMR (37.4%) being the most common [17]. Also, a French report on 4,783 transplant recipients in 2018 identified ABMR as the most common (31.69%) cause of graft loss [14].
The incidence of drug toxicity in our study increased with age, peaking in those over 60 years (11.9%) compared to other age groups (p = .047). Similar findings were reported in other studies, indicating that drug-induced nephrotoxicity was more frequent in recipients over 60 years with more comorbidities [31], though it was less frequent as a cause of renal allograft loss [13,14,16,17]. Calcineurin inhibitor nephrotoxicity occurred in 76.4% at 1 year and 93.5% at 5 years after transplantation [32].
The glomerular (25.0%) and tubulointerstitial diseases (22.9%) in our biopsies, constituted the highest proportions in recipients under 20 years compared to other age groups (p < .001). Compared with our native kidney data from the same period, glomerular disease was also most common in those under 20 years, whereas tubulointerstitial disease was most common in those over 60 years of age [33]. However, the incidence of tubulointerstitial diseases in transplant biopsy did not vary significantly across age groups (range, 16.5% to 22.9%). Although no studies were identified regarding tubulointerstitial disease in renal allografts in existing literature, our comparison with native kidney data revealed a higher frequency of tubulointerstitial disease in younger recipients of allograft kidneys.
Recurrent or de novo glomerular disease is an important cause of graft dysfunction and subsequent loss. When we categorized GN according to morphologic and etiologic categories in this study, proliferative (58.2%) and primary GN (80.8%) were the most common in renal graft biopsies, similar to findings from our native kidney data (proliferative [57.9%] and primary GN [72.8%], respectively) [33]. In terms of morphologic categories, recipients with proliferative or non-proliferative GN were younger (early 40s) than recipients with mixed or sclerosing GN (late 40s) in both our transplant and native kidney studies [33]. In proliferative GN, IgAN was the most common (523 cases, 76.9%). In non-proliferative GN, DMN was the most common (109 cases, 26.4%), followed by FSGS (75 cases, 18.2%), and focal glomerulosclerosis (66 cases, 16.0%). Previous studies have also shown that IgAN and FSGS are major contributors to graft failure, either recurrent or de novo [10,12,13,34-36]. In renal transplant recipients with recurrent renal disease, FSGS (26%) was reported to be the most common, followed by DMN (22%) [37]. El-Zoghby et al. [13] reported GN as the leading cause of renal graft loss (36.6%). An international, multicenter collaboration study of TANGO (Post-Transplant Glomerular Disease) reported that overall recurrence of FSGS was 32%, with a median recurrence time of 1.5 months, and 39% of them lost their graft over a median of 5 years [34]. The TANGO study also showed that the cumulative recurrence of IgAN was 19% at 10 years and 23% at 15 years, resulting in a 3.7-fold higher risk of graft loss [35]. When classified by etiology categories, recipients with primary GN were significantly younger at diagnosis compared to others in transplant kidneys (p < .001). This contrasts with our native kidney data, where the mean age of those with primary GN was not significantly different from that of secondary or hereditary GN [33].
The proportion of tubulointerstitial disease in this transplant biopsy was 17.2%, with IF/TA being the most common pathological finding. IF/TA, previously termed chronic graft nephropathy, is reported to be prevalent in approximately 40%–65% of kidney transplant recipients [38]. Chronic graft nephropathy typically occurred a median of three months after transplantation and was present in 94.2% of recipients by one year due to immunologic and ischemic results [32]. In our study, the total number of vascular disease was 278 cases (3.9%), with arteriolosclerosis accounting for the highest proportion. Although vascular disease in transplant recipients is less explored than other disease types, vascular thrombosis has been identified as a main cause for early graft failure [15,18].
In our nephrectomy kidneys, the number did not change significantly over the three decades: 1990s (30 recipients), 2000s (38 recipients), and 2010s (32 recipients)). When analyzing the change in disease frequency over the 30 years, “Others” increased from the 1990s (4 cases, 13.3%) to the 2000s (10 cases, 26.3%) and the 2010s (18 cases, 56.3%). The most common diagnosis in “Others” was renal infarction (35 cases, 58.3%). Previous studies have also reported infarction and vascular complications as major indications for transplant nephrectomy with varying incidences (8.2% [39], 10.7% [29], 15% [40]), but rejection was generally identified as the main cause [28,29,39].
The rejection in our nephrectomy decreased progressively from the 1990s (20 cases, 66.7%) to the 2000s (18 cases, 47.4%) and the 2010s (5 cases, 15.6%). Rejection was observed in 59 cases (33.5%), with chronic TCMR (24 cases, 40.7%) being the most frequent diagnosis, followed by acute TCMR (16 cases, 27.1%). Our results differ from existing reports. In an analysis of 195 transplant nephrectomy cases conducted from 2005 to 2020 [39], the principal cause was graft intolerance syndrome (26.7%), followed by acute rejection (18.5%), acute infection (15.4%), and other reasons (13.3%). In the study by Bunthof et al. [29], chronic rejection (without differentiating between TCMR and ABMR) was 49% and acute rejection was 9%.
IgAN was the most common glomerular disease in our nephrectomy cases, consistent with the findings from our native nephrectomy study [33]. A study conducted in Hong Kong from 1980 to 2004 found that IgAN was common in allograft nephrectomy cases [36]. There were no significant changes in tubulointerstitial and vascular diseases over time in our analysis. There are few studies about tubulointerstitial and vascular disease in transplant nephrectomy. One study identified renal artery thrombosis as a primary cause of early transplant nephrectomy, and chronic allograft nephropathy as a cause later in the course [40]. According to Mang et al. [39], vascular complications accounted for 8.2% of nephrectomy indications. Bunthof et al. [29] reported that hypertension and thrombosis accounted for 7.1% of graft failure causes, while nephrolithiasis accounted for 1.0%.
Limitations of this study include: First, the lack of clinical data on recipients prevented sufficient consideration of clinical factors when analyzing transplant diagnoses. Second, as it was a single-center analysis, the results may have limited and might not accurately reflect the real facts. Third, the small number of nephrectomy cases may limit the statistical validity of the results when divided into several groups for analysis. Finally, although the updated Banff classification for transplant rejection has been applied for diagnosis since 1997, a complete review and reevaluation of previous diagnoses has not been performed, which may limit its diagnostic impact.
This comprehensive analysis of allograft kidney pathology over 33 years provides valuable insights into the post-transplant renal diseases in South Korea. Our study also provides important data for understanding the pathologies diagnosed in transplanted kidneys, especially rejection and various diseases. However, it is a single-center study, so multicenter collaboration is needed to obtain more comprehensive results.
In conclusion, this study provides valuable insights into renal disease after KT in South Korea. The number of transplant biopsies increased over 33 years, but nephrectomies remained unchanged. Rejection was most common in all age groups in biopsies, but it decreased with age in nephrectomy cases. Among the rejections, the TCM category was the most common and was observed in younger recipients than the other types.
Supplementary Information
The Data Supplement is available with this article at https://doi.org/10.4132/jptm.2026.03.28.
Notes
Ethics Statement
This study was approved by the Institutional Review Board (IRB) of The Catholic University of Korea, Seoul St. Mary’s Hospital (IRB approval no. 2024-3117-0001, date of approval: 10 January 2025). It was performed in accordance with the Declaration of Helsinki. The requirement for written informed consent was waived due to retrospective nature of the study.
Availability of Data and Material
The data presented in this study are available from the corresponding author upon reasonable request.
Code Availability
Not applicable.
Author Contributions
Conceptualization: YJC. Data curation, Investigation: YJC, HN, JK. Formal analysis: HN, JK. Funding acquisition: YJC. Methodology: YJC, HN, JK. Writing—original draft: YJC, HN. Writing—review & editing: YJC, HN. Approval of final manuscript: all authors.
Conflicts of Interest
The authors declare that they have no potential conflicts of interest.
Funding Statement
This study was supported by a grant (Project Number: 9991006769, KMDF_PR_20200901_0096) of the Korea Medical Device Development Fund. It was also supported by a grant (NTIS, KMDF_RnD_20200901_0096) funded by the Korea government (the Ministry of Science and ICT, the Ministry of Trade, Industry and Energy, the Ministry of Health & Welfare, the Ministry of Food and Drug Safety).