Histologic Disorderliness in the Arrangement of Tumor Cells as an Objective Measure of Tumor Differentiation
Article information
Abstract
Background
Inter-observer and intra-observer variation in histologic tumor grading are well documented. To determine whether histologic disorderliness in the arrangement of tumor cells may serve as an objective criterion for grading, we tested the hypothesis the degree of disorderliness is related to the degree of tumor differentiation on which tumor grading is primarily based.
Methods
Borrowing from the statistical thermodynamic definition of entropy, we defined a novel mathematical formula to compute the relative degree of histologic disorderliness of tumor cells. We then analyzed a total of 51 photomicrographs of normal colorectal mucosa and colorectal adenocarcinoma with varying degrees of differentiation using our formula.
Results
A one-way analysis of variance followed by post hoc pairwise comparisons using Bonferroni correction indicated that the mean disorderliness score was the lowest for the normal colorectal mucosa and increased with decreasing tumor differentiation.
Conclusions
Disorderliness, a pathologic feature of malignant tumors that originate from highly organized structures is useful as an objective tumor grading proxy in the field of digital pathology.
Histologic tumor grading requires assessments on a continuum of morphologic alterations for which objective measuring tools may not be as easily developed as for laboratory tests. As a consequence, some subjectivity cannot be avoided, and issues such as inter-observer variability and lack of reproducibility are frequently identified as limits to the prognostic and predictive values of grading[1-5]. Various methods have been suggested to resolve these issues, employing not only conventional semi-quantitative sche mes but also relatively new approaches such as entropy- based texture analysis and fractal dimension analysis[6-12].
Although the specific criteria used for tumor grading vary by type of cancer, the strategy behind histologic grading is based primarily on the degree of tumor differentiation or the extent to which a tumor resembles the normal tissue counterpart. In this study, we hypothesized that the amount of histologic disorderliness in the arrangement of tumor cells may be quantified by adopting the concept of entropy, and that the quantified measurements would correlate with degree of differentiation.
Here, by modifying the statistical thermodynamic definition of entropy that is often taken to be a measure of disorderliness in a physical system, we develop a novel mathematical formula to compute the relative degree of histologic disorderliness of tumor cells. We then apply the formula to colorectal adenocarcinomas with varying degrees of differentiation and determine whether disorderliness is a useful feature for grading cancer.
MATERIALS AND METHODS
Theoretical background
Entropy, traditionally denoted by S, is defined as a state quantity in thermodynamics such that the infinitesimal change in entropy dS of a system during a reversible process is equal to the infinitesimal heat transfer dQ divided by the Kelvin temperature T:
Once entropy is treated in terms of the statistical behavior of molecules, the abstract concept of entropy becomes clear. The statistical definition of entropy states that entropy is proportional to the natural logarithm of multiplicity W for the given configuration of a system:
where kB is Boltzmann’s constant (1.38×10⁻²³ J/K)[13]. W is also referred to as the number of microstates and thermodynamic probability. Because the degree of disorderliness for a specific configuration of objects is generally related to the number of accessible arrangements that yield the identical configuration, entropy is often regarded as a measure of disorderliness.
Derivation of the disorderliness score formula
We borrowed the statistical definition of entropy kBlnW to quantify the amount of histologic disorderliness in the arrangement of tumor cells. During the process of quantification, we considered several factors. First, tumor cells in tissue sections do not possess thermodynamic properties such as temperature, heat and pressure. Therefore, the unit of entropy measured in Joules/Kelvin must be eliminated. Second, entropy depends heavily on the number of objects involved. For the newly defined quantity to be a useful parameter independent of the number of tumor cells, the quantity must be normalized with respect to some reference value. Additionally, it will be desirable for the measurements to be properly spaced from one another. To achieve these goals, we divide kBlnW by kBlnWeven and take the ratio to the power of γ, defining the novel disorderliness score as follows:
where γ is a contrast factor and Weven is the multiplicity when the tumor cells of a given histologic architecture are redistributed evenly throughout the tissue section. Thus defined, the disorderliness scores range from 0 to 1, with 1 being the state of complete disorderliness.
To obtain the actual value of multiplicity W in the disorderliness score formula, we subdivide a tissue section into equal unit grids with an a×b grid. In this setting, W is equal to the number of ways that N distinguishable tumor cells can be placed in ab distinguishable unit grids such that the i-th unit grid holds ni tumor cells:
where i runs from 1 to ab[14,15]. The numbering i is entirely arbitrary, provided that all the unit grids are numbered without omission. For instance, the grids may be numbered row-wise from the upper left to the lower right corner. The maximum value of W is achieved when no single ni is larger than nj+1. We define this configuration as an even distribution. For this configuration, the larger number f+1 and the smaller number f of a set of ni satisfy x(f+1)+yf=N and x+y=ab, where f is the greatest integer not exceeding N/ab, x is the number of unit grids with f+1 tumor cells and y is the number of unit grids with f tumor cells. Solving the equations for x and y, we obtain x=N–abf and y=ab(f+1)–N. Therefore,
Substituting W and Weven into the definition of disorderliness score formula above, we obtain the final form:
where N>1.
Tissue samples
A total of 48 cases, including 16 each of well-, moderately, and poorly differentiated colorectal adenocarcinomas resected between January 2011 and February 2012, were retrieved randomly from the archives of the Department of Pathology at Seoul St. Mary’s Hospital. Cases with histories of radiation exposure and/or chemotherapy were excluded. The patients’ gender and age at the time of surgery were not noted. Forty-eight representative tissue images, one of each colorectal adenocarcinoma, were taken using a microscope-mounted optical camera with a resolution of 1,360×1,024 pixels at a ×400 magnification such that each single image was filled with a uniform histologic pattern. Ten representative images of randomly chosen tissue sections of normal colorectal mucosa were also prepared using the same camera and microscope settings. The use of all samples was approved by the Institutional Review Board of Seoul St. Mary’s Hospital, The Catholic University of Korea.
Pathologic evaluation
Four pathologists, blinded to the original diagnoses, independently assessed tumor differentiation for the 48 tissue images of colorectal adenocarcinoma using a 3-tiered grading system. The pathologists’ assessments of 14 well-, 13 moderately, and 14 poorly differentiated adenocarcinomas coincided, whereas there was disagreement on the classification of seven tissue sections, which were thereafter excluded from the study. Finally, tumor differentiation was evaluated in 10 images of normal colorectal mucosa and 41 images of colorectal adenocarcinoma according to disorderliness score.
Counting tumor cells and calculating a disorderliness score
Automated counts of the numbers of cells in tissue images by image analysis software programs are unreliable. Accordingly, we employed a semi-automated method. First, after opening each stored digital image using Photoshop ver. 7.0 (Adobe Systems Inc., Mountain View, CA, USA), we marked each tumor cell with a 9-pixel-diameter black dot on a separate blank layer and saved the dotted layer with a filename different from that of the original tissue image.
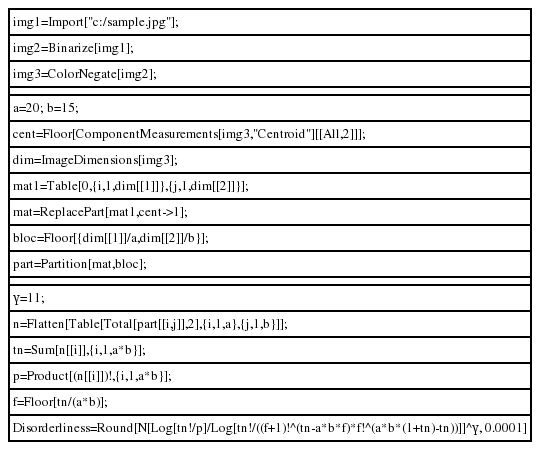
When counting the number of the dots and calculating a disorderliness score, we utilized the image analysis and computational capability of Mathematica ver. 9 (Wolfram Research Inc., Champaign, IL, USA). Mathematica commands used to obtain disorderliness score are provided in Table 1. The first three lines import a dotted image stored in a preferred directory of a computer and invert the image colors, producing white dots on a black background. The second group of command lines creates a matrix with a dimension equivalent to the image resolution, assigning the number 1 to the entries relevant to the coordinates of the centers of the dots and 0 to the rest of the entries. The matrix is then partitioned into submatrices by a 20×15 grid, resulting in a total of 300 submatrices. The third command group takes the sum of the entries of each submatrix, which corresponds to ni, inputs those sums into the formula and returns a disorderliness score. Here, we set the contrast factor γ to 11 for convenience.
Statistical analysis
The normality of the data was explored using the Shapiro-Wilk test and the equality of variances was assessed using Levene’s test. One-way analysis of variance (ANOVA) was used to evaluate differences in the means among the data groups. When warranted, post hoc tests using Bonferroni correction were conducted for pairwise comparisons. A two-sided p-value of less than .05 was considered to be statistically significant. All statistical analyses were performed using the software package SPSS ver. 21.0 (SPSS Inc., Chicago, IL, USA).
RESULTS
Disorderliness scores of a series of simulations of cancerous conditions
Before analyzing actual colorectal adenocarcinoma samples, we applied the disorderliness score formula to a series of digitally altered normal colonic mucosa samples simulating cancerous conditions to determine whether the disorderliness score behaves as intended.
The glandular cells of normal tissue shown in Fig. 1A are represented by black dots on a white background in Fig. 1B, and the disorderliness score was calculated to be 0.3168. Simulated cancerous configurations are illustrated in Figs. 1C through 1F. We first distorted the glands in Fig. 1B to represent a malignant tumor (Fig. 1C). The distorted configuration yielded a disorderliness score 0.3677. We marked some additional dots mimicking cell stratification in the vicinity of the altered glands (Fig. 1D). To simulate infiltration of tumor cells into the stroma, we displaced some of the dots away from the initial location without adding new dots (Fig. 1E) and then placed additional dots to represent a diffuse infiltrative behavior (Fig. 1F). These altered arrangements yielded disorderliness scores of 0.4286, 0.5434 and 0.7177 respectively. Scores were rounded up to the fourth decimal place. The results of the simulations demonstrated that the disorderliness score increased steadily in accordance with decreasing tumor differentiation.
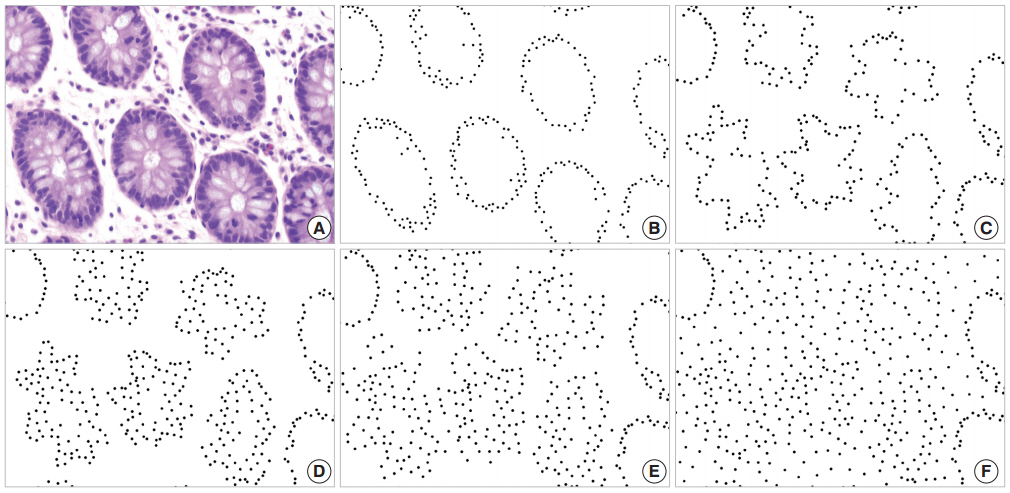
Disorderliness scores of normal colorectal mucosa and a series of simulations of cancerous conditions. (A) Normal colorectal mucosa. (B) Each glandular cell in panel A is converted to a black dot on a white background for semi-automated cell counting; disorderliness score 0.3168. (C) Distorted glands altered from B; disorderliness score 0.3677. (D) A simulation of cell stratification; disorderliness score 0.4286. (E) A simulation of infiltration of tumor cells into the stroma; disorderliness score 0.5434. (F) More diffuse infiltration of tumor cells; disorderliness score 0.7177. Note that the disorderliness score increases steadily as tumor differentiation deceases.
Disorderliness scores of normal colorectal mucosa and colorectal adenocarcinoma with varying degrees of differentiation
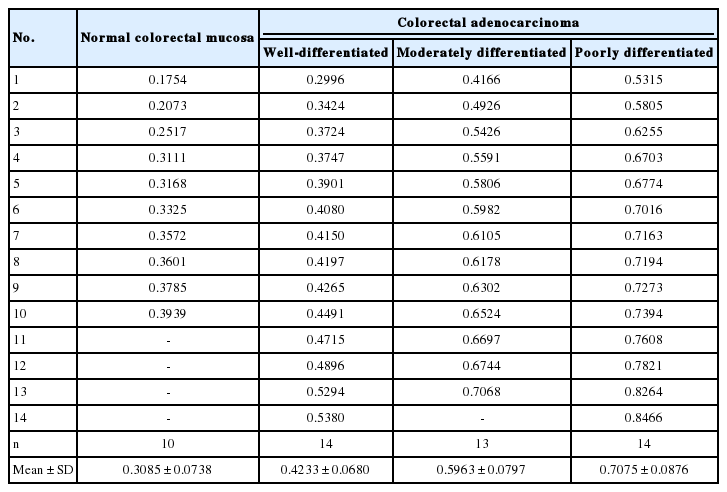
The complete list of disorderliness scores of normal colorectal mucosa and colorectal adenocarcinoma classified according to a 3-tiered grading system is presented in Table 2 along with means and standard deviations. The disorderliness scores of each group were normally distributed (p=.275, p=.961, p=.593, and p= .919 for normal colorectal mucosa and well-, moderately, and poorly differentiated colorectal adenocarcinoma, respectively) and the variances were equal across the groups (p=.904). In Fig. 2, selected images of hematoxylin and eosin stained tissue sections of the four analyzed groups are arranged with their disorderliness scores presented in the lower right corners of each image to exhibit the relationship between disorderliness scores and differentiation.
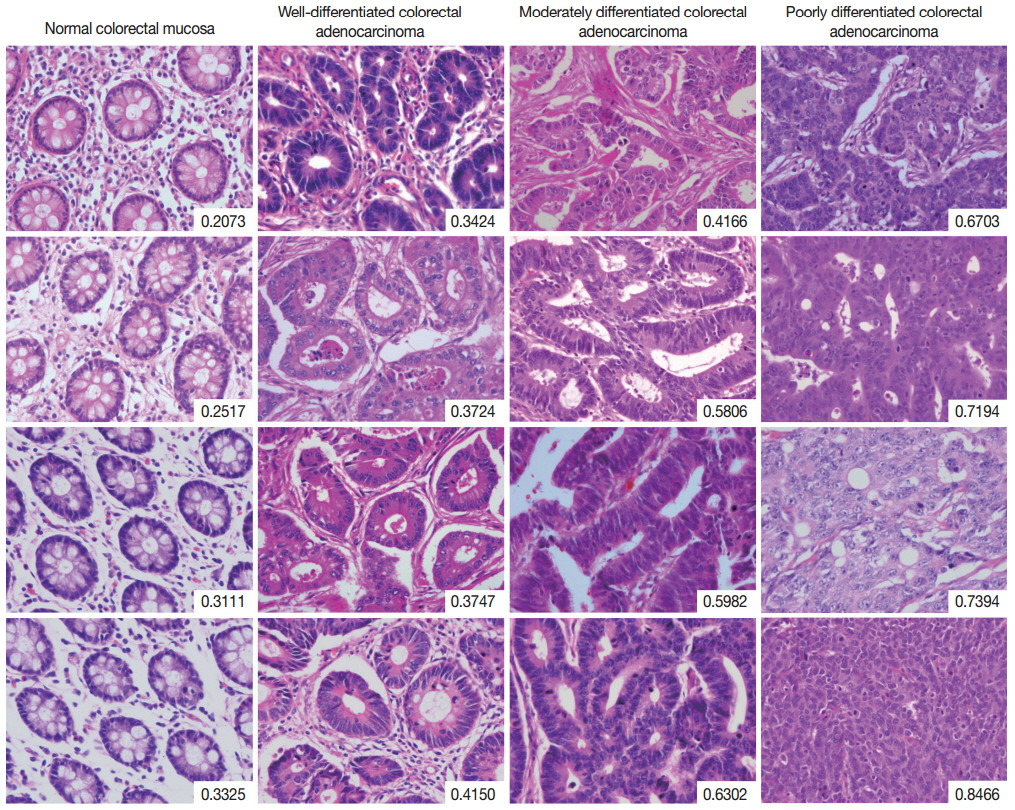
Selected images of colorectal adenocarcinoma analyzed by the disorderliness score formula. The scores are presented in the lower right corners of each image. Note the overall tendency of the disorderliness score to increase with decreasing tumor differentiation.
A one-way ANOVA determined that a significant difference was present between at least one pair of the mean disorderliness scores of the four groups (F(3, 47)=62.995, p<.001). Then, post hoc analyses using Bonferroni correction indicated that the mean disorderliness score was lowest in the normal colorectal mucosa and that a meaningful increase in the means occurred as differentiation decreased (p<.01). Error bars presented in Fig. 3 denote 95% confidence intervals for the mean disorderliness scores for graphical comparisons. Altogether, the results suggest that the disorderliness score is a characteristic parameter that can distinguish normal tissue from malignant tissue, and is a sensitive metric for identifying differences in differentiation.
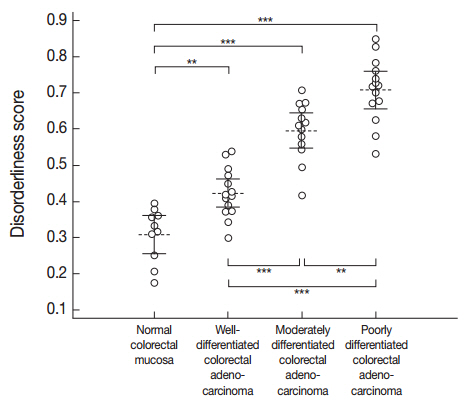
Distribution of the disorderliness scores of normal colorectal mucosa and colorectal adenocarcinoma. The horizontal dashed lines and the vertical error bars denote the mean disorderliness scores and 95% confidence intervals for the means, respectively. **p<.01, ***p<.001 by Bonferroni post hoc analysis following a one-way ANOVA.
DISCUSSION
Despite being one of the most prominent histologic features of malignant tumors, disorderliness in the arrangement of tumor cells has never been considered as a criterion of tumor grading systems for any type of cancer. This lack of attention to the histologic disorderliness in tissue specimens may be partly attributable to the difficulty inherent in visually assessing disorderliness. Motivated by the statistical thermodynamic definition of entropy, we successfully quantified the amount of disorderliness of tumor cells and demonstrated that the quantified measurements are correlated with tumor differentiation.
In the strictest sense, the disorderliness in a tissue section is not directly linked to thermodynamic entropy as it applies to an atomic or molecular system. Nevertheless, the concept of entropy is useful for describing tumor differentiation as we demonstrated and also for predicting prognosis on the basis of physical laws. Entropy is often regarded as an arrow of time because it distinguishes past and future as dictated by the second law of thermodynamics. Similarly, the disorderliness score or the macroscopic analogue of normalized entropy may be interpreted not only as a measure of tumor differentiation but also as a measure of tumor progression. Thus, from a thermodynamics point of view, we expect that prognosis is more intimately related to disorderliness in the histologic architecture of tumors than to differentiation.
It is worth mentioning some of the intrinsic properties of the disorderliness score. The disorderliness score depends on the size of a grid unit. In particular, when the length of a side of a grid unit is less than the closest distance between the centers of two adjacent tumor cells, the multiplicity W is equal to N! regardless of the architectural pattern and the resulting disorderliness score becomes 1. This outcome may initially appear problematic, but rather it shows that the disorderliness score reflects histologic disorderliness well. Depending on the scale of an architectural pattern, there is an optimal range of distance from which a meaningful spatial relationship among things can be identified. In our setting, the distance from which we observe the histologic architecture corresponds to the number of divisions of a grid. Thus, when a grid is too dense or too loose, the disorderliness score cannot recognize the architectural pattern of the tumor. After all, the size of the grid unit has to be empirically determined to aptly reflect the histologic architecture.
As is the case with the entropy of a system in a classical thermodynamic process, what counts with a disorderliness score is not the absolute value but the relative value. Furthermore, because it is meaningless to ask how many times more disordered an arrangement of tumor cells is in comparison with another, we are free to transform disorderliness scores nonlinearly to provide contrasts between scores for our convenience, provided the transformed scores are arrayed in accordance with the order of the untransformed ones. The contrast factor γ is included in the formula for this purpose.
If we had not been concerned with convenience of use, the disorderliness score could have been simplified to include only the ratio of multiplicity W to Weven. This simplification is possible because all of the information regarding histologic disorderliness is included in the ratio. However, in general, W/Weven yields an extremely small number, such that the raw value is impractical and inconvenient. On the other hand, Stirling’s approximation for factorials may be used to simplify the formula as in the case of thermodynamic systems consisting of enormous numbers of atoms and molecules. The application of this approximation to our formula, however, will return an erroneous number because there may be few or even no tumor cells in some unit grids.
In summary, we defined a novel disorderliness score with which relative degrees of histologic disorderliness can be computed. Statistical analyses demonstrated that the disorderliness score discriminates normal colorectal mucosa from malignancy and identifies differences in the differentiation of colorectal adenocarcinoma. Given that increased disorderliness is a common underlying feature of cancerous conditions, our results suggest that the concept of histologic disorderliness may serve as an objective tumor grading scheme for a wide range of tumors that originate from highly organized structures and may be used as a screening strategy for detecting potentially malignant areas in a whole slide image. For this feature to be of practical use in cancer grading, it is necessary to develop an accurate and reliable automated method for counting tumor cells in tissue sections.
Notes
No potential conflict of interest relevant to this article was reported.
Acknowledgements
We thank Dr. Han Young Yu at Electronics and Telecommunications Research Institute (ETRI), Republic of Korea for reviewing this manuscript.
