MUC2 Expression Is Correlated with Tumor Differentiation and Inhibits Tumor Invasion in Gastric Carcinomas: A Systematic Review and Meta-analysis
Article information
Abstract
Background:
While MUC2 is expressed in intestinal metaplasia and malignant lesions, the clinicopathological significance of MUC2 expression is not fully elucidated in gastric carcinoma (GC).
Methods:
The present study investigated the correlation between MUC2 expression and clinicopathological parameters in 167 human GCs. In addition, to confirm the clinicopathological significance of MUC2 expression, we performed a systematic review and meta-analysis in 1,832 GCs.
Results:
MUC2 expression was found in 58 of 167 GCs (34.7%). MUC2-expressing GC showed lower primary tumor (T), regional lymph node (N), and tumor node metastasis (TNM) stages compared with GCs without MUC2 expression (p=.001, p=.001, and p=.011, respectively). However, MUC2 expression was not correlated with Lauren’s classification and tumor differentiation. In meta-analysis, MUC2 expression was significantly correlated with differentiation and lower tumor stage (odds ratio [OR], 1.303; 95% confidence interval [CI], 1.020 to 1.664; p = .034 and OR, 1.352; 95% CI, 1.055 to 1.734; p = .017, respectively) but not with Lauren’s classification, pN stage, or pTNM stage.
Conclusions:
MUC2 expression was correlated with a lower tumor depth and lower lymph node metastasis in our study; the meta-analysis showed a correlation of MUC2 expression with tumor differentiation and lower tumor depth.
Mucin expression shows variable patterns in the gastrointestinal tract based on organ and specific conditions. Gastric markers, such as MUC1, MUC5AC, and MUC6 are expressed in the stomach, and intestinal markers, such as MUC2, may be expressed in cases of intestinal metaplasia or malignant lesions, although MUC2 is not constitutively expressed in normal gastric mucosa [1-4]. Based on the pattern of intestinal and gastric mucin expression, gastric carcinomas (GCs) are subclassified into gastric, intestinal, mixed, or null phenotypes [4]. Although many studies have reported the significance of mucin expression and mucin phenotypes and their correlation with tumor behavior and prognosis, the clinicopathological significance has not been fully elucidated in GC.
In gastric mucosa with incomplete intestinal metaplasia (type II or III), which are considered to be precancerous lesions of GC, MUC2 is expressed in both goblet and columnar cells [5,6]. In addition, MUC2-expressing GCs are believed to result from intestinal metaplasia-dysplasia-carcinoma cascades [5,6], although the complete understanding of its regulatory mechanisms and clinicopathological significance is yet to be elucidated.
In the present study, we investigated the correlation between MUC2 expression and clinicopathological parameters in 167 surgically resected GCs using tissue-microarray slides. Systematic review and meta-analysis were performed additionally to confirm the clinicopathological significance of MUC2 expression in all available studies, including the present study.
MATERIALS AND METHODS
Patients
The files of 167 patients who had undergone surgical resection of GCs in Kangbuk Samsung Hospital, Sungkyunkwan University School of Medicine (Seoul, Korea), from January 1, 1992, to December 31, 1996, were analyzed. We evaluated clinicopathological characteristics, such as age, gender, location of tumor, Lauren’s classification, tumor differentiation, lymphatic invasion, nodal metastasis, and pathologic tumor node metastasis (pTNM) stages, by reviewing medical charts, pathological records, and glass slides. The patients had undergone curative resection, subtotal gastrectomy or total gastrectomy. This protocol was reviewed and approved by the Institutional Review Board of Kangbuk Samsung Hospital (approval No. KBC12125).
Tissue array methods
Seven array blocks containing a total of 167 tissue cores of resected GCs obtained from patients were prepared. Briefly, tissue cores (2 mm in diameter) were taken from individual paraffin-embedded GCs (donor blocks) and arranged in recipient paraffin blocks (tissue-array block) using a trephine apparatus. The staining results of the different intra-tumoral areas in these tissue-array blocks showed excellent agreement. A core was chosen from each case for analysis. We defined an adequate case as a tumor occupying more than 10% of the core area. Each block contained internal controls consisting of non-neoplastic gastric tissue. Sections 4 μm in thickness were cut from each tissue-array block, deparaffinized, and dehydrated.
Immunohistochemical staining and evaluation
Sections were deparaffinized and hydrated by a routine xylene-alcohol series. For antigen retrieval, sections were treated with 0.01 M citrate buffer (pH 6.0) for 5 minutes in a microwave oven followed by treatment with 3% H2O2 to quench endogenous peroxidase. Sections were treated with normal serum of the host animal of the secondary antibody to block nonspecific binding. Sections were then incubated with anti-MUC2 antibody (1:200, Leica Biosystems, Newcastle upon Tyne, UK) as described previously [7]. Immunohistochemical stains were performed using a compact polymer method using a Bond Intense Detection Kit (Leica Biosystems). Visualization was performed by treatment with 3,3'-diaminobenzidine (Vector Laboratories, Burlingame, CA, USA). To confirm the reaction specificity of the antibody, a negative control stain without primary antibody was utilized. All immunostained sections were lightly counterstained with Mayer’s hematoxylin.
Immunohistochemical stainings were evaluated by two pathologists. MUC2 showed immunoreactivity in the cytoplasm or cell membrane of tumor cells. Immunostaining results were considered positive if more than 5% of tumor cells were stained.
Published studies search and selection criteria
Relevant articles were obtained by searching the PubMed and Web of Science databases up to September 30, 2014. Searches were performed using the following keywords: ‘MUC2,’ ‘gastric carcinoma,’ and ‘immunohistochemistry.’ The title and abstract of all searched articles were screened for exclusion. Review articles were also screened to find additional eligible studies. The search results were then scanned according to the following inclusion and exclusion criteria: (1) MUC2 expression was investigated in human GC tissue, (2) the correlation between MUC2 expression and clinicopathological parameters was included, (3) case reports were excluded, and (4) all were English-language publications.
Data extraction
Data from all eligible studies were extracted by two pathologists. The following data were extracted from each of the eligible studies: the first author’s name, year of publication, manufacturer and dilution ratio of each MUC2 antibody, MUC2 cut-off value, number of patients analyzed, tumor differentiation, and pTNM stage.
Statistical analysis
Statistical analyses were performed using SPSS ver. 18.0 (SPSS Inc., Chicago, IL, USA). The significance of the correlation between the expression of MUC2 and the clinicopathological parameters was determined by either the χ2 test or the Fisher exact test (two-sided). The results were considered statistically significant when p<.05. Moreover, to perform the meta-analysis, the Comprehensive Meta-Analysis software package (Biostat, Engelwood, NJ, USA) was used. Odds ratios (ORs) with a 95% confidence interval (CI) were calculated by a fixed-effects model and used to evaluate the correlation between MUC2 expression and clinicopathological parameters. The fixed-effect model was selected in the current meta-analysis, because we analysed correlation between immunoexpression and the clinicopathological parameters by single-effect-event (positive or negative), but not by mean. Heterogeneity between studies was evaluated with the Q test, I2 statistics and p-values. For assessment of publication bias, Begg’s funnel plot and Egger’s test were performed. The results were two-sided and considered statistically significant when p<.05.
RESULTS
Clinicopathological features of MUC2-expressing GCs
MUC2 was expressed in 58 (34.7%) of 167 GCs in the immunohistochemical study (Fig. 1). MUC2 expression was significantly higher in early GCs compared to advanced GCs (p=.001). In addition, GCs expressing MUC2 showed significantly lower rates of lymphatic invasion, lymph node metastasis, and pTNM stages (p=.010, p=.001, and p=.011, respectively). However, there was no correlation of MUC2 expression with other clinicopathological parameters such as age, gender, location of tumor, Lauren’s classification, or tumor differentiation in our study (Table 1).

Representative images showing immunoreactivity for MUC2 in human gastric carcinoma. (A, B) Well-differentiated gastric adenocarcinoma. (C, D) Poorly differentiated gastric adenocarcinoma.
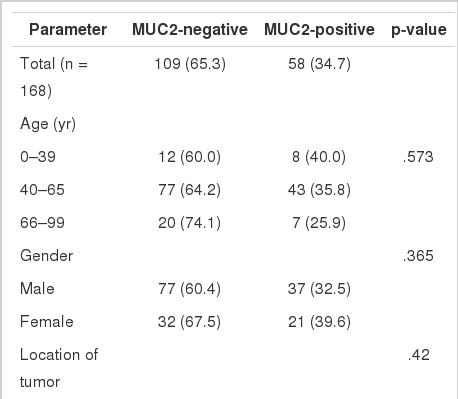
The correlation between the MUC2 expression and clinicopathological parameters in gastric carcinomas
Systematic review and meta-analysis
To confirm the clinicopathological significances of MUC2 expression, we performed a systematic review and meta-analysis. In the current meta-analysis, 195 studies were identified through database searches and were screened. Of these studies, 88 reports were excluded due to insufficient information for correlation between clinicopathological parameters and MUC2 expression. In addition, 32 reports were non-adenocarcinoma studies and 42 reports were non-stomach studies. An additional 22 reports were excluded because they were studies using animal or cell lines, duplicated reports, or case reports. The current meta-analysis included 12 eligible studies, including our data (Fig. 2) [1,3,8-16]. The number of total patients was 1,832, including 167 patients from our study.
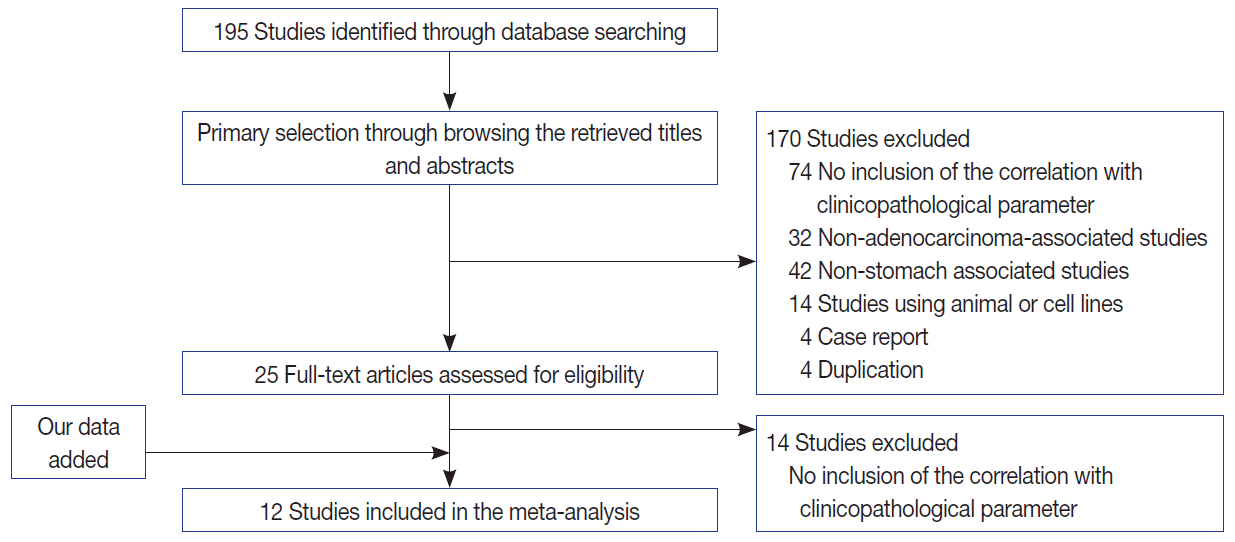
Flow chart for study search and selection.
MUC2 expression was found in 827 of 1,832 GCs (45.1%), and the range in eligible studies was 22.9%–90.7% (Table 2). MUC2 expression was significantly correlated with tumor differentiation (OR, 1.303; 95% CI, 1.020 to 1.664; p=.034; I2=79.3%) (Fig. 3A) and lower tumor depth (pT1) (OR, 1.352; 95% CI, 1.055 to 1.734; p=.017; I2=65.7%) (Fig. 4A). However, Lauren’s classification was not correlated with MUC2 expression (OR, 1.245; 95% CI, 0.933 to 1.661; p=.137; I2=83.2%) (Fig. 3B), consistent with our immunohistochemical study. Unlike our result, meta-analysis showed no significant correlation between MUC2 expression and nodal stage or TNM stage (OR, 0.872; 95% CI, 0.689 to 1.104; p=.256; I2=68.4% and OR, 1.208; 95% CI, 0.940 to 1.552; p=.139; I2=21.3%, respectively) (Fig. 4B, C). Significant heterogeneities between studies were identified in tumor differentiation, Lauren’s classification, tumor depth and nodal stage but not TNM stage. In Begg’s funnel plots, no definite asymmetry was identified (data not shown). Moreover, Egger’s test showed no evidence of publication bias (Table 3) [1,3,8-16].

Main characteristics of the eligible studies

Forest plot diagram for tumor differentiation (A) and Lauren’s classification (B). CI, confidence interval.

Forest plot diagram for pathologic primary tumor (A), regional lymph node (B), and tumor node metastasis (C) stages. CI, confidence interval.
DISCUSSION
While various mucins are expressed in GCs, the correlation between MUC2 expression and clinicopathological characteristics remains controversial. In addition, MUC2 could be expressed in benign lesions as well as GC. Therefore, a systemic review and meta-analysis is useful for the elucidation of the clinicopathological significance of MUC2 expression in GCs.
MUC2, an intestinal mucin marker, is not expressed in normal gastric mucosa [17,18], unlike other gastric mucin markers such as MUC1, MUC5AC, and MUC6 [19]. The roles of induced MUC2 expression in GC are not fully elucidated and have been controversial in previous studies. In our immunohistochemical study, MUC2 expression was significantly correlated with lower tumor depth (p=.001), lower nodal metastasis rate (p=.001), and lower pTNM stage (p=.011). Unlike our results, the correlations between MUC2 expression and pathologic primary tumor (pT), regional lymph node (pN), and pTNM stage are controversial [1,3,8-16]. These discrepancies might be caused by various factors, such as composition of tumor types and differences by country. Therefore, it is difficult to determine the clinicopathological significance of MUC2 via our study alone, which led us to analyze previous studies by systematic review and meta-analysis for confirmation of our data.
In the current meta-analysis, MUC2 expression was significantly correlated with lower pT stage, consistent with our results. In our published in vitro study data, MUC2-expressing GC cells showed lower rates of tumor invasion and migration than non-MUC2–expressing GC cells [20]. This result reinforces the finding that MUC2 expression seems to be associated with lower pT stage. On the other hand, a meta-analysis of colorectal cancer reported that MUC2 positivity was significantly correlated with higher pT3 and pT4 stages [21]. Correlation with nodal metastasis was controversial in both GC and colon cancer meta-analysis, while our current immunohistochemical study showed a correlation between MUC2 expression and lower nodal metastasis in GC. Further study is needed to define this relationship. Taken together, our results and previous reports suggest that induction of MUC2 may carry out dissimilar functions through different mechanisms according to the specific organ.
Lauren’s classification and World Health Organization tumor differentiation are usually used for evaluation of GC in practice. In the current immunohistochemical study, there were no significant correlations between MUC2 expression and Lauren’s classification or tumor differentiation. However, the current meta-analysis showed that MUC2 positivity was significantly correlated with degree of GC differentiation, unlike our result. This discrepancy might also be caused by various factors such as composition of tumor types, differences in number of cases analyzed, differences by country, and heterogeneity of MUC2 positivity. In addition, whether MUC2 expression is associated with tumor differentiation in GC has not been fully elucidated. Nevertheless, based on previous studies and meta-analysis, MUC2 expression was correlated with differentiation and progression and may be considered to be a representative feature of differentiated cells [14,22].
In the current meta-analysis, MUC2 expression was shown in 22.9%–90.7% of GCs [1,3,8-16]. This wide variability may have been induced by variable dilution ratios and manufacturers of these antibodies. In addition, various cut-off values (5%–30%) were used for evaluation of MUC2 expression, and many studies (6 of 11 studies) used a 5% cut-off value, including ours. MUC2 expression showed significantly higher rates in studies with a 5% cut-off value than other studies (p<.001, data not shown). However, the rates of MUC2 expression in subgroups with 5% cut-off value and other cut-off values overlapped at 22.9%–90.7% and 27.3%–67.4%, respectively. Whether a difference in cut-off value could have an effect on the positive rate of MUC2 expression was not clear in our current systematic review. Moreover, each study included various types of GCs and different compositions. In addition, because some studies used tissue microarray, heterogeneity of MUC2 expression should be considered. These differences may have an effect on the discrepancies of MUC2 positivity between studies. Further studies are needed for confirmation of the clinicopathological significance of MUC2 expression with more eligible criteria and a larger number of patients.
Eligible studies included studies in Korea (3 studies), Japan (3 studies), China (2 studies), Turkey (2 studies), Germany (1 study), and Italy (1 study); eight of twelve studies were conducted in East Asia. According to country, MUC2 positivity was significantly higher in Europe than in East Asia (63.7% vs. 36.8%, p<.001, data not shown). The results of meta-analysis in pT and pN stages differed between European and East Asian patients. MUC2 expression was significantly correlated with lower depth of invasion in East Asian patients but not significantly correlated in European patients (OR, 1.484; 95% CI, 1.134 to 1.941; p=.004 and OR, 0.746; 95% CI, 0.448 to 1.243; p=.261, respectively). However, there was no correlation between MUC2 expression and lymph node metastasis in both East Asian and European patients. Differences in ethnicity and country may affect the discrepancies in the roles of MUC2 expression. The precise mechanisms are not yet fully understood, and more studies including in vitro study are needed.
In conclusion, our meta-analysis showed that MUC2 expression was significantly correlated with tumor differentiation and depth. However, the correlation between MUC2 expression and other clinicopathological characteristics is controversial. Further studies are needed in order to elucidate the role of MUC2 expression as a prognostic predictor in GC.
Notes
Conflicts of Interest
No potential conflict of interest relevant to this article was reported.