Aurora Kinase A Is a Prognostic Marker in Colorectal Adenocarcinoma
Article information
Abstract
Background
Aurora kinase A (AURKA), or STK15/BTAK, is a member of the serine/threonine kinase family and plays important roles in mitosis and chromosome stability. This study investigated the clinical significance of AURKA expression in colorectal cancer patients in Korea.
Methods
AURKA protein expression was evaluated by immunohistochemistry in 151 patients with colorectal adenocarcinoma using tissue microarray blocks. We analyzed the relationship between clinicopathological characteristics and AURKA expression. In addition, the prognostic significance of various clinicopathological data for progression-free survival (PFS) was assessed. Also we evaluated copy number variations by array comparative genomic hybridization and AURKA gene amplification using fluorescence in situ hybridization in colorectal carcinoma tissues.
Results
AURKA gene amplification was found more frequently in the 20q13.2–13.33 gain-positive group than the group with no significant gain on the AURKA-containing locus. AURKA protein expression was detected in 45% of the cases (68/151). Positive staining for AURKA was observed more often in male patients (p = .035) and distally located tumors (p = .021). PFS was shorter in patients with AURKA expression compared to those with low-level AURKA expression (p < .001). Univariate analysis revealed that AURKA expression (p = .001), age (p = .034), lymphatic invasion (p = .001), perineural invasion (p = .002), and TNM stage (p = .013) significantly affected PFS. In a multivariate analysis of PFS, a Cox proportional hazard model confirmed that AURKA expression was an independent and significant prognostic factor in colorectal adenocarcinoma (hazard ratio, 3.944; p < .001).
Conclusions
AURKA could serve as an independent factor to predict a poor prognosis in Korean colorectal adenocarcinoma patients.
Aurora kinases are key mitotic regulators required for the maintenance of chromosome stability [1]. In mammalian cells, Aurora kinases consist of three members (Aurora kinase A, B, and C), which are expressed in a cell cycle-dependent fashion [1,2].
AURKA (STK15/BTAK) is a serine/threonine kinase family member involved in mitotic entry, bipolar spindle formation, centrosome maturation control, and segregation during mitosis. AURKA maps to chromosome 20q13.2, a region that is frequently amplified in several human malignant tumors [2-4], including leukemia and breast, bladder, ovarian, gastric, esophageal, liver, colorectal, and pancreatic cancers [2].
Recent studies have shown that AURKA overexpression is associated with tumorigenesis, clinical aggressiveness, and tumor progression in several cancers [1,3,5,6]. A few studies have implicated AURKA activity in oncogenic transformation through the development of chromosome instability and tumor cell heterogeneity and in tumor progression through the activation of epithelial-mesenchymal transition reprograming, which results in tumor-initiating cell generation [1,7]. Therefore, AURKA represents a valuable target for cancer therapy, and the development of small-molecule AURKA inhibitors currently undergoing advanced clinical trials may improve the clinical outcomes of cancer patients [1,5,8].
Various studies have been performed to investigate the relationship between AURKA protein expression or amplification and prognosis in solid tumor patients, including colorectal cancer (CRC) patients [4,5,9-18].
AURKA protein overexpression and amplification have been frequently observed in CRC [12]. Studies have shown that AURKA expression is associated with clinicopathological parameters and overall survival in CRC [4,5,9,12,13,15,19]. Lam et al. [13] found that Aurora kinase expression correlated with tumor location, histology, and grade; p16 expression; and telomerase activity in colorectal adenocarcinomas. Belt et al. [4] reported that high-level AURKA expression was significantly associated with recurrence in stage II or III colon cancer. In addition, Goos et al. [9] revealed that high-level AURKA expression was associated with poor overall survival in CRC liver metastasis. In contrast, Goktas et al. [15] reported that AURKA overexpression had a positive effect on survival in metastatic CRC patients.
Despite these studies, the relationship between AURKA expression and CRC progression and clinical outcomes has not been reported in Korean patients. We aimed to investigate AURKA-related genetic changes and protein expression in Korean CRC patients. The study included array comparative genomic hybridization (aCGH) for copy number variations (CNV), fluorescence in situ hybridization (FISH) for AURKA gene amplification, and immunohistochemistry for protein expression. The relationship between AURKA expression, clinicopathological characteristics, and progression-free survival (PFS) was also assessed.
MATERIALS AND METHODS
Patients and clinicopathological data
Samples from 151 patients who underwent curative surgical resection for colorectal adenocarcinomas between January 2008 and July 2012 at Jeju National University Hospital (Jeju, Korea) were examined. Patients who did not undergo curative surgical resection and those who had any forms of preoperative chemotherapy and/or radiotherapy at the time of surgical resection were excluded. Staging was performed according to the American Joint Committee on Cancer TNM Classification of Malignant Tumors, seventh edition, while the histologic type and differentiation grade of the tumor were determined using the classification system of the World Health Organization, fourth edition [14]. PFS was measured from the date of CRC surgery until the time of recurrence or last follow-up. Clinical data from the patients were collected through medical record examination. The median age of the patients was 66 years (range, 35 to 88 years). Other clinicopathological information is shown in Table 1. This study was approved by the Institutional Review Board of Jeju National University Hospital (2016-06-004).
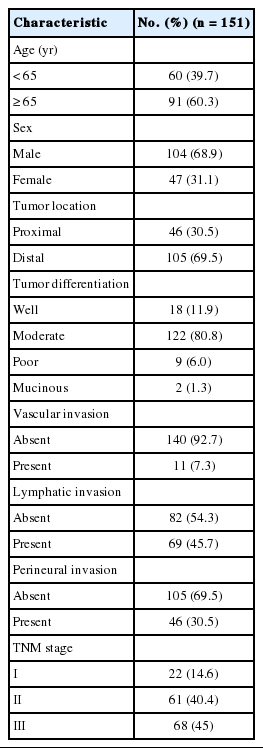
Clinicopathological characteristics of the patients
Array comparative genomic hybridization
DNA from 24 fresh tissue specimens of colorectal adenocarcinomas was analyzed versus reference DNA. Test and reference gDNAs were independently labeled with fluorescent dyes, co-hybridized to a NimbleGen Human CGH 135K Whole-Genome Tiling array (Roche NimbleGen Inc, Madison, WI, USA), and scanned using a 2 µm scanner. Log2-ratio values of the probe signal intensities (Cy3/Cy5) were calculated and plotted versus genomic position using Roche NimbleGen NimbleScan software. Data are displayed in Roche NimbleGen SignalMap software.
Fluorescent in situ hybridization
FISH analysis targeting AURKA on 20q13.2 was done on the same cases used in aCGH. Fifteen cases of formalin-fixed, paraffin-embedded tissue were tested in total; 10 cases with copy number gain on 20q13.2–13.33 and five cases with no copy number gain. The examination was performed according to the manufacturer’s instructions (Empire Genomics, Buffalo, NY, USA). Fluorescence was scored on a minimum of 20 non-overlapping nuclei in the representative tumor areas. The AURKA/CEP20 ratio was calculated by dividing the total number of AURKA signals by the total number of CEP20 signals and the cases with AURKA/CEP20 ratio≥2.0 were interpreted as positive.
Tissue microarray construction
In total, eight tissue microarrays (TMAs) were constructed as described previously [4,9]. Briefly, hematoxylin and eosin (H&E)–stained slides were reviewed and the most representative tumor area was marked. The area was carefully marked on H&E-stained slides as well as formalin-fixed, paraffin-embedded tissue blocks. A core (4 mm in diameter) of the tumor area was obtained from each specimen. One section from each block was stained with H&E for tissue confirmation.
Immunohistochemistry
Immunohistochemistry was performed on 4-μm-thick sections from TMA blocks. Tissues were stained with polyclonal anti-AURKA antibodies at a dilution of 1:200 (HPA002636, ATLAS Sigma Life Science, St. Louis, MO, USA) using an automated immunostainer (Benchmark XT, Ventana Medical Systems Inc., Tucson, AZ, USA). The primary antibody was omitted for the negative control, and the adjacent ganglion cells in the nerve bundles within each slide served as an internal reference.
AURKA protein expression
Immunoreactivity was evaluated in each TMA sample by visual counting of the tumor cells. The extent of positively stained nuclei was scored as follows: 0, positive staining in 0%; 1, <10%; 2, ≥10% and <25%; 3, ≥25% and <50%; and 4, ≥50%. Scores of 2–4 were considered positive, and scores ≤1 were considered negative [4,12,13]. To confirm reproducibility, all samples were scored by two independent observers in a blinded manner. If discrepancies occurred, a consensus score was reached.
Statistical analysis
Pearson’s chi-square test was used for categorical variables. PFS was analyzed using the Kaplan-Meier method with the log-rank test assessing differences in survival probability between groups. The prognostic significance of various clinicopathological characteristics for PFS was assessed by the Cox proportional hazard regression method. All values were based on two-sided statistical analyses; significance was set at p<.05. All statistical tests were performed with IBM SPSS ver. 21.0 (IBM Corp., Armonk, NY, USA).
RESULTS
CNVs in chromosome 20
In twenty-four cases of colorectal carcinomas, total 1,297 CNVs were detected (Fig. 1A). The locus of 20q13.2–13.33 containing AURKA gene were recurrently gained in 13 cases (54%), while only one case showed loss of the area (Fig. 1B).
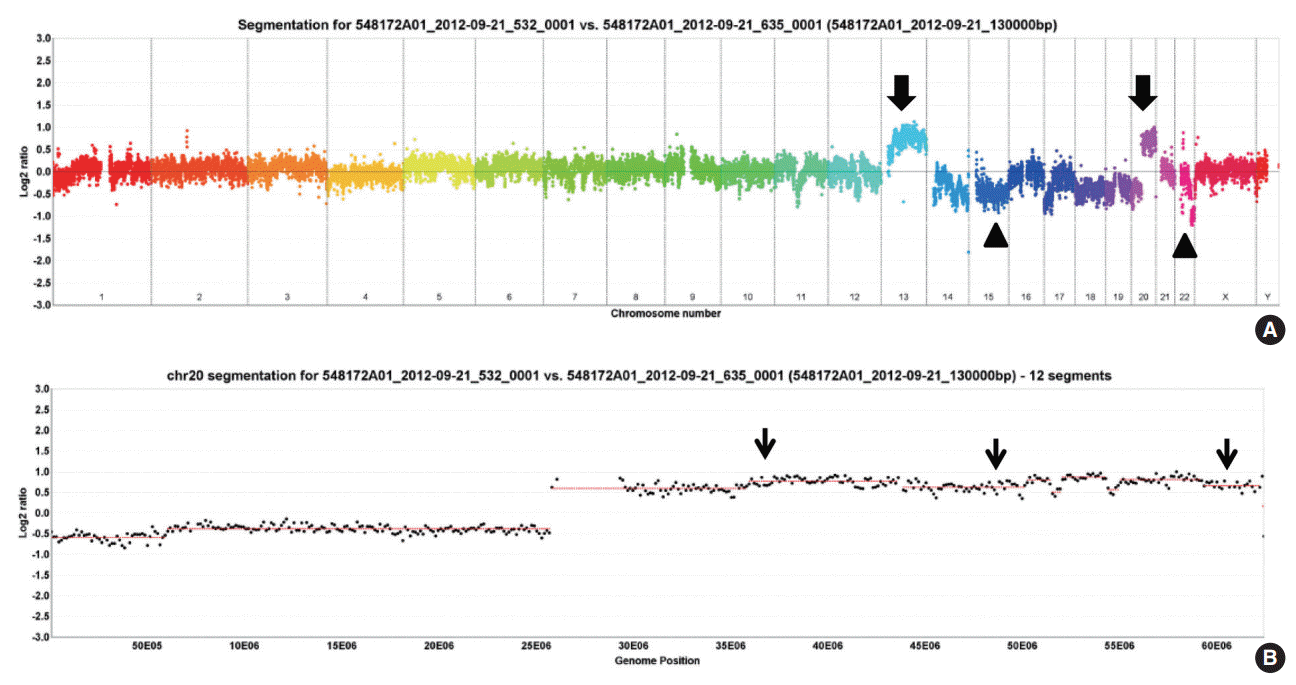
(A) Genome wide array comparative genomic hybridization using DNA from colorectal carcinoma tissue showing copy number gains (block arrows) and losses (arrowheads) on multiple sites. (B) Copy number plots of chromosome 20 showing frequent gains in certain areas (line arrows).
AURKA gene amplification status
AURKA amplification was assessed in 15 patients (group with 20q13.2–13.33 copy number gain, n=10; gain-negative group, n=5). One case of 20q13.2–13.33 gain-positive group was failed to express fluorescences. Three out of the remaining nine cases with 20q13.2–13.33 gain showed amplification of AURKA gene but none revealed gene amplification among the gain-negative group (Table 2, Fig. 2).

Relationship between 20q13.2–13.33 copy number gain and AURKA gene amplification
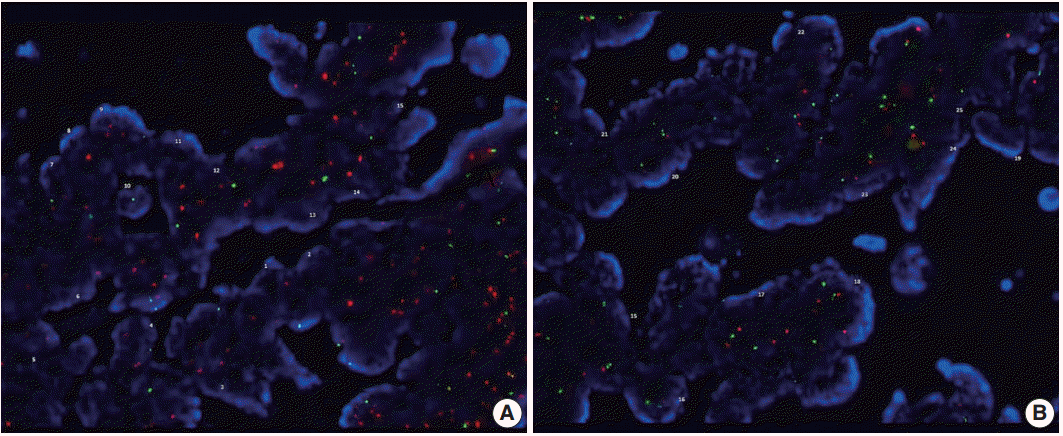
Fluorescence in situ hybridization for Aurora kinase A (AURKA) in colorectal carcinomas showing significant amplification in the 20q13.2–13.33 gain-positive case (A) and no amplification in the case with no copy number gain on 20q13.2 (B).
Relationship between AURKA expression and clinicopathological characteristics
AURKA protein was expressed in 45% of colorectal adenocarcinoma cases (68/151), while negative to faintly reactive staining was found in normal colorectal epithelial cells. The staining pattern was predominantly nuclear or nuclear and cytoplasmic (Fig. 3). Table 3 shows the relationship between AURKA expression and clinicopathological characteristics. AURKA protein expression was significantly related to patient sex, and positive AURKA staining was detected more often in male patients than in female (51.0% vs 31.9%, p=.035). In addition, AURKA expression was closely associated with tumor location, and it was more frequently found in carcinomas of the rectum, sigmoid colon, and descending colon than in carcinomas of proximal colon (51.4% vs 30.4%, p=.021). AURKA protein expression was not significantly correlated with age; tumor differentiation; vascular, lymphatic, and perineural invasion; or TNM stage.
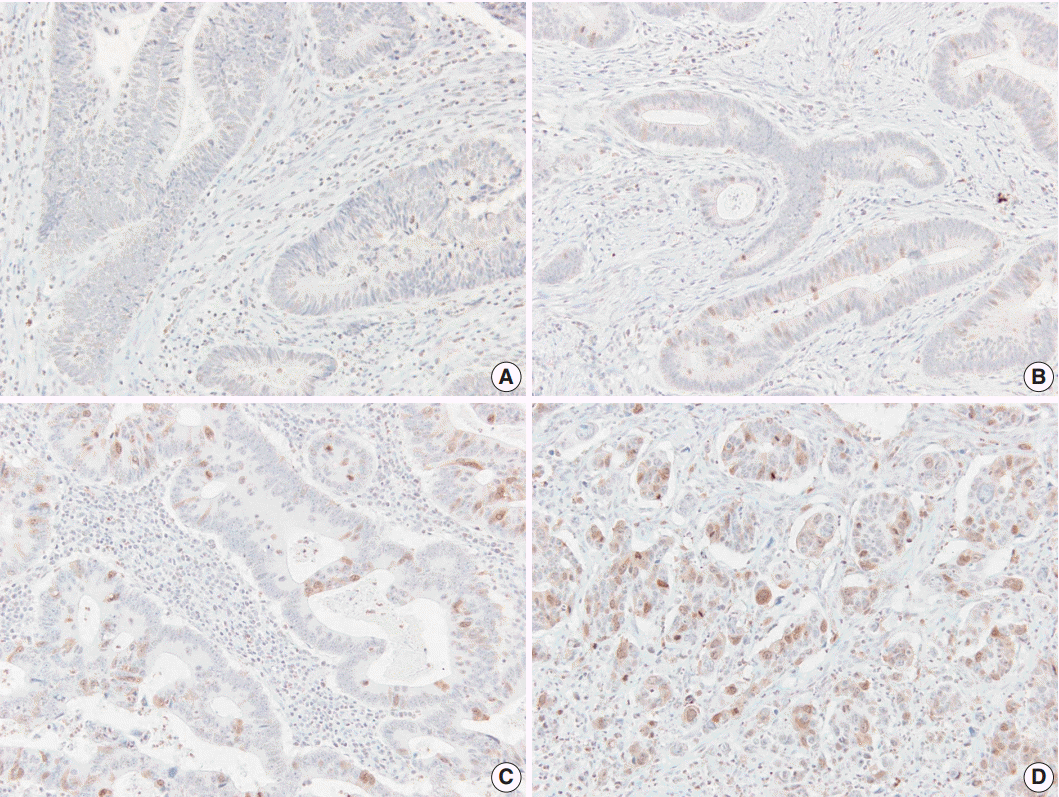
Immunohistochemical staining with Aurora kinase A (AURKA). (A) Score 1, positive staining in <10%. (B) Score 2, positive staining in ≥10% and <25%. (C) Score 3, positive staining in ≥25% and <50%. (D) Score 4, positive staining in ≥50%.

The relationship between Aurora kinase A expression and the clinicopathological characteristics of colorectal cancer patients
AURKA expression and survival analysis
The mean follow-up time of the patients in this study was 1,269 days (range, 8 to 2,892 days). In total, 23.8% of the patients (n=36) had recurred (AURKA-positive group, n=27; AURKA-negative group, n=9). The recurrence rate was significantly higher in the AURKA-positive group compared to the negative group (39.1% vs 11%, p<.001).
The mean overall PFS time was 74.6 months (range, 68.6 to 80.7 months). The AURKA-positive patients had a significantly poorer PFS than the AURKA-negative patients (p<.001). A univariate analysis demonstrated that AURKA expression (p=.001) (Fig. 4A), age (p=.034), lymphatic invasion (p=.001) (Fig. 4B), perineural invasion (p=.002) (Fig. 4C), and TNM stage (p=.013) (Fig. 4D) significantly affected PFS. In a multivariate analysis of PFS, a Cox proportional hazard model confirmed that AURKA expression was an independent and significant prognostic factor in colorectal adenocarcinoma (hazard ratio, 3.944; 95% confidence interval [CI], 1.821 to 8.542; p<.001) (Table 4). Perineural invasion was also identified as a significant prognostic factor (hazard ratio, 2.037; 95% CI, 1.017 to 4.079; p=.045) (Table 3).

The relationships between Aurora kinase A (AURKA) expression (A), lymphatic invasion (B), perineural invasion (C), TNM stage (D) and progression-free survival were analyzed using the Kaplan-Meier method with the log-rank test to assess the differences in survival probability between the groups.

Results of the multivariate Cox regression analysis of progression-free survival
DISCUSSION
CRC is among the most common malignancies [13] and is the leading cause of cancer mortality in the world [20]. The identification of genes correlated with carcinogenesis and the research to silence these genes can improve the patient care by more accurately predicting the prognosis and selecting the most appropriate adjuvant therapy [13,15].
The role of Aurora kinases in mitosis and tumorigenesis is well documented [12,20,21]. AURKA is required for mitotic entry, chromosome alignment, and cytokinesis, and its abnormal function can result in aberrant cell division and aneuploidy, which in turn increase genomic instability and contribute to carcinogenesis [15,22]. Further, AURKA is an oncogene that contributes to colorectal adenoma to carcinoma progression and is associated with the malignant transformation of colorectal adenomas but not with serrated neoplasia progression [21,22].
Chromosomal abnormalities in CRC have been studied by multiple groups using either CGH or aCGH. This has led to the discovery of many chromosomal aberrations, including gains and losses. Particularly common findings are gains in 20q, 13q, 7p, and 8q and losses in 17p, 18q, 8p, 4q, and 5q [23]. Orsetti et al. [24] reported that most commonly altered regions (gains or losses in ≥ 35% of the samples) are gains at chromosomes 7p, 7q, 8q, 13q, 20 and losses at 8p, 17p, and 18 in the CRC. In this study, 20q13.2–13.33 copy number gain is recurrently observed in 13 cases (54%), which is consistent with the previous results.
We also assessed AURKA amplification using FISH in two subgroups. The gene amplification is observed more frequently in the copy number gain group (three cases out of nine), than the group with no significant gain on the AURKA-containing locus. However, the data could not be analyzed statistically, due to a small number of cases. Further large-scale studies are required to assess the differences between the two groups.
A small number of reseachers have reported FISH result for AURKA gene amplification in various malignancies, such as melanomas and cancers of breast and prostate [25-28]. No reports on FISH for AURKA gene amplification in colorectal carcinoma tissue were found in the English literature in spite of a thorough searching.
Zhang et al. [29] demonstrated an increased AURKA gene copy number in 32.1% of advanced CRCs (43/134), and Casorzo et al. [22] reported AURKA gene overexpression in 85% of adenomas (17/20) containing invasive carcinoma of the colorectum, corresponding to early invasive carcinoma. In a previous study, 69% of metastatic CRC samples (41/59) showed an increased gene copy number [12].
AURKA protein overexpression and gene amplification are common in CRCs [4,9,12,13,15,19-22,29,30]. In this study, we detected AURKA overexpression in 45% of colorectal adenocarcinoma samples (71/151) using immunohistochemistry. Similarly, Lam et al. [13] reported AURKA protein expression in 48.5% (97/200) of CRC samples. In other studies, 33% (9/20) [12] and 82.5% (33/40) [15] of metastatic CRC samples showed AURKA overexpression.
In our study, AURKA expression was related to patient sex and tumor location, along with several other clinicopathological parameters. Tumor location, histology, and grade were correlated with AURKA protein expression in the report by Lam et al. [13] Baba et al. [19] reported that AURKA expression was inversely associated with a family history of CRC and not correlated with tumor location, grade, histologic component, or stage. Goktas et al. [15] found a significant relationship between AURKA expression and the histologic grade of the tumor tissue.
These discrepancies in AURKA expression may not only be caused by the heterogeneity of the study groups (e.g., patient number, patient characteristics, and disease stage), but also by differences in various technical conditions.
Some authors reported that AURKA expression is correlated with clinicopathological factors in other malignancies. For example, positive AURKA expression was closely correlated with TNM stage in gastric cancer [10] and with initial clinical stage, Ki-67 labeling index, and the recurrence rate in triple-negative breast cancer [14]. Ogawa et al. [11] reported that perimembrane AURKA staining was significantly related to a higher pathologic stage and higher proliferative activity.
A few previous studies have investigated the prognostic impact of AURKA expression in CRC patients [4,9,15]. Belt et al. [4] suggested that high-level AURKA expression was significantly associated with recurrence in stage II or III colon cancer. Goos et al. [9] revealed that high-level AURKA expression was associated with poor overall survival in CRC patients with liver metastasis. In contrast, Goktas et al. [15] reported that AURKA overexpression may have a positive effect on survival in metastatic CRC. We analyzed the correlation between AURKA expression and survival in patients with CRC. Our data demonstrate that AURKA expression in CRC patients is associated with poor PFS. Moreover, our Cox model analysis indicated that AURKA expression is a prognostic factor for poor PFS in CRC patients. However, overall survival analysis could not be performed due to a short follow-up period.
Recent studies have shown that AURKA inhibitors have anticancer activity in various preclinical cancer models, and some inhibitors have entered clinical trials [1,8]. Such studies have underlined the incremental therapeutic efficacy of combining AURKA inhibitors with conventional anti-cancer drugs to inhibit tumor progression and restore chemosensitivity [1]. Our results suggest that targeted treatment with AURKA inhibitors can improve PFS and assist in planning the treatment of CRC patients.
In summary, AURKA expression was significantly associated with patient sex and CRC location, and it was an independent molecular prognostic factor for poor outcome in CRC patients. Thus, AURKA expression may serve as a valuable prognostic marker for CRC.
Notes
Conflicts of Interest
No potential conflict of interest relevant to this article was reported.
Acknowledgements
The fresh tissue specimens and data of colorectal adenocarcinomas were provided by the Biobank of Jeju National University Hospital (A-03).