Post-mortem assessment of vimentin expression as a biomarker for renal tubular regeneration following acute kidney injury
Article information

Abstract
Background
Acute kidney injury (AKI) is a common cause of morbidity and mortality. It mainly targets the renal tubular epithelium with pathological changes, referred to as acute tubular injury. The latter is followed by a regenerative response that is difficult to visualize on routine hematoxylin and eosin (H&E) stains. In this study, we examined the regenerative capacity of renal tubules by correlating vimentin (VIM) immunohistochemical (IHC) expression and pathological findings of AKI and renal tubular regeneration (RTR) on H&E.
Methods
We reviewed 23 autopsies performed in the clinical setting of AKI and RTR. VIM expression was scored in the renal cortical tubular epithelium using a statistical cutoff ≥ 3% for high expression and < 3% for low expression.
Results
Of the 23 kidney tissues examined, seven (30.4%) had low VIM expression, and 16 (69.6%) had high VIM expression. Kidney tissues with evidence of AKI and RTR had significantly higher VIM expression. Renal peritubular microenvironment features showing regenerative changes on H&E were associated with high VIM expression. In the univariate model, kidney tissues with RTR were 18-fold more likely to have high VIM expression.
Conclusions
In conclusion, our findings suggest that VIM could serve as an IHC marker for RTR following AKI. However, correlation with H&E findings remains critical to excluding chronic tubular damage. Collectively, our preliminary results pave the way for future studies including a larger sample size to validate the use of VIM as a reliable biomarker for RTR.
Acute kidney injury (AKI) is a clinical scenario in which there is sudden loss of renal function. The term AKI recently has replaced “acute renal failure” (ARF), which was first described by William Heberden in 1802 as “ischuria renalis” [1,2]. It is characterized by oliguria and rapid development of azotemia [3]. This clinical entity usually is initiated and caused by hypovolemia and/or hypotension and frequently is associated with multiorgan failure [4]. In the United States, numerous studies have focused on analysis of data from the International Classification of Disease coding to measure the incidence of AKI in different clinical settings, with results showing increased incidence over time. The “Kidney Disease: Improving Global Outcomes” (KDIGO)-based criteria used to analyze the epidemiology of AKI might yield a much higher estimated incidence of AKI than the code-classified criteria [5,6]. Due to the absence of standardized classification criteria for AKI, there are many variations in the reported incidence and prevalence rates among hospitalized patients, ranging from < 1% to 66% [7].
Different etiologies contribute to the development of AKI, mainly leading to a rapid decline in glomerular filtration rate. Those include a decrease in renal blood flow in the case of prerenal AKI [4] or other causes in the settings of intrinsic renal or postrenal AKI. The kidneys are most vulnerable to hypoperfusion when autoregulation is impaired. This is seen frequently in elderly patients; patients with atherosclerosis, hypertension, diabetes, or early chronic kidney disease, where arterial and arteriolar nephrosclerosis are present; and patients who are receiving angiotensin receptor blockers or angiotensin-converting enzyme inhibitors [8,9]. The syndrome of AKI is most frequently due to prerenal failure as a result of volume depletion, where renal parenchymal injury is seen not commonly, or intrinsic causes reflected by acute tubular necrosis (ATN) secondary to ischemic or toxic insults [10]. Since necrosis is not evident always, there have been calls to substitute the term “acute tubular injury” (ATI).
The morphologic changes seen in ATI vary according to the severity of tubular damage. Mild changes include tubular dilation, loss of the proximal tubular brush border, and apical blebbing, particularly in the S3 segment of the proximal tubule. Indeed, the proximal tubule is the most susceptible site to injury [11]. The severe forms of ATI manifest from individual cells to confluent necrosis. Detachment from the basement membrane and shedding of proximal tubular epithelial cells with luminal accumulation of necrotic debris in distal tubular segments are characteristic of this entity [4,12]. However, renal tubules have a remarkable capacity to regenerate lost cells, usually within less than a week [13]. It is suggested in the literature that restoration of lost renal tubular cells is secondary to regeneration of the tubular epithelium [14]. Histopathological analysis of the kidney tissue distinguishes four stages of the renal tubular regeneration (RTR) process [15]. In the first stage, there is inflammation and death of the tubular epithelium via apoptosis, necrosis, or other death mechanisms. In the second stage, tubular epithelial cells undergo changes, such as a loss of brush border, tubular flattening, and rapid loss of cell polarity [16,17]. In this stage, cells change from the epithelial to mesenchymal phenotype in a process known as epithelial-to-mesenchymal transition (EMT) and overexpress vimentin (VIM) [18,19]. Regenerating cells are characterized by cytoplasmic basophilia, karyomegaly, and nuclear crowding along the affected tubule segment [20]. In the third stage, enhanced proliferation of most kidney cells occurs through increased levels of growth factors, including insulin like growth factor 1, hepatocyte growth factor, and fibroblast growth factors [21]. Lastly, maturation of epithelial cells occurs with restoration of nephron function [22].
The regenerative features of AKI/ATI are difficult to appreciate on routine light microscopy. The present study expands the assessment of the regenerative capacity of renal tubules in patients with AKI/ATI. We correlated the expression of VIM, a marker of RTR, with clinical and morphologic variables in individuals with varying degrees of AKI. Our results indicate that VIM expression is observed consistently in both AKI and chronic kidney disease (CKD). However, VIM labeling, in areas devoid of fibrosis and other signs of chronic damage, can serve as an immunohistochemical (IHC) biomarker to estimate AKI-associated regenerative responses in autopsies and potentially in surgical biopsies.
MATERIALS AND METHODS
Study design and setting
We conducted a retrospective 10-year review (2010–2020) of all adult autopsies performed at Mount Sinai Medical Center of Florida, with cause of death related to hypoperfusion. Exclusion criteria were (1) death related to trauma, (2) death during surgery, and (3) complete autolysis of kidney tissues. Clinicopathological parameters of the patients were retrieved from electronic pathology and medical records. The variables collected were age, gender, cause of death (cardiac, respiratory, stroke, sepsis, among others), CKD, CKD stage, fold estimated glomerular filtration rate (eGFR), fold creatinine, chronic hemodialysis, diabetes mellitus, hypertension, shock during hospitalization, clinical evidence of AKI/ATI, AKI type, arteriosclerosis, arteriolosclerosis, arteriolosclerosis severity, glomerulosclerosis, glomerulosclerosis severity, significant interstitial fibrosis, interstitial fibrosis severity, tubular atrophy, tubular atrophy severity, pathologic evidence of AKI, tubulorrhexis, pathologic evidence of ATN, evidence of regenerating tubular epithelium, and renal peritubular microenvironment features on hematoxylin and eosin (H&E) stains (cortical) and on periodic acid–Schiff (PAS) stains (cortical).
Histopathologic evaluation
Tissue samples were fixed in neutral buffered formalin and embedded in paraffin for histologic processing. Slides of the kidney sections were stained with H&E and PAS reaction and evaluated in a blinded fashion by two independent pathologists with experience in renal pathology. No significant interobserver disagreement was noted in the interpretation between the two pathologists. Although no quantitative criteria were used to assess AKI and RTR, AKI was defined by the presence of tubular dilation, loss of the proximal tubular brush border, tubulorrhexis, and apical blebbing [4], and RTR was defined by cytoplasmic basophilia, karyomegaly, and nuclear crowding along the affected tubule segment [20]. The collective presence of those features was necessary to define AKI and RTR and was achieved by assessing tissue slides systematically and observing renal tubules within at least 10 high power fields (HPFs). Arteriosclerosis was described as thickening of the intima or media of the arteries. Arteriolosclerosis was characterized by hyalinosis of the afferent or efferent vessels and arterioles [23]. Chronic damage was estimated by evaluating tissue fibrosis including glomerulosclerosis [24], interstitial fibrosis, and tubular atrophy, defined as reduced size of tubules with attenuation of the luminal epithelium [25]. Autolysis was characterized by ghost cells with pyknotic or absent nuclei [26]. Fragmentation/duplication of the basement membrane and thickened basement membrane were recorded.
IHC staining for VIM (Ventana Medical Systems Inc., Tucson, AZ, USA) protein expression was performed using standard processing techniques. Appropriate positive and negative controls were run simultaneously. VIM expression was assessed by positive gold-brown cytoplasmic stain only in the tubular cells. Screening of the kidney tissue sections was performed in a systematic manner. In areas without chronic changes or acute tubulointerstitial inflammation, an average of approximately 30 tubules was counted randomly within 10 HPFs. Scoring was performed at 400× magnification. In non-pathological conditions, glomeruli normally stain positive for VIM [27], serving as internal positive controls in our study. A positive tubule was defined as immunoreactivity of more than 50% of the tubular epithelial cells. The percentage of VIM expression was calculated by dividing the number of tubules with ≥ 50% VIM-positive cells by the total number of tubules (approximately 30), multiplied by 100. This percentage is referred to as the VIM score. We defined our VIM positivity threshold by setting a cutoff of 3% (Fig. 1B). Evaluation was restricted to areas without advanced/obvious acute or chronic changes as VIM is expressed ubiquitously in tubular atrophy and areas of severe fibrosis. In fact, persistence of VIM+ epithelial cells in CKD likely is responsible for activating fibrogenic pathways, that is, those not part of RTR.
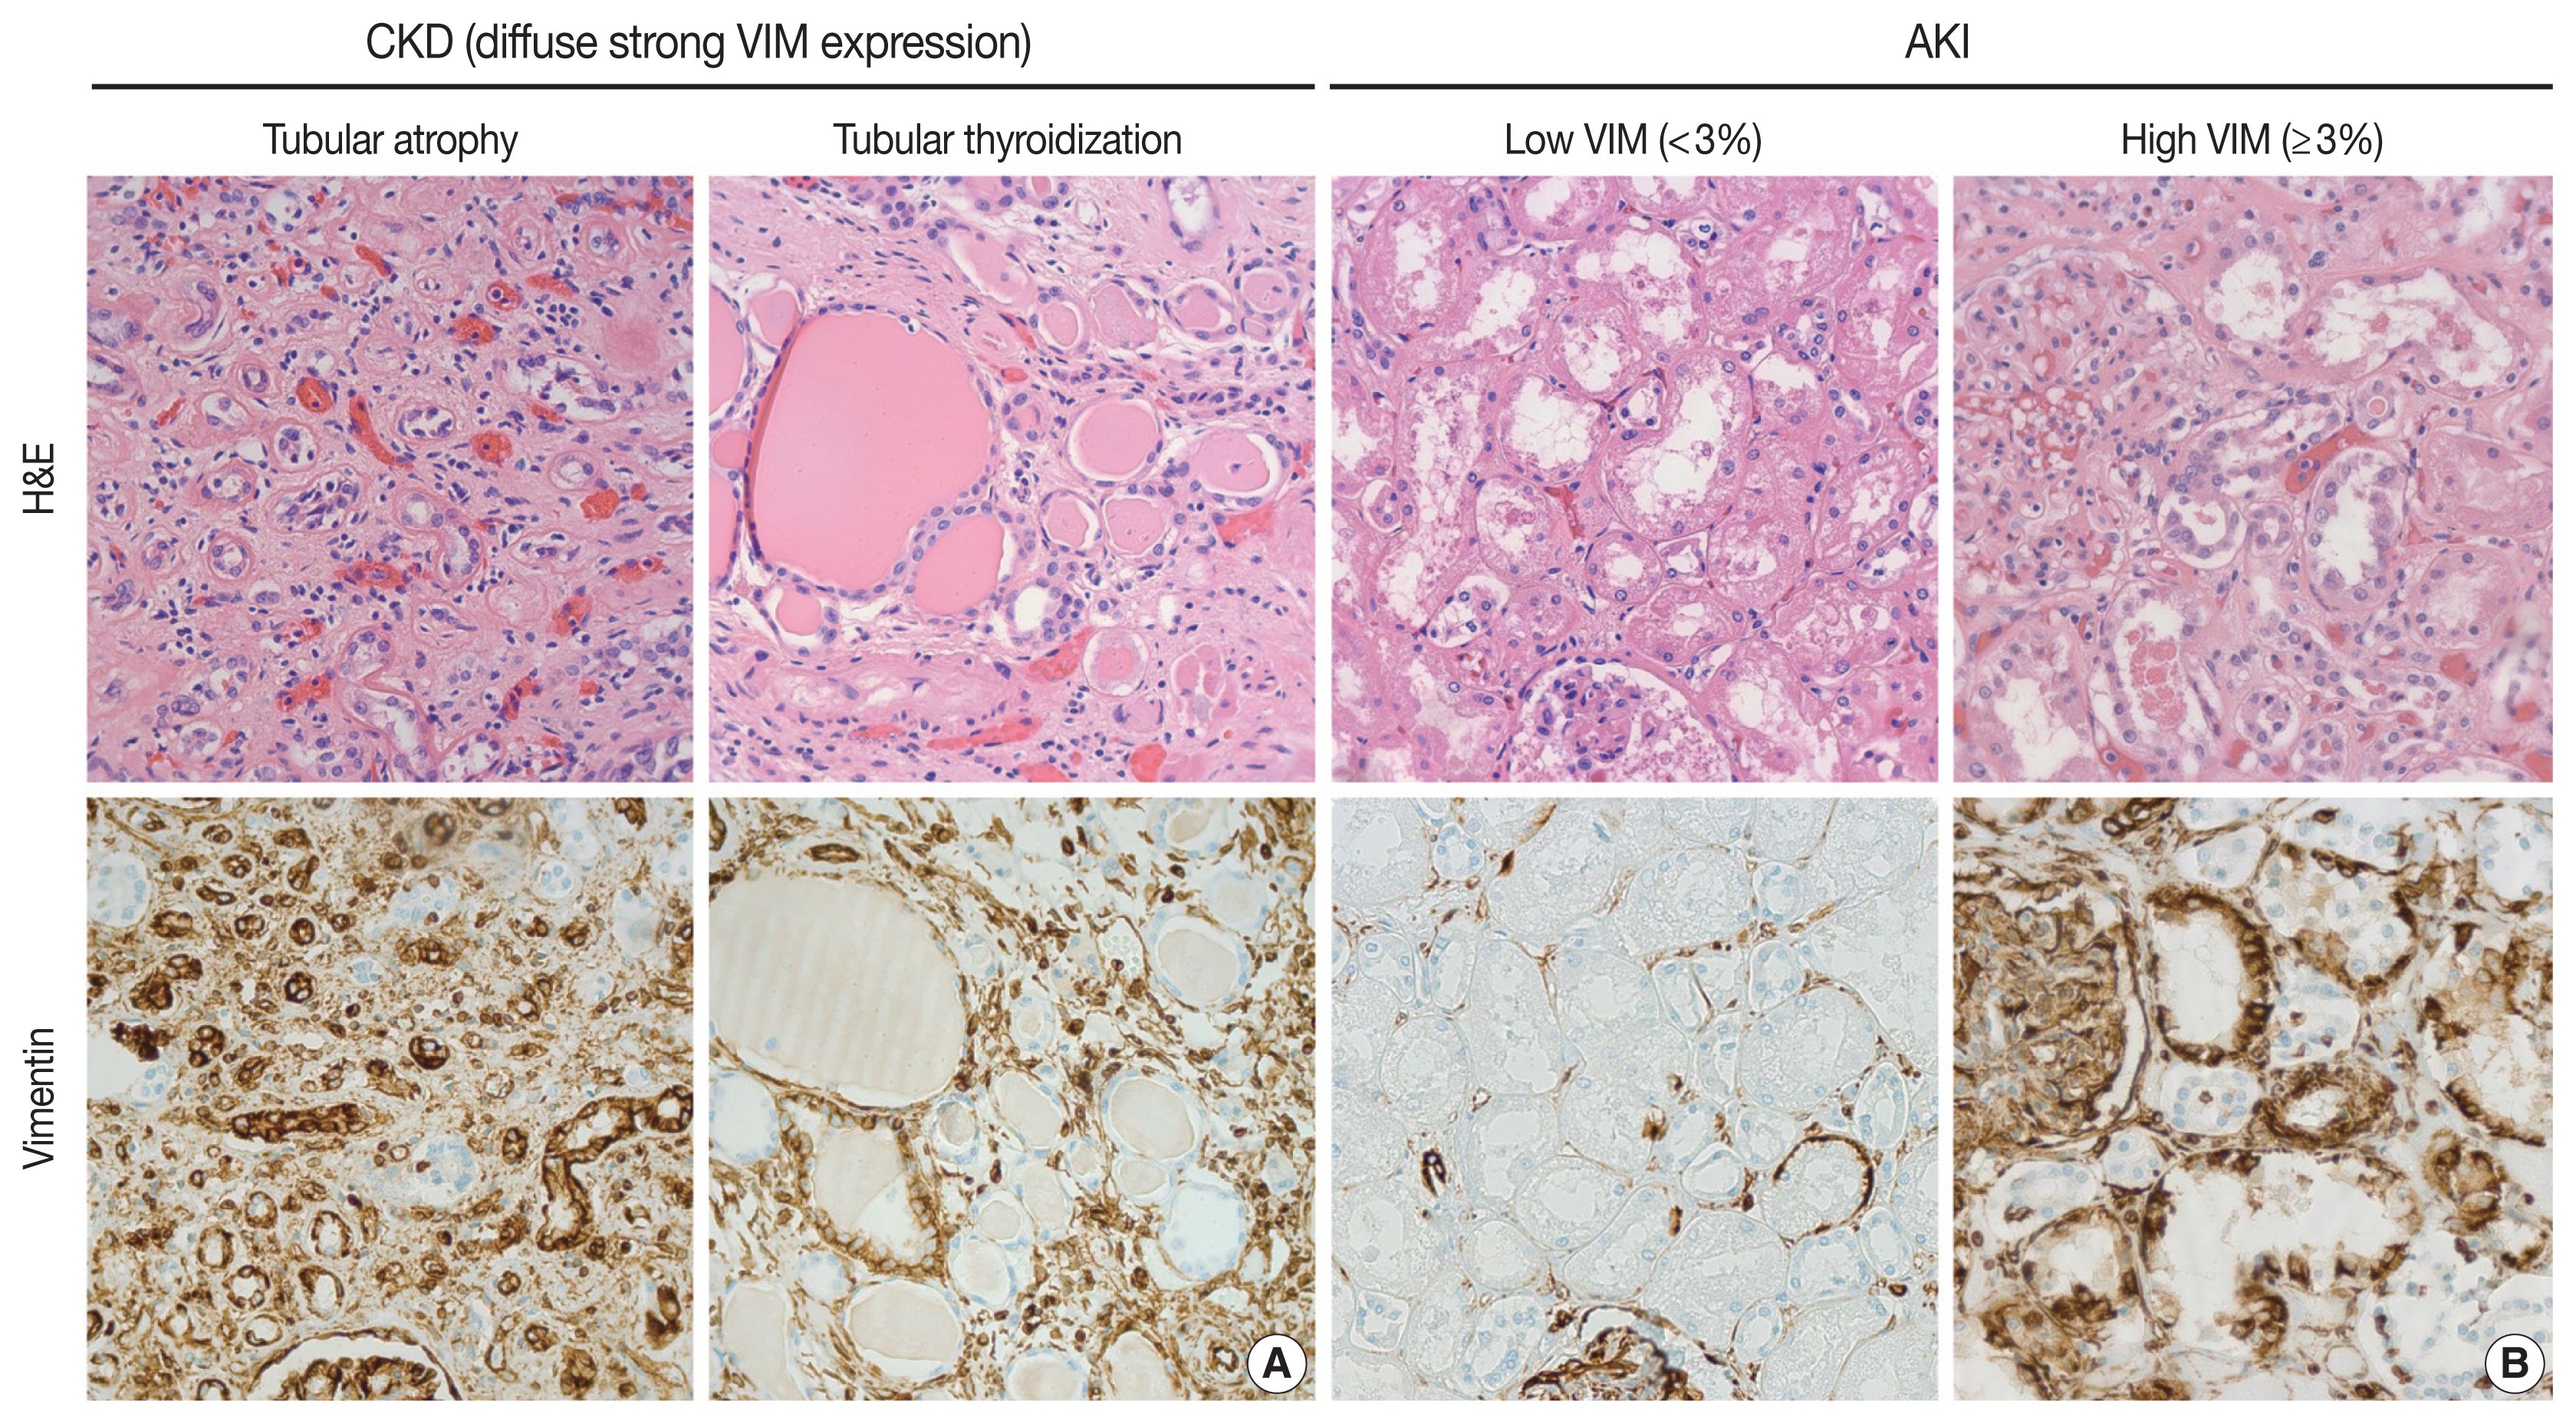
Representative hematoxylin and eosin (H&E) (upper panels) and immunohistochemistry (lower panels) images of kidney tissues. (A) Kidney tissues showing diffuse and strong vimentin (VIM) expression in areas of chronic tubular damage (patients with chronic kidney disease). (B) Kidney tissues showing low and high VIM expression. Slides were stained with H&E and VIM stains, and images were examined at × 400.
Statistical analysis
The VIM score was categorized into less than 3% and greater than or equal to 3%. This cutoff of 3% was assigned based on the VIM score distribution, where 95.7% of the total population (22/23) clustered in the “less than or equal to 20% VIM score.” Multiple cutoffs have been explored to determine the optimal stratification of patients. The optimal cutoff point for VIM that provided the greatest statistical significance was 3%. Data retrieved from medical charts were entered into a Microsoft Excel spreadsheet that was designed specifically for this study. Then, the data were transferred into the Statistical Package of Social Science (IBM Corp., Released 2013, SPSS Statistics for Windows ver. 22.0, Armonk, NY, USA), which was used for data cleaning, management, and analyses. Descriptive statistics were carried out and reported as frequencies and percentages for categorical variables and as means±standard deviations for continuous variables. Characteristics of patients and other clinicopathological parameters among the two studied groups (VIM < 3%, low, and ≥ 3%, high) were tabulated. Baseline comparisons between the two studied groups were performed using the Mann-Whitney U test for continuous variables. The chi-square test was used to assess any significant association between the categorical variables. Thereafter, univariate logistic regression was used to determine the associations between VIM (low/high) as a dependent variable and other clinicopathological parameters as independent variables. The level of significance was set at p < .05 for all statistical analyses.
RESULTS
VIM expression and its correlation with clinical characteristics
A total of 23 patients was selected based on the inclusion criteria. From this group, high VIM expression (≥ 3%) was observed in 16 patients (Fig. 2). Among our patient cohort, 13 (56.5%) were females and 10 (43.5%) were males. Patients were divided into two age groups, ≤ 65 years (7 patients, 30.4%) and > 65 years (16 patients, 69.6%). The patients were distributed according to cause of death: cardiac (4 patients, 17.4%), respiratory (6 patients, 26.1%), stroke (2 patients, 8.7%), sepsis (7 patients, 30.4%), and other (3 patients, 13.0%). There were 16 patients (69.6%) with no CKD and seven patients (30.4%) with CKD. Fold eGFR was calculated using the Chronic Kidney Disease Epidemiology Collaboration (CKD-EPI) creatinine equation [28]. Also, fold creatinine was estimated using the lowest value recorded during or before hospitalization and the highest value recorded during hospitalization. Chronic hemodialysis was found in one patient (4.3%). Sixteen patients (69.6%) did not have diabetes mellitus, and 16 patients (69.6%) had hypertension. Shock during hospitalization was present in 10 patients (43.5%). Clinical evidence of acute kidney injury was documented in 13 patients (56.5%) (Table 1). No statistically significant difference was found between patients regarding age, gender, cause of death, CKD, CKD stage, chronic hemodialysis, diabetes mellitus, hypertension, shock during hospitalization, fold eGFR, fold creatinine, or clinical evidence of acute kidney injury with respect to VIM expression.
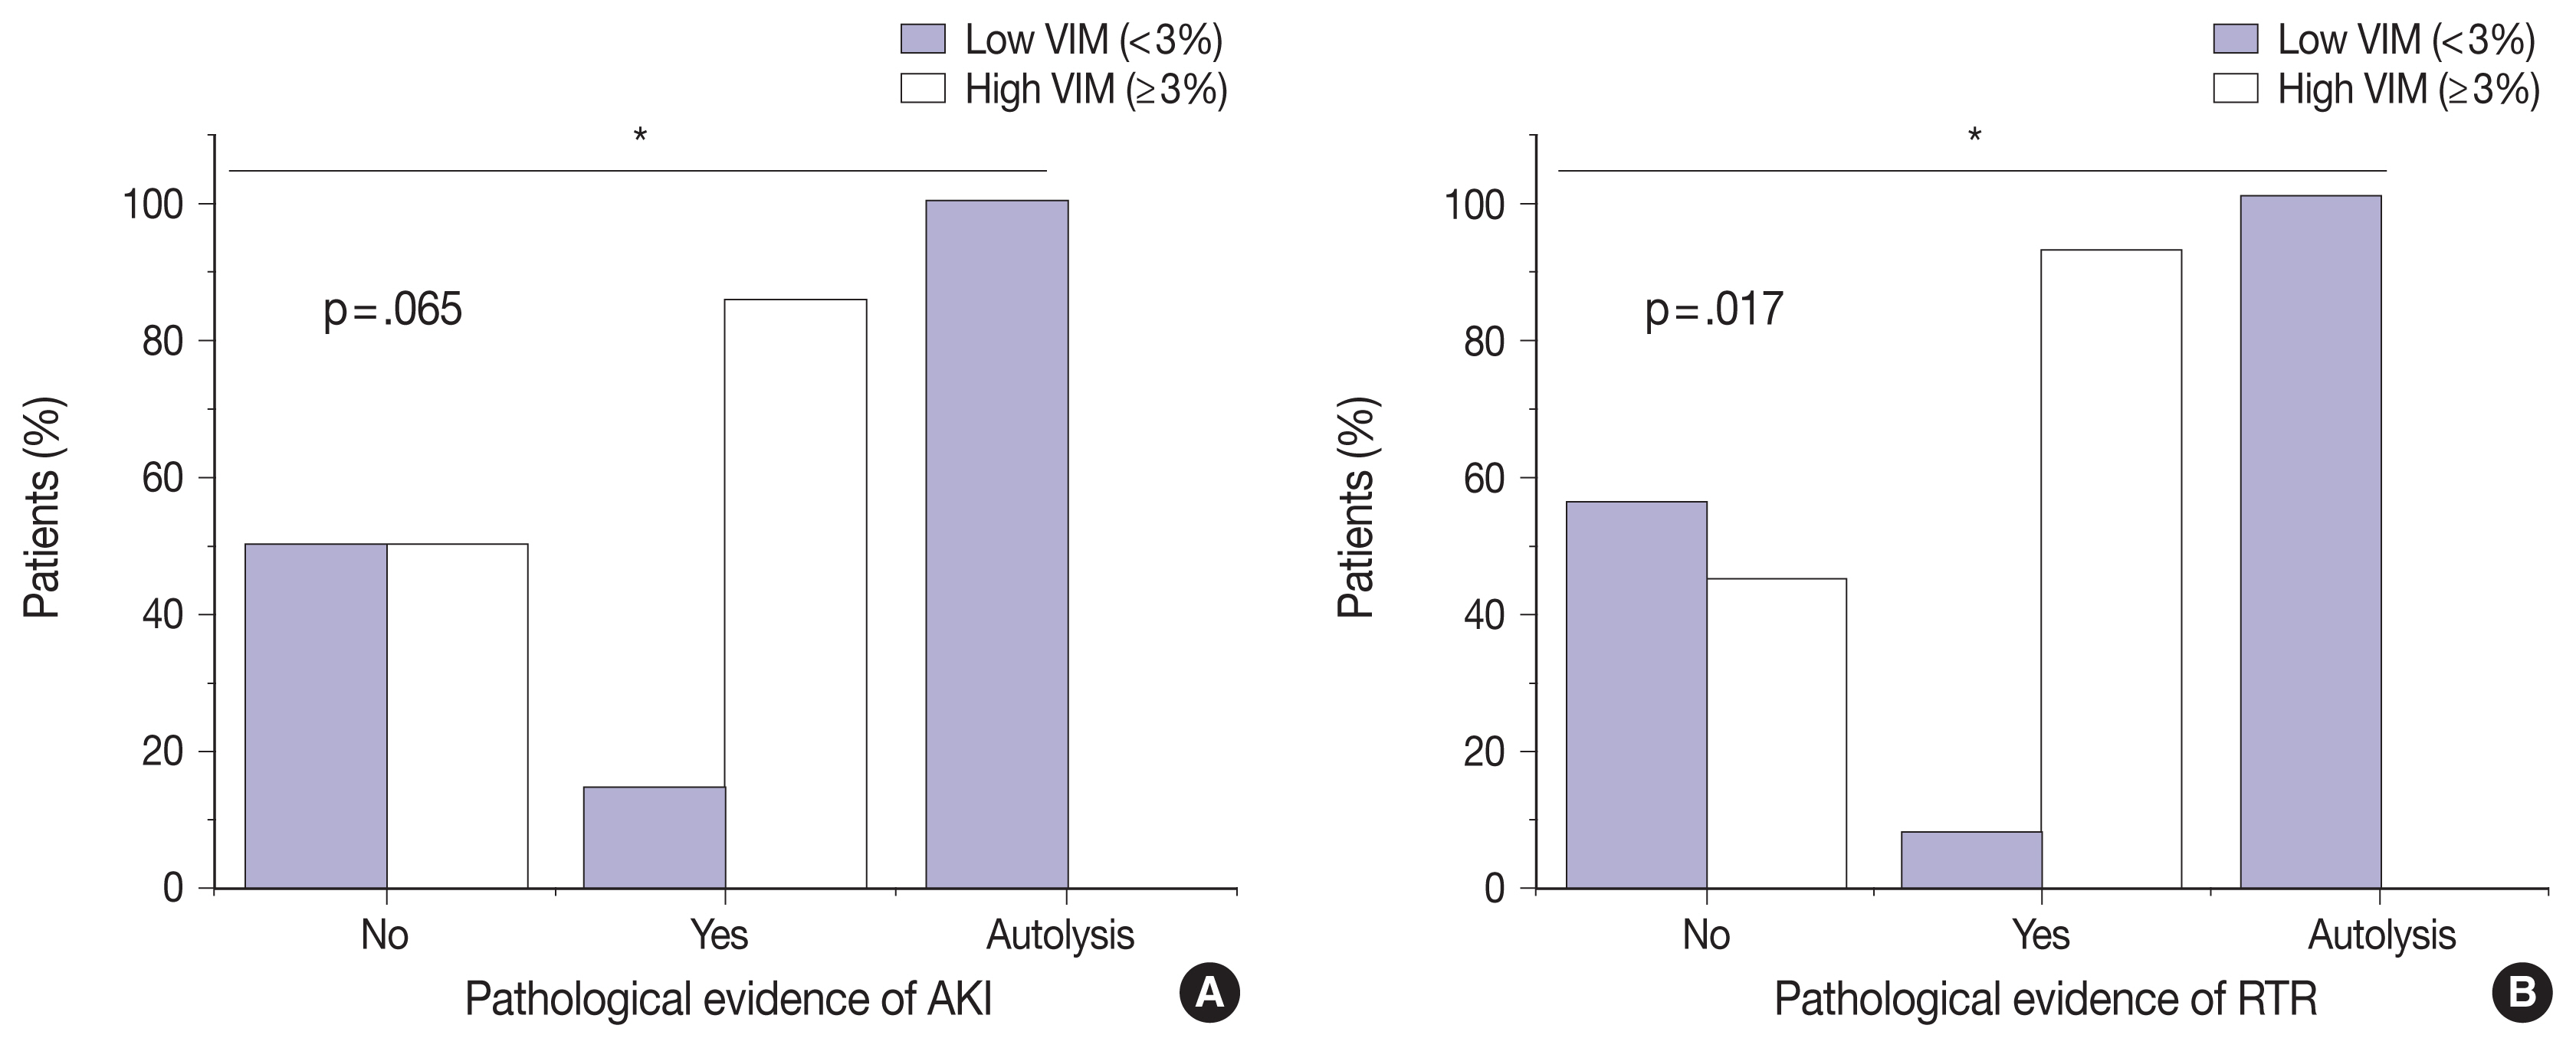
Correlation between vimentin (VIM) expression on one hand and pathologic evidence of acute kidney injury (AKI) (A) and renal tubular regeneration (RTR) (B) on the other hand. Kidney tissues with evidence of AKI and RTR had significantly higher VIM expression (p = .065 and p = .017, respectively). Chi-square test was used to assess significant association between the two variables (*p < .05).

Correlation between vimentin expression and acute kidney injury
VIM expression is significantly correlated with AKI and RTR
We next sought to assess the correlation between VIM expression and other histopathologic variables. High VIM expression was significantly associated with arteriosclerosis, arteriosclerosis severity, and glomerulosclerosis (p = .005, p = .002, and p = .033, respectively) (Table 1). Kidney tissues with pathologic evidence of ATN and RTR had significantly higher VIM expression (p = .036 and p = .007, respectively) (Table 1, Fig. 2). Also, renal peritubular microenvironment features showing regenerative changes on H&E were associated with high VIM expression (p = .009) (Table 1). In univariate models, kidney tissues with evidence of AKI and RTR were 15.00-fold more likely to have high VIM expression (odds ratio [OR], 7.500; 95% confidence interval [CI], 1.023 to 54.996; p = .047 and OR, 18.000; 95% CI, 1.632 to 198.508; p = .018, respectively) (Table 2).
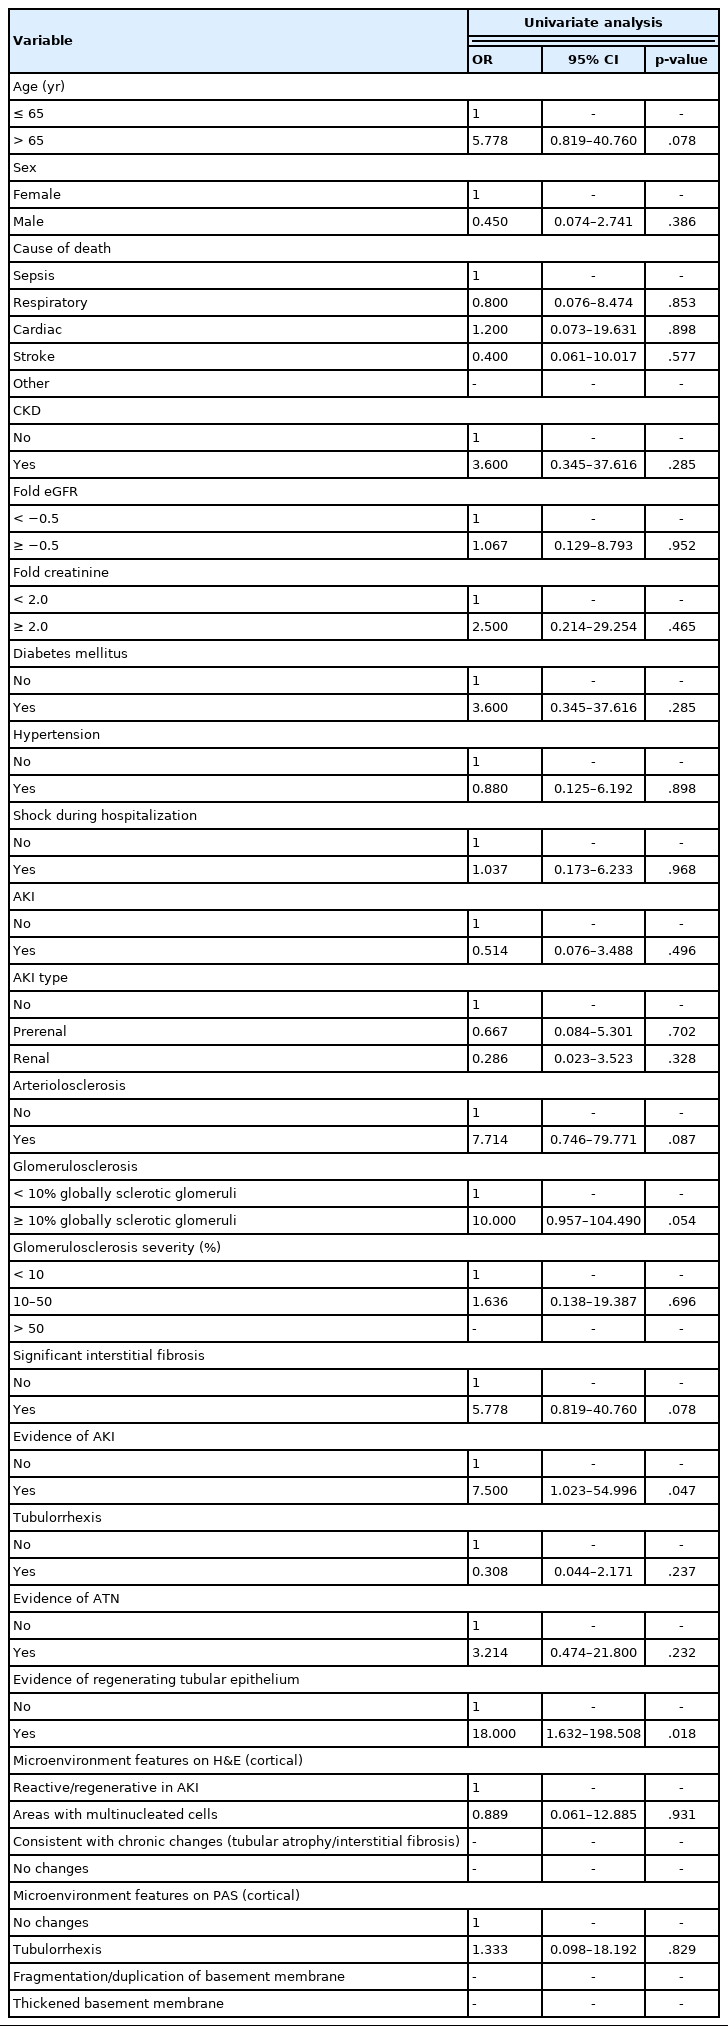
Results of the logistic regression analysis with vimentin expression as a dependent variable (univariate analysis)
DISCUSSION
In this study, we showed a significant association between VIM expression by cortical tubular epithelia and RTR in the setting of AKI/ATN. First, VIM can be expressed by cortical tubular epithelia, but never by medullary epithelia, in diverse histologic landscapes. The cortical tubular epithelium of degenerated nephrons with patchy interstitial fibrosis, glomerulosclerosis, and tubular atrophy can display widespread VIM expression. For instance, severely impaired tubules with hyaline casts, so-called tubular thyroidization, exhibited diffuse and strong positivity for VIM (Fig. 1A). This aberrant VIM expression in CKD represented an obstacle to evaluating RTR in AKI. As an attempt to explore the relationship between VIM expression and RTR, we quantify VIM immunoreactivity in areas without chronic damage or tissue remodeling (Fig. 1B). Thus, any VIM expression by the cortical tubular epithelium of preserved nephrons can be considered a response to acute injury. In fact, the most severe cases of ATN displayed widespread VIM expression in tubular epithelial cells, a finding that has been observed in animal models [29]. Although the fold changes in creatinine and eGFR correlated with histologic evidence of AKI/ATN, they were not significantly associated with VIM expression in our cohort. This might be because the autopsies were performed at different stages of AKI. In fact, we hypothesize that, in some cases, VIM expression was low because there was not enough time to develop a regenerative response in the tubules.
The VIM evaluation criteria proposed in our study are based on the number of positive tubules (defined as more than 50% of the tubular epithelial cells showing positive gold-brown cytoplasmic stain within each tubule) in an average of 30 tubules (counted randomly within 10 HPFs) and dividing this number by the total number of tubules assessed, multiplied by 100. This percentage is referred to as the VIM score. A VIM score < 3% signifies low VIM expression; a VIM score ≥ 3% signifies high VIM expression. After systematic quantification, VIM was an independent predictor for RTR with 18-fold risk. There was no statistically significant difference between patients with regard to clinical characteristics. VIM, also known as fibroblast intermediate filament, is the major intermediate filament found in stromal cells [30]. These cell types include fibroblasts, endothelial cells, macrophages, melanocytes, Schwann cells, and lymphocytes [31]. This is in contrast to keratin, which is the intermediate filament found in epithelial cells. Studies have shown that undifferentiated cells of the metanephric mesenchyme express VIM but not cytokeratins [32]. Tubular epithelial cells, however, do not express VIM at any developmental stage [32]. This supports the notion that the presence of VIM-positive cells in the kidney exemplifies the mesenchymal phenotype where cells undergo EMT [33]. A study by Mezni et al. [33] demonstrated that tubular expression of VIM is a good marker of EMT and can predict long-term renal graft fibrosis.
As we mentioned earlier, there is evidence in the literature of renal tubular epithelial regeneration post-injury. A study by Vogetseder et al. [34] and another by Fujigaki et al. [19] showed that dividing cells in the S3 segment of proximal tubules and in the distal tubules had a basolateral expression of Na-K-ATPase (a marker of terminal epithelial differentiation) at the same level as neighboring non-proliferating cells. These cells survived after injury carrying intact nuclei, actively proliferating, and expressing VIM. Such cells can be referred to as progenitor cells of the kidney [35]. In 2003, Maeshima et al. identified progenitor-like cells present throughout the renal tubules of adult rats via BrdU labeling [36]. Thereafter, more studies followed, proving the existence of progenitor/stem cell-like cells in the adult kidney [37,38]. Kitamura et al. [37], for instance, isolated a cell line (rKS56) with a high proliferative potential from adult rat kidneys. Interestingly, Bussolati et al. [38] recently discovered CD133+ progenitor cells within the adult human kidney and expressing the embryonic kidney marker PAX2. Those cells were capable of expansion and self-renewal in vitro.
Several studies have described this subpopulation of cells having stem cell/progenitor properties different from those of normal epithelial cells [29,38,39]. The main markers of this population were CD24, CD133, and VIM. These progenitor cells were scattered throughout the proximal tubule in the normal human kidney [29]. Compared to conventional epithelial cells, progenitor cells contain less cytoplasm, fewer mitochondria, and have no brush border [29]. Regenerating tubular epithelium is likely a collage of expanded progenitor cells with diverse stages of maturation/differentiation. VIM expression in regenerating tubules could be secondary to activated transitory EMT programs prior to full functional and morphologic recovery [29,40]. Reviewing the literature on RTR and nephrogenic markers of regeneration reveals some pre-clinical in vitro and in vivo studies and a few other studies conducted on humans. Hansson et al. [41] used transmission electron microscopy, immunoelectron microscopy, and immunofluorescence of the human kidney cortex to explore progenitor-like cells following injury. Regenerating tubules demonstrated expression of progenitor-cell markers such as CD133, VIM, KRT19, and CLDN1 [41]. Vansthertem et al. [42] showed some regenerating cells in renal tubules after ischemia and expressing BrdU, CD44, and VIM could originate from an extrarenal source and reach the renal parenchyma via blood vessels [42].
Our study demonstrates, with statistically significant evidence (p = .018), the correlation between RTR and high VIM expression. This further supports what has been previously observed in other studies regarding the validity of VIM as a potential regenerative biomarker. In our study, we found correlation between VIM expression and different features of AKI other than histologic findings such as arteriosclerosis, arteriolosclerosis, and glomerulosclerosis. The meaning of VIM expression in CKD is more ambiguous. Interestingly, VIM-expressing epithelial cells are encountered, in addition to CKD, in many other chronic diseases characterized by parenchymal loss and tissue fibrosis, such as idiopathic pulmonary fibrosis, cirrhosis, and scleroderma, among others [40,43–45]. Persistence of VIM-expressing epithelia has been associated with organ dysfunction and fibrogenesis [46]. Further studies can elucidate the role of VIM expression in CKD.
We acknowledge that our study has several limitations. First, in the case of an autopsy, searching the entire kidney specimen and performing immunohistochemistry on a whole section slide is possible, although in practice, one representative section usually is submitted and retained for a specific time period (three months after the final report for wet tissues in non-forensic autopsies, according to the College of American Pathologists recommendations for the minimum requirements for retention of laboratory records and materials [47]). Hence, it is not possible to acquire further sections from the kidney specimens. Second, since we used kidney tissues from deceased patients, autolysis can alter the reactivity to IHC assays. In a few tested autolyzed tissues, VIM immunoreactivity decreases with autolytic changes. Interstitial and glomerular stromal cells served as positive internal controls. Third, due to the retrospective nature of our study, selection bias and performance bias were inevitable. Lastly, our patient cohort was selected from a single medical center and was a relatively small sample size; therefore, future studies are warranted from multiple centers to verify the results on a larger population of patients. Nevertheless, future studies would be of interest to evaluate the clinical significance of VIM expression in renal biopsies from living patients to assess adequately RTR.
Conclusion
There is a need to identify novel biomarkers for RTR. Our findings suggest that VIM could serve as an excellent potential IHC marker for RTR following AKI in the right clinical and morphologic context, especially important since regenerative responses are difficult to appreciate on routine light microscopy. Nonetheless, correlation with H&E findings remains critical to exclude chronic tubular damage. Collectively, our preliminary results pave the way for future studies of larger sample size to validate the use of VIM as a reliable biomarker for RTR.
Notes
Ethics Statement
All procedures performed in the current study were performed in accordance with the 1964 Helsinki declaration and its later amendments. Formal written informed consent and approval by the Institutional Review Board (IRB) of Mount Sinai Medical Center of Florida were not required since the included patients were deceased at the time of the study. Chart review was carried out by CITI (Collaborative Institutional Training Initiative)-certified physicians.
Availability of Data and Material
The datasets generated or analyzed during the study are available from the corresponding author on reasonable request.
Code Availability
Not applicable.
Author Contributions
Conceptualization: RP. Data curation: JCAM, HFB, AP, AA. Formal analysis: AS. Investigation: JCAM, HFB, CAFA, AP, AA. Methodology: JCAM, HFB, AS. Project administration: RP, JCAM. Resources: JCAM. Software: AS. Supervision: RP. Validation: CAFA, RP. Visualization: JCAM, HFB, CAFA, RP. Writing—original draft: JCAM, HFB. Writing—review & editing: CAFA, AP, AA. Approval of final manuscript: all authors.
Conflicts of Interest
The authors declare that they have no potential conflicts of interest.
Funding Statement
No funding to declare.