Expressional Difference of RHEB, HDAC1, and WEE1 Proteins in the Stromal Tumors of the Breast and Their Significance in Tumorigenesis
Article information
Abstract
Background
Fibroadenoma (FA) and phyllodes tumor (PT) are stromal tumors of breast and are histologically similar. There are no established differences in tumorigenesis and oncogene expression among them. Ras homolog enriched in brain (RHEB) plays an important role in cell growth and cell-cycle control, histone deacetylase 1 (HDAC1) is an important factor in breast tumor progression and prognosis, and WEE1 homolog (WEE1) functions as a tumor suppressor. No studies on the expressional differences of these proteins in FA and PT have been reported to date.
Methods
The expression of these proteins in FA, PT, and normal breast was compared. We used 102 cases of FA and 25 cases of benign PT.
Results
In epithelial cells, the expression of RHEB, HDAC1, and WEE1 was lowest in PT, higher in FA, and most enhanced in normal breast. In addition, the expression of RHEB and HDAC1 was higher in the stromal cells of PT than in FA and normal breast.
Conclusions
Both epithelial and stromal cells of FA and PT express these proteins, which indicates that epithelial cells play an important role in the development of stromal tumors. In addition, the expressional differences of these proteins may be associated with the tumorigenesis of breast stromal tumors.
Fibroadenoma (FA) and phyllodes tumor (PT) are common stromal tumors in the female breast that originate from the intralobular stroma.1,2 PT occurs approximately 10-20 years after the occurrence of FA. Because the recurrence rates for PT are higher than those of FA, it is classified as a borderline malignant tumor.3 Although PT is a type of breast stromal tumor, it is often difficult to distinguish it from FA because these tumors are histologically similar. In previous research, we applied a cDNA microarray method and reported that Ras homolog enriched in brain (RHEB), histone deacetylase 1 (HDAC1), and WEE1 homolog (WEE1) are expressed at a two-fold higher level in FA than in normal breast tissues.4 RHEB is associated with tuberous sclerosis, a human genetic disease, and RHEB plays an important role in cell growth and cell-cycle control.5,6 HDAC1 is associated with the expression and function of estrogen receptor-α (ER-α), and it has been considered an important factor in breast tumor progression, cell proliferation, invasiveness, and prognosis.7-10 WEE1 functions as a potent tumor suppressor.11 Although numerous genetic studies of breast cancer have been published, few have specifically addressed the genes expressed in these stromal tumors and no studies have reported differences in the expression of these proteins in FA and PT.4,12 Therefore, this study aimed to examine the expression of the RHEB, HDAC1, and WEE1 proteins and to compare the differences in their expression in FA and PT.
MATERIALS AND METHODS
Patients
This study received approval from the Institutional Review Board of Yonsei University Wonju Christian Hospital (CR107064). The sample consisted of 102 cases of FA and 25 cases of PT; 20 samples of normal breast tissue were used as normal controls. For all cases, we used formalin-fixed paraffin-embedded tissue samples that were surgically resected and pathologically diagnosed at Yonsei University Wonju Christian Hospital from 1998 to 2007. All diagnoses were confirmed by two expert pathologists examining hematoxylin and eosin (H&E)-stained slides.
Immunohistochemistry
Tissue microarray (TMA) block preparation
Formalin-fixed paraffin-embedded tissues were obtained from subjects. Using H&E-stained slides, a representative tumor site was chosen and the site corresponding to the confirmed tumor site in the paraffin block was marked. Areas with necrosis, hemorrhage, and artifacts were excluded. The selected tumor area was harvested using a 5 mm Quick-ray tip-punch (Unitma, Seoul, Korea), placed on a TMA mold with 20 pores (Unitma), and re-embedded with paraffin. TMA blocks were prepared as 4-µm-thick sections and were stained with the H&E staining method. The tissues were then examined to determine whether the appropriate tumor site had been selected.
Staining methods
TMA blocks were prepared as 5-µm-thick sections and were attached to silane-coated glass slides. The samples were deparaffinized with xylene in a 50℃ dry oven and hydrated with a graded ethanol series. The slides were washed with tap water and immersed in distilled water. For antigen retrieval, the PT module (Lab Vision, Fremont, CA, USA) was used (heated at 99℃ for 15 minutes, cooled to 65℃ for 20-25 minutes for stabilization, and subsequently washed with running tap water). The slides were immersed in distilled water, and tissues were marked with a marking pen. To remove endogenous hydroxyperoxidase activity, the samples were pretreated with hydrogen peroxide block (Thermo Fisher Scientific, Fremont, CA, USA) for 10 minutes and washed with Tris buffered saline plus Tween 20 (TBS-T; ScyTek Laboratories, West Logan, UT, USA). Primary antibodies were pretreated with Ultra V Block (Thermo Fisher Scientific) for 5 minutes, applied, and incubated for 2 hours. The applied primary antibodies were RHEB (GenWay, San Diego, CA, USA), HDAC1 (Thermo Fisher Scientific), and WEE1 (Santa Cruz Biotechnology, Santa Cruz, CA, USA) in dilutions of 1:200, 1:500, and 1:25, respectively. The samples were washed with TBS-T buffer, treated with primary antibody enhancer (Thermo Fisher Scientific) for 20 minutes, and washed again with TBS-T buffer. The samples were then treated with horseradish peroxidase polymer secondary antibody (Thermo Fisher Scientific) for 30 minutes, washed with TBS-T buffer, and incubated with 3-amino-9-ethylcarazole (AEC; Lab Vision) for 5-10 minutes. After washing with distilled water, background staining was performed with Mayor's hematoxylin. Then, slides were immersed in distilled water and mounted using Shandon Immu-Mount (Thermo Fisher Scientific). Normal brain tissue for RHEB, normal tonsil tissue for HDAC1, and normal nasopharyngeal mucosa tissue for WEE1 were used for positive controls, according to the manufacturer's recommendation. In addition, negative control stains without primary antibodies were also performed (Fig. 1A-C).
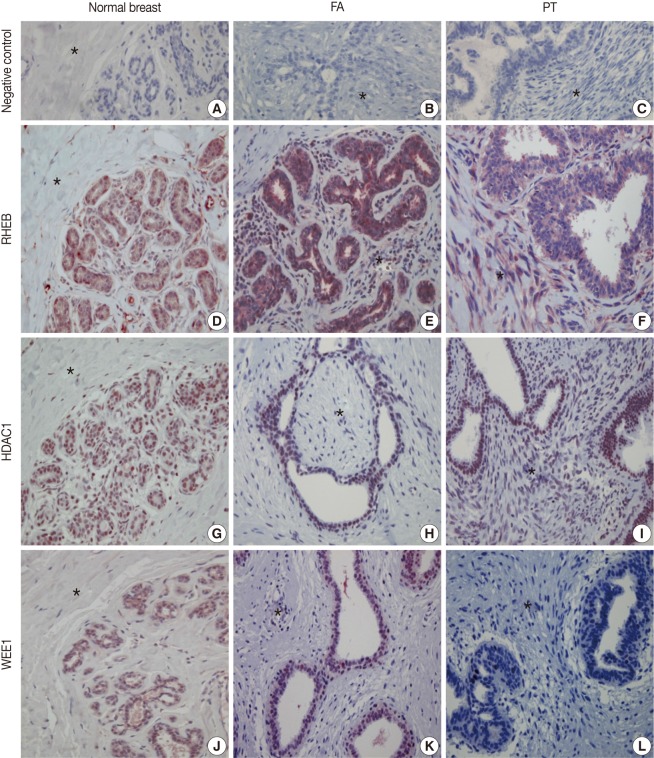
Immunohistochemical (IHC) findings. The IHC stains with negative control serum for normal breast tissue (A), fibroadenoma (FA) (B), and phyllodes tumor (PT) (C) are all negative. IHC stains for Ras homolog enriched in brain (RHEB) reveal positive reactions in the nuclei and cytoplasm of epithelial and stromal cells of normal breast (D), FA (E), and PT (F). IHC stains for histone deacetylase1 (HDAC1) are positive in the nuclei of the epithelial and stromal cells of normal breast (G), FA (H), and PT (I). IHC stains are positive for WEE1 homolog (WEE1) in the nuclei of epithelial cells of normal breast (J), FA (K), and PT (L). The areas marked with an asterisk (*) are stromal cells.
Evaluation method
Tumor cells showing nuclei or cytoplasm stained with brown color under light microscopy were considered positive. Epithelial and stromal cells were separately scored. Cells were scored broadly, according to the staining intensity and the distribution of stained cells. Staining intensities were scored as follows: absence of stain, 0 point; weak staining intensity, 1 point; moderate staining, 2 points; and strong staining, 3 points. The distribution of stained cells (dependent upon the percentage of stained tumor cells) was scored as follows: 0%, 0 point; less than 25%, 1 point; between 25 and 50%, 2 points; and more than 50%, 3 points. The final staining score was obtained by adding the scores of staining intensity and distribution score of stained cells. A score from 0 to 2 points was considered negative and scores ranging from 3 to 6 points were considered positive.13
Statistical analysis
The statistics program SPSS ver. 13.0 (SPSS Inc., Chicago, IL, USA) was used. By applying the χ2 test, the expressions of RHEB, HDAC1, and WEE1 in both epithelial cells and stromal cells were separately compared. Using a one-way analysis of variance test and an independent t-test, the mean scores of RHEB, HDAC1, and WEE1 were compared separately in both epithelial cells and stromal cells. Results with a p-value less than 0.05 were considered to be statistically significant.
RESULTS
Clinicopathological findings
The FA cases (total of 102) included all typical types, and were characterized as epithelial or stromal cells. However, in some of the FA cases, the tumors were accompanied by normal breast parenchyma or fibrocystic changes. The mean age of the FA patients was 35.54±9.29 years and the mean FA tumor size was 2.35±0.88 cm. There were 25 PT cases, distinguished by typical leaf-like growth patterns and stromal hypercellularity. All cases of PT were benign. The mean age of PT patients was 40.08±12.95 years and the mean PT tumor size was 6.24±3.21 cm. The mean mitotic count of PT was 0.44±0.58/10 high-power fields. There was no tumor recurrence or metastasis after excision on clinical record for any of the PT cases.
Immunohistochemistry
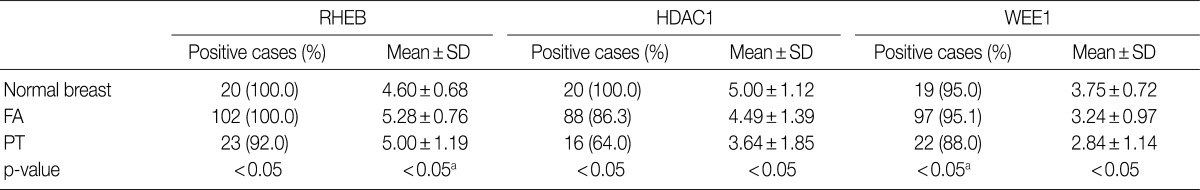
The nuclei and cytoplasm of epithelial, myoepithelial, and stromal cells were stained with RHEB (Fig. 1D-F). In epithelial cells, 20 normal breast samples (100.0%), 102 cases of FA (100.0%), and 23 cases of PT (92.0%) stained positive for RHEB. The expression frequency of RHEB was significantly lower in PT than in normal breast tissue and FA (p=0.028). The mean score for RHEB was the highest in FA (5.28±0.76 points) and the lowest in normal breast (4.60±0.68 points); the PT score was intermediate (5.00±1.19 points). Comparing FA and PT, the mean RHEB score was significantly lower in PT than in FA (p=0.003) (Table 1). With regard to stromal cells, 18 normal breast samples (90.0%), 99 FA samples (97.1%), and 25 PT samples (100.0%) were positive for RHEB, and the frequencies were similar. However, the mean scores for RHEB were significantly different: 2.20±1.44 points for normal breast tissue, 2.65±1.23 points for FA, and 5.60±0.82 points for PT (p=0.000) (Table 2).
The results of immunohistochemical staining in epithelial cells

The results of immunohistochemical staining in stromal cells
The nuclei of epithelial cells and stromal cells stained for HDAC1, whereas myoepithelial cells were negative for the protein (Fig. 1G-I). With regard to epithelial cells, HDAC1 was positive in all 20 normal breast tissue cases (100.0%), 88 cases of FA (86.3%), and 16 cases of PT (64.0%), with significant differences among the three groups (p=0.001). In addition, the mean score for HDAC1 was 5.00±1.12 points in normal breast tissue, 4.49±1.39 points in FA, and 3.64±1.85 points in PT; the differences were statistically significant (p=0.006) (Table 1). Regarding stromal cells, 12 normal breast samples (60.0%), 52 FA cases (51.0%), and 20 PT cases (80.0%) were positive for HDAC1; the frequency of HDAC1 in PT was significantly higher than in FA (p=0.012), although there was no significant difference between the normal breast and the FA group. In addition, the mean score for HDAC1 was 1.20±1.01 points in normal breast, 1.24±1.38 points in FA, and 2.24±1.67 points in PT, illustrating a significant increase in scores from normal breast, to FA, and then to PT (p=0.005) (Table 2).
Only the nuclei of epithelial cells were positive for WEE1; myoepithelial cells were negative for WEE1. Stromal cells revealed nuclear staining for WEE1 in only one case (Fig. 1J-L). Regarding epithelial cells, 19 normal breast samples (95.0%), 97 FA cases (95.1%), and 22 PT cases (88.0%) were positive for WEE1. The frequency was significantly lower in PT than in FA (p=0.000), although normal breast tissue and FA showed similar frequencies. The mean score for WEE1 was 3.75±0.72 points in normal breast tissue, 3.24±0.97 points in FA, and 2.84±1.14 points in PT. The scores decreased significantly from normal breast, to FA, and finally to PT (p=0.009) (Table 1). Concerning stromal cells, only one case of FA (1.0%) was positive for WEE1 (Table 2).
DISCUSSION
The stroma of normal breast tissue is largely composed of interlobular stroma intermixed with some intralobular stroma, which is responsive to breast-specific estrogens.2 FA is a representative benign tumor that originates from breast stromal cells and especially from intralobular stroma. Like FA, PT originates from the intralobular stroma.1,2 The intralobular stroma secretes growth factors for epithelial cells and thus facilitates the proliferation of the epithelial component in FA as well as PT, which is considered to be non-tumorigenic.2 In stromal tumors of the breast, endothelin-1 is released from epithelial cells and mediates the growth of stromal cells. Nonetheless, the precise mechanism of this effect has not been elucidated.14,15 We found that both epithelial and stromal cells of FA and PT express RHEB, HDAC1, and WEE1 proteins, which are known to be associated with the development or progression of tumors. Therefore, we propose that the epithelial cells of the breast may affect the development of stromal tumors, similar to the effect of stromal cells.
RHEB is associated with tuberous sclerosis, a human genetic disease.5 The development of benign tumors is frequently seen in brain, skin, kidney, and cardiac hamartomas of patients with tuberous sclerosis.16 We found that the expression of RHEB is elevated in the epithelial cells of FA. This enhanced expression may be related to the mechanisms of benign tumor development and in particular with the association of RHEB with the insulin/AKT/TOR signaling pathways. Thus, RHEB plays an important role in cell growth and cell-cycle control.5,6 Farnesyltransferase inhibitors have been reported to suppress RHEB and the insulin/TOR/S6K signaling pathway.17-20 This indicates that RHEB may be a valuable target gene for the treatment of breast tumors.21,22 In the present study, the frequency of RHEB expression was higher in the epithelial cells of normal breast tissue and FA than in PT. In addition, the frequency of stromal expression increased from normal breast, to FA, and finally to PT. The higher frequency of RHEB expression suggests that epithelial cells play an important role in tumor development in FA; this may be the main difference between FA and PT. RHEB may be associated with the growth and proliferation of epithelial cells and, in FA, epithelial cells may influence tumorigenesis. However, stromal cells are more important to the proliferation of tumor cells in PT, because RHEB expression is higher in these stromal cells than those of normal breast and FA.
Most breast cancers express ER-α, which is important for the diagnosis, treatment, and prognosis of breast cancer. However, at the time of diagnosis, ER-α expression is absent in more than one-third of breast cancers.23,24 This loss of receptor expression is the result of histone deacetylation and chromatin inactivation caused by DNA methylation. HDAC1 is associated with the expression and function of ER-α, and is considered an important factor in breast tumor progression. In addition, higher expression of HDAC1 has been associated with better prognoses.7,25 However, several studies have reported that HDAC1 expression is correlated with tumor invasiveness and poorer prognostic factors.8-10 In the current study, we found that the frequency of epithelial HDAC1 expression was the highest in normal breast, lower in FA, and lowest in PT. In addition, stromal expression was lowest in normal breast, higher in FA, and highest in PT, similar to the pattern of RHEB. These findings support the hypothesis that FA epithelial cells may influence tumorigenesis, whereas stromal cells influence the proliferation of tumor cells in PT.
Normal expression of WEE1 suppresses cell entry into the mitotic phase via the phosphorylation of CDC2.26,27 Therefore, WEE1 may suppress cell proliferation. Thus, the abnormal expression of WEE1 may induce the proliferation of tumor cells. In particular, it has been observed that the expression of WEE1 is significantly lower in colon cancer cells than in normal colon cells. It has been reported that WEE1 has a potent tumor-suppression function,11 with the loss of WEE1 expression associated with a poor prognosis and a high recurrence rate in lung cancer.27 In addition, mutations in the human BRCA1 gene increase the development of breast and ovarian cancer. Normal BRCA1 arrests the cell cycle at the G2/M phase and simultaneously induces apoptosis by activating WEE1. Therefore, the development of breast cancer associated with the abnormal expression of BRCA1 may be due to WEE1 inactivation.28 In this study, we demonstrated that the expression of WEE1 and other targeted proteins in epithelial cells is significantly lower in PT than in normal breast tissue and FA. WEE1 expression is lower in PT, a borderline malignant tumor, than in benign tumors, suggesting that the gene may act as a tumor suppressor. In contrast with other proteins, WEE1 was barely expressed in the stromal cells of normal breast, FA, and PT, which originate from stromal cells. Thus, WEE1 may be primarily associated with the development of tumors of epithelial origin. Recent studies have demonstrated that WEE1 may be a novel therapeutic target in various cancers, including breast cancer.29,30 Therefore, WEE1 may become an important new target molecule for the treatment of breast cancer.
In the epithelial cells of normal breast, FA, and PT, the expression of RHEB, HDAC1, and WEE1 was observed. In addition, both the frequency of expression and the mean score of epithelial cells were higher in normal breast tissue and FA than in PT; however, in stromal cells, the frequency and mean score of RHEB and HDAC1 were highest in PT, intermediate in FA, and the lowest in normal breast. Based on these results, we propose a new role for the involvement of epithelial cells in the development of FA and PT, which are known as tumors of stromal origin. For PT as well as FA, epithelial cells may be associated with the development of tumors, although stromal cells appear to contribute more to tumor development. Because cases of high-grade PT are rare, only benign PT samples were used in our study. However, based on mitotic count, stromal cellularity, and atypia, PT can be subclassified into three groups: benign, borderline, and malignant.1 Comparing the expression of these genes and proteins in the three kinds of PT may reveal more about the relationship between the expression of these proteins and PT tumorigenesis. In addition, because PT occurs rarely, it was difficult to obtain fresh tissue samples, so we have reported only the differences in protein expression among these tumors. Future studies involving a larger number of cases should include fresh tissue to elucidate the functional significance of these proteins and genes.
In conclusion, in epithelial cells of breast stromal tumors, the expression frequencies of RHEB, HDAC1, and WEE1 proteins were highest in normal breast tissue, intermediate in FA, and lowest in PT; the stromal expression of RHEB and HDAC1 increased from normal breast to FA to PT. The differences in the expression of these proteins is associated with the development of breast stromal tumors, with epithelial cells playing an important, previously unrecognized, role in the tumorigenesis of these tumors.
Notes
No potential conflict of interest relevant to this article was reported.