Hedgehog Related Protein Expression in Breast Cancer: Gli-2 Is Associated with Poor Overall Survival
Article information
Abstract
Background
The hedgehog (Hh) signaling pathway is known to play a critical role in various malignancies, but its clinicopathologic role in breast cancer is yet to be established.
Methods
Tissue microarray blocks from 334 cases of breast cancer were prepared. The expression of six Hh signaling proteins including sonic hedgehog (Shh), patched (Ptch), smoothened (Smo), and the glioma-associated oncogene (Gli)-1, Gli-2, and Gli-3 were analyzed immunohistochemically.
Results
The expression of Hh signaling proteins was significantly correlated with some prognostic factors including the correlation of lymph node metastasis with the expression of Shh (p=0.001) and Ptch (p=0.064), the correlation of the stages with Shh and Gli-3 expression (p=0.007 and p=0.024, respectively), the correlation of the nuclear grade with the Smo (p=0.004) and Gli-3 (p=0.000), and the correlation of the histologic grade with the Ptch (p=0.016), Smo (p=0.007), and Gli-3 (p=0.000). The Shh, Ptch, Smo, Gli-1, and Gli-2 expression was significantly different between the phenotypes (p=0.000, p=0.001, p=0.004, p=0.039, and p=0.031, respectively). Gli-2 expression was correlated with a worse overall survival outcome (p=0.012).
Conclusions
Hh pathway activation is correlated with a more aggressive clinical behavior in breast carcinomas. The comparison of phenotypes suggested that the Hh pathway may be a useful therapeutic target for breast carcinoma. Patients with Gli-2 expression had a significantly lower overall survival rate and, therefore, it showed promise as a prognostic marker.
The hedgehog (Hh) signaling pathway was first discovered as a primary regulator of embryonic development.1 Mammalian Hh signal transduction involves three Hh homologues: sonic (Shh), Indian, and Desert. The Hh signaling cascade is initiated as the Hh binds to the twelve transmembrane proteins patched 1 (Ptch). This internalizes the Ptch and relieves the suppression of the smoothened (Smo), which allows for the activation of the glioma-associated oncogene (Gli) transcription factor. The Gli transcription factor exists in three forms, Gli-1, Gli-2, and Gli-3.2,3 Although the detailed mechanism of this pathway is yet to be understood, a full-length Gli-3 is transported into the nucleus in order to activate the Hh target genes.4 Gli-1, one of the Hh target genes that functions only as a transactivator, is considered to be a marker of the Hh pathway activation.4,5
Recent studies have demonstrated that carcinomas of various organs, such as the skin, cerebellum, lungs, stomach, pancreas, prostate, uterine cervix, and breasts, harbor the ligand-dependent activation of the Hh signaling pathway.2,6,7 Shh, Ptch, and Gli-1 have been reported to be overexpressed in breast carcinomas.2 In addition, a positive correlation between the estrogen receptor (ER) status and Gli-1 nuclear translocation has been reported and further studies indicated that estrogen-induced Shh expression activated the Hh pathway and increased cell proliferation.2,8
Breast cancer is one of the most heterogeneous types of tumor with various histology, phenotype, and clinical behavior. In general, systemic therapy recommendations follow the subtype classification, which is determined by hormone receptor status, human epidermal growth factor receptor 2 (HER2) expression and Ki-67 labeling index.
The purpose of this study was to evaluate Hh signaling protein expression in breast carcinoma according to immunohistochemical subtypes, correlate the expression with known clinicopathologic parameters, and compare the overall survival rates.
MATERIALS AND METHODS
Clinical samples
A total of 334 patients with primary breast carcinoma underwent resection at St. Vincent's Hospital (Suwon, Korea) between January 1999 and August 2007. Formalin fixed paraffin embedded (FFPE) tissue and clinical data were collected retrospectively. All of the archival hematoxylin and eosin (H&E) stained slides for each patient were reviewed. The nuclear grades and histologic grades were evaluated according to the Nottingham grading system.9 The tumor stages were evaluated according to the 7th edition of the American Joint Committee on Cancer (AJCC) criteria. A total of 322 cases were available with patient survival data. This study was approved by the Institutional Review Board of The Catholic University of Korea (VC10SISI0093).
Tissue microarray (TMA)
TMA blocks were constructed containing 334 invasive carcinoma specimens from the FFPE tissue. The representative tumor site was chosen on H&E slides, and the site corresponding to the confirmed tumor site in the paraffin block was marked. The selected area was harvested using a 2 mm Quick-Ray tip-punch (Micro Digital Co., Seoul, Korea) and was transferred to a TMA mold. The H&E stained slides of the TMA blocks confirmed whether or not the appropriate tumor site had been selected.
Immunohistochemistry
Immunohistochemical staining was conducted on 5 µm sections of the TMA blocks. The paraffin sections were mounted on poly-L-lysin coated glass slides, deparaffinized, and then they were rehydrated in a graded series of ethanol, followed by microwave antigen retrieval. Endogenous peroxidase activity was blocked by treating the slides with 3% H2O2 in methanol for 10 minutes at room temperature. The primary antibodies were incubated overnight at 4℃. The following primary antibodies were used: Shh (1:200, EP1190Y, Epitomics, Burlingame, CA, USA), Ptch (1:200, ab53715, Abcam, Cambridge, MA, USA), Smo (1:100, ab72130, Abcam), Gli-1 (1:50, ab92611, Abcam), Gli-2 (1:400, ab7181, Abcam), Gli-3 (1:400, PAB-10052, Abnova, Taipei, Taiwan), ER (1:300, 6F11, Novocastra, Newcastle upon Tyne, UK), progesterone receptor (PR; 1:600, 16, Novocastra), HER2 (1:1,800, polyclonal, Dako, Glostrup, Denmark), and Ki-67 (1:200, MM1, Novocastra). Immunostaining was conducted using the rabbit or mouse DAKO ChemMate EnVision system and Peroxidase/DAB kit (Dako). The sections were then counterstained with Meyer hematoxylin and then dehydrated, cleared, and mounted.
The immunohistochemical staining and the histology were examined independently by two pathologists. The cases with discrepant scores were discussed in order to obtain a consensus. The immunoreactivity was interpreted in the cytoplasm for the Shh, Ptch, and Smo, and in the nucleus for the Gli-1, Gli-2, and Gli-3. The staining intensity was graded as follows: 0, negative; 1, weak; 2, moderate; and 3, intense; and the proportion was graded according to the percentage of positive cells as follows: 0, <5%; 1, 5-25%; 2, 26-50%; 3, 51-75%; and 4, >75%. The intensity score and proportion score were multiplied in order to generate an immunoreactive score (IS). Negative expression was defined as an IS lower than 4.
Tumor phenotype classification
The breast cancer phenotypes were classified according to the 2011 St. Gallen consensus.10 The immunohistochemical staining for the ER and PR was evaluated using the Allred method.11 An Allred score of 3 or higher was considered positive. The immmunohistochemical results for HER2 were defined as follows: 0, no staining; 1+, weak incomplete membranous staining in any proportion of tumor cells; 2+, complete membranous staining weak in intensity of >10% of tumor cells; and 3+, intense complete membrane staining of >30% of the invasive tumor cells. Values of 0 and 1+ were considered negative; 2+, equivocal; and 3+, positive. The equivocal cases were reassigned after silver in situ hybridization. The phenotypes were classified as follows; luminal A (LumA) type: ER and/or PR positive, HER2 negative, and Ki-67 index<14%; luminal B HER2 negative (LumB HER2 neg) type: ER and/or PR positive, HER2 negative, and Ki-67 index≥15%; luminal B HER2 positive (LumB HER2 pos) type: ER and/or PR positive, HER2 positive, and any Ki-67 index; HER2 positive (HER2) type: ER, PR negative, and HER2 positive; and triple negative type: ER, PR, and HER2 negative.
Statistical analysis
Statistical analyses were performed by using SPSS for Windows ver. 13.0 (SPSS Inc., Chicago, IL, USA). The two-sided p-values were determined via chi-square tests. The patients' overall survival was analyzed using the Kaplan-Meier method with the use of the log-rank test for univariate analysis. A value of p<0.05 was considered significant for all of the analyses.
RESULTS
Patient characteristics
The mean age of the 334 total patients was 51.3 years (range, 30 to 82 years). The clinicopathological data of our study population are presented in Table 1. Follow-up data were available for 322 patients and the median follow-up duration was 75.1 months (range, 0 to 179 months) after the primary surgery. Twenty-one (6.5%) patients had local recurrence, 62 (19.3%) patients developed distant metastasis and 31 (9.6%) patients died during follow up.

Relationship between hedgehog related protein expression and the clinicopathologic factors of breast cancer
Immunohistochemical results for Shh, Ptch, Smo, Gli-1, Gli-2, and Gli-3
The microscopic features of the immunohistochemical staining for each protein are presented in Fig. 1. Shh, Ptch, and Smo were stained in the cytoplasm. Gli-1, Gli-2, and Gli-3 had a nuclear staining pattern. Of the 334 breast carcinoma cases, the Shh, Ptch, Smo, Gli-1, Gli-2, and Gli-3 were expressed in 164 (49.1%), 70 (21.0%), 75 (22.5%), 141 (42.2%), 252 (75.4%), and 37 (11.1%) cases, respectively.
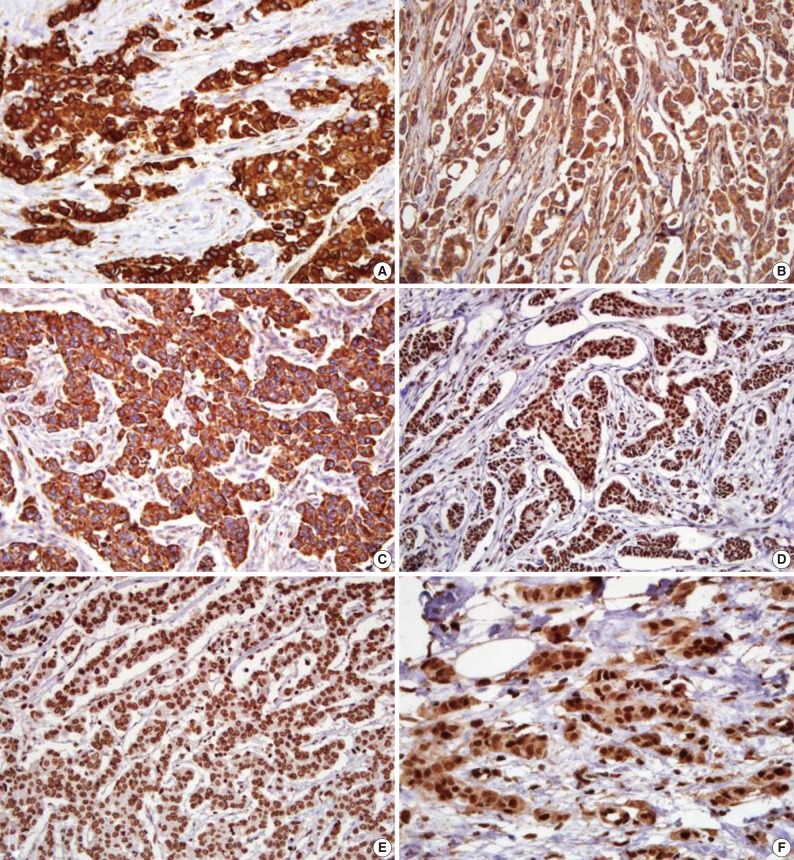
Immunohistochemical results for sonic hedgehog (Shh), patched (Ptch), smoothened (Smo), glioma-associated oncogene (Gli)-1, Gli-2, and Gli-3. (A) Shh immunostaining shows a strong cytoplasmic pattern in tumor cells. (B) Ptch is expressed in the cytoplasm of tumor cells. (C) Smo shows diffuse strong staining in the cytoplasm of tumor cells. (D) Gli-1 is expressed in the nucleus of tumor cells. (E) Gli-2 is expressed in a nuclear pattern. (F) Gli-3 is expressed in the nucleus of tumor cells (avidin-biotin-peroxidase complex staining).
Relationship between the expression of Shh, Ptch, Smo, Gli-1, Gli-2, and Gli-3 and the clinicopathological factors
The correlations between the Shh, Ptch, Smo, Gli-1, Gli-2, and Gli-3, and the clinicopathological variables are presented in Table 1. Lymph node metastasis was correlated with the expression of Shh (p=0.001) and Ptch (p=0.064). Shh and Gli-3 expression was significantly correlated with the stage (p=0.007 and p=0.024, respectively). The nuclear grade was related to the Smo (p=0.004) and Gli-3 (p=0.000). The histologic grade was related to the Ptch (p=0.016), Smo (p=0.007), and Gli-3 (p=0.000). The ER expression was related to the Ptch (p=0.012), Smo (p=0.000), Gli-1 (p=0.008), and Gli-2 (p=0.000). The PR expression was related to the Smo (p=0.001) and Gli-1 (p=0.031). HER2 showed a significant correlation with the Shh (p=0.000) and Gli-3 (p=0.002).
Relationship between the Hh related protein expression and the breast cancer phenotype
The correlation between the Shh, Ptch, Smo, Gli-1, Gli-2, and Gli-3, and the breast cancer phenotypes according to the 2011 St. Gallen consensus are presented in Table 2. Shh, Ptch, Smo, Gli-1, and Gli-2 expression varied significantly between phenotypes (p=0.000, p=0.001, p=0.004, p=0.039, and p=0.031, respectively). Shh expression was observed in 143 (49.3%) cases and was higher in the HER2 type (74.1%). Ptch expression was present in 70 (21.0%) cases, and was higher in the LumB HER2 neg type (44.2%). Smo expression was observed in 65 (22.4%) cases and was higher in the HER2 type and triple negative type (31.0% and 30.9%, respectively). Gli-1 expression was present in 119 (41.0%) cases and was higher in the LumB HER2 pos type (64.0%). Gli-2 expression was observed in 215 (74.1%) cases and was higher in the luminal types: LumA (85.1%), LumB HER2 neg (81.4%), and LumB HER2 pos (80.0%). Gli-3 expression did not differ significantly among the phenotypes (p=0.282).

Relationship between hedgehog related protein expression and breast cancer phenotype
Survival analysis
The overall survival rates according to the clinicopathologic and immunohistochemical parameters are summarized in Table 3. The stage (p=0.000) was significantly correlated with the patients' overall survival. Among the Hh related proteins that were analyzed, the Gli-2 positive group had a significantly worse survival rate than the Gli-2 negative group (p=0.012) (Fig. 2). The Shh, Ptch, Smo, Gli-1, and Gli-3 did not show statistical significance related to the patients' prognosis.

Kaplan-Meier analysis of the overall survival rates
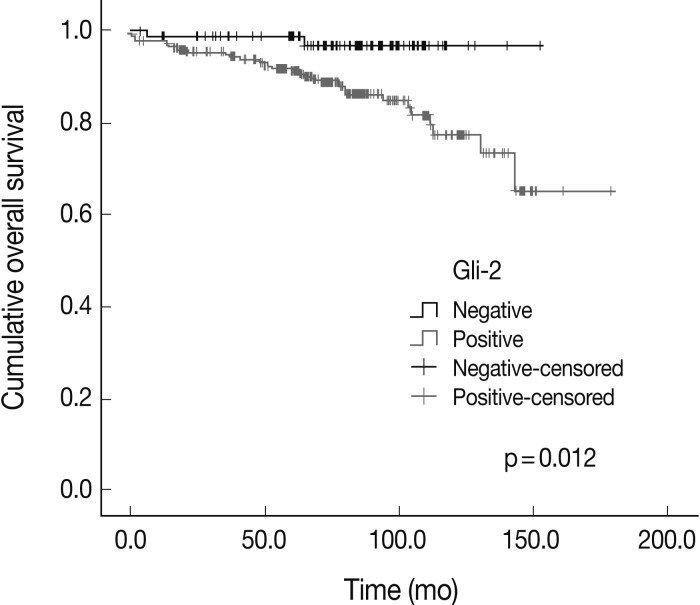
Kaplan-Meier survival analysis in breast carcinoma. Patients with glioma-associated oncogene 2 (Gli-2) expression have a poor overall survival rate (p=0.012).
DISCUSSION
The Hh signaling pathway, initially discovered in the Drosophila, is known to play a crucial role in controlling cell fate and patterning during embryogenesis.12 Disruption of the Hh signaling pathway results in congenital brain, facial, and other midline defects. Mutational activation of the Hh signaling pathway is primarily associated with basal cell carcinoma and medulloblastoma.3,4 Ligand-dependent activation has also been reported in various types of malignancies, such as small cell lung carcinoma and carcinomas of the stomach, pancreas, prostate, uterine cervix, colon and breasts.2,6,7,13-20
Kubo et al.2 evaluated the expression of Shh, Ptch, and Gli-1 by immunohistochemical staining in 52 cases of human breast carcinoma. Tumor cells overexpressed the Shh, Ptch and Gli-1 in 52, 50, and 52 of the 52 total specimens, respectively. In addition, four human breast carcinoma cell lines showed increased expression of Shh, Ptch, and Gli-1. However, according to their results, there was not a statistically significant difference between the T stage, lymph node involvement, and overall tumor node metastasis (TNM) stage. Ten Haaf et al.21 determined that elevated levels of the Gli-1 protein in human breast cancer were correlated with aggressive behavior of the cancer, such as higher tumor stages and lymph node status. Our data suggests that the overexpression of Hh related proteins are associated with a larger tumor size (Gli-3), higher lymph node status (Shh, Ptch, and Gli-3), advanced stages (Shh and Ptch), higher nuclear grades (Smo and Gli-3), and higher histological grades (Smo), all of which indicate more aggressive tumor behavior.
There has been limited data on Hh related proteins and the actual overall survival in patients with breast carcinomas. According to ten Haaf et al.,21 the high Gli-1 expression groups had an unfavorable overall survival rate. O'Toole et al.18 evaluated Hh overexpression in a group of 279 patients with invasive ductal carcinoma of the breast, and reported that the expression of the Hh ligand was significantly associated with an increased risk of metastasis and breast-cancer specific death. There are a few studies on Hh related protein expression and the survival of malignancies in other organs. Zhang et al.22 reported that Gli-2 expression was correlated with poor prognosis in patients with hepatocellular carcinomas. Ding et al.23 reported that post-operative liver metasis-free survival was significantly lower with high Smo expression in colon cancer. On the other hand, Lee et al.24 reported that the Ptch and Gli-2 positive groups had a better overall survival rate for gastric adenocarcinomas. However, Gli-2 expression showed a worse overall survival rate in breast carcinomas in our study, which supported the previously discussed results that Hh related protein expression is correlated with clinicopathologic features resulting in more aggressive behavior.
Gli-2, one of three members of the mammalian Gli transcription factor family, is primarily known as a transcriptional activator that mediates the cellular response of Hh signaling.3 Lewis25 demonstrated that disruption of Gli-2 in mouse mammary gland development led to ductal dysplasias that closely resembled some hyperplasia of human breast. However, there is only limited data available regarding Gli-2 and human breast cancer. According to Xuan and Lin,26 Gli-2 expression is related to PR expression, the Ki-67 proliferating index, node metastasis, and the clinical stage. Our study is the first to report that Gli-2 expression had a worse overall survival rate in breast carcinomas. This result suggests the possibility that Gli-2 could be used as a prognostic marker to select patients for aggressive treatment.
In 2011, the 12th St. Gallen International Breast Cancer Conference Expert Panel adopted a new approach to the classification of patients for therapeutic purposes.10 For practical reasons, this approach uses immunohistochemical results of ER and PR, the HER2 status, and the Ki-67 proliferating index in order to identify tumor subtypes. The additional Ki-67 proliferating index has divided the previously known 'luminal A' type (ER and/or PR positive, HER2 negative) into LumA (ER and/or PR positive, HER2 negative, and Ki-67 index<14%) and LumB HER2 neg type (ER and/or PR positive, HER2 negative, and Ki-67 index≥15%). The key to this new classification is to coordinate the subtypes with treatment. The LumB HER2 neg type may need systemic chemotherapy due to the high Ki-67 index.
According to our results, Shh expression was higher in the HER2 type, Ptch expression was higher in the LumB HER2 neg type, and Gli-1 expression was higher in the LumB HER2 pos type. These phenotypes all need additional cytotoxic chemotherapy in addition to endocrine therapy or trastuzumab. The Hh pathway could be a therapeutic target for chemotherapy in these cases. The Smo expression was significantly higher in both the HER2 and triple negative types, which also require cytotoxic agents for chemotherapy. The steroid alkaloid cyclopamine inhibits the Hh pathway activation via the direct bonding of Smo.27 This effect suggests that cyclopamine derivatives could be a possible therapeutic agents for breast carcinomas. The Gli-2 expression was higher in the LumA, LumB HER2 neg, and LumB HER2 pos types. These three types are ER and/or PR positive types. Xuan and Lin26 reported that Gli-2 expression was related to PR expression. However, the full relationship between Gli-2 and hormone receptors has yet to be discovered.
In summary, our data showed that the expression of Shh, Ptch, Smo, Gli-1, Gli-2, and Gli-3 was significantly correlated with a variety of clinicopathological indicators, indicating that Hh pathway activation is correlated with more aggressive clinical behavior. Most of all, patients with Gli-2 expression had a considerably worse prognosis based on overall survival rates, which showed that Gli-2 is a promising prognostic marker. Evaluation of the Hh related proteins may predict a patient's outcome and be useful in selecting patients for aggressive treatment. The Hh related protein expression comparison between phenotypes suggests that the Hh pathway may be a useful therapeutic target for chemotherapy in breast carcinomas.
Acknowledgments
This study was supported by grants from St. Vincent's Hospital Research Center in 2010.
Notes
No potential conflict of interest relevant to this article was reported.