Prognostic Implication of Semi-quantitative Immunohistochemical Assessment of CD20 Expression in Diffuse Large B-Cell Lymphoma
Article information
Abstract
Background:
Immunohistochemical demonstration of CD20 in diffuse large B-cell lymphoma (DLBCL) is prerequisite not only for the diagnosis but also for assigning patients to rituximab-containing chemotherapy. However, little is known about the impact of abundance of CD20 expression assessed by immunohistochemistry on the clinical outcome of DLBCL. We performed a semi-quantitative immunohistochemical analysis of CD20 expression in DLBCL to examine the prognostic implication of the level of CD20 expression.
Methods:
Pre-treatment diagnostic tissue samples from 48 DLBCL patients who were treated with rituximab, cyclophosphamide, doxorubicin, vincristine, and prednisone (R-CHOP) regimen were represented in a tissue microarray and immunostained for CD20. The relative abundance of CD20 expression was semi-quantitatively scored using a web-based ImmunoMembrane plug-in. Receiver operating characteristic curve analysis was used to determine a prognostically relevant cut-off score in order to dichotomize the patients into CD20-high versus CD20-low groups.
Results:
The levels of CD20 expression were heterogeneous among the patients, with a wide and linear distribution of scores. Patients in CD20-low group showed significantly poor clinical outcome.
Conclusions:
The levels of CD20 expression in DLBCL are heterogeneous among the patients with DLBCL. A subgroup of the patients with CD20 expression levels below the cut-off score showed poor clinical outcome.
Diffuse large B-cell lymphoma (DLBCL) is the most aggressive non-Hodgkin lymphoma that is potentially curable with conventional cyclophosphamide, doxorubicin, vincristine, and prednisone (CHOP) chemotherapy [1]. Even though the addition of rituximab to standard CHOP chemotherapy dramatically improved the survival of the patients, some patients fail to respond to rituximab, cyclophosphamide, doxorubicin, vincristine, and prednisone (R-CHOP) regimen. Furthermore, relapse of disease after standard chemoimmunotherapy has been documented to be roughly up to 50% [2]. In rituximab-era, immunohistochemical demonstration of CD20 in the cell membrane of the lymphoma-cells is prerequisite not only for histopathologic diagnosis of DLBCL but also for assignment of the patients to front-line rituximab-containing immunochemotherapy. However, the prognostic significance of relative abundance of immunohistochemically assessed CD20 expression on the formalin-fixed paraffin-embedded tissue (FFPET) sections of the diagnostic tissue samples has not yet been investigated.
Rituximab is a CD20-directed chimeric monoclonal antibody that depletes the tumor cells with CD20 expression in their cytoplasmic membrane through mechanisms including inhibition of cell proliferation, induction of apoptosis, and antibody/complement-dependent cytotoxicity [3]. Accordingly, the relative abundance of CD20 in tumor cells could be implicated in the clinical outcome of the patients treated with R-CHOP regimen. However, there is no immunohistochemical marker that can discriminate patients who are beyond the benefits of the addition of rituximab to conventional standard chemotherapy. We hypothesized the relative abundance of CD20, the target molecules of rituximab on the cell membrane of the tumor cells, could be implicated in the prognosis of DLBCL patients treated with standard R-CHOP therapy. In this study, we performed a semiquantitative immunohistochemical analysis of CD20 expression in a tissue microarray (TMA) cohort of DLBCL tumor tissues and correlated the CD20 level with clinical outcome.
MATERIALS AND METHODS
TMA cohort
We searched the surgical pathology archives for cases diagnosed with de novo DLBCL in Inha University Hospital between January 2006 and December 2013. Among them, we included the patients who received six to eight cycles of standard R-CHOP chemotherapy. Having excluded the primary central nervous system lymphomas and cases diagnosed based on small biopsy specimens such as endoscopic biopsy or needle biopsy, a total of 48 patients with complete outcome data were eligible for the preparation of TMA cohort, including 27 male and 21 female with a median age of 58.5 years (range, 20 to 81 years). Two 1-mm duplicate cores from the diagnostic FFPET samples were represented on a TMA by using a self-made TMA and a home-made recipient block as described previously [4].
Immunohistochemical staining of TMA sections
Using an automated immunohistochemical stainer (Bench-MarkXT, Ventana, Tucson, AZ, USA), sections of the TMA cut in 4-μm thickness were routinely processed for immunohistochemical stains for CD20 (1:500, H1, heat-induced antigen retrieval, BD Pharmingen, San Jose, CA, USA), BCL2 (1:100, 124, heat-induced antigen retrieval, Dako, Carpinteria, CA, USA), BCL6 (1:30, PG-B6p, heat-induced antigen retrieval, Dako), CD10 (pre-diluted, SP67, heat-induced antigen retrieval, Ventana), and MUM1 (1:100, MUM1p, heat-induced antigen retrieval, Dako). Cases were designated as positive when ≥30% of the tumor cells were immuoreactive for all antibodies except for CD20 [5]. Cases were classified into germinal center B-cell versus non-germinal center B-cell type according to Hans classification [6].
Quantification of CD20 levels
The whole image of CD20-stained TMA section was digitalized using a digital slide scanner (VM600, Motic, Ximen, China) using a ×20 objective (Fig. 1). Then, representative JPEG images were acquired from each tissue sample (Fig. 1). CD20 immunoreactivity within each JPEG image was semi-quantitatively assessed using ImageJ software (http:/rsbweb.nih.gov/ij/) coupled with ImmunoMembrane plug-in (http://imtmicroscope.uta.fi/immunomembrane) [7]. Completeness (0–10 points) and intensity (0–10 points) of membrane staining was added for a score (0–20 points) (Fig. 2). Then, we used the average of the duplicates in analysis as the arbitrary level of CD20 for each case.
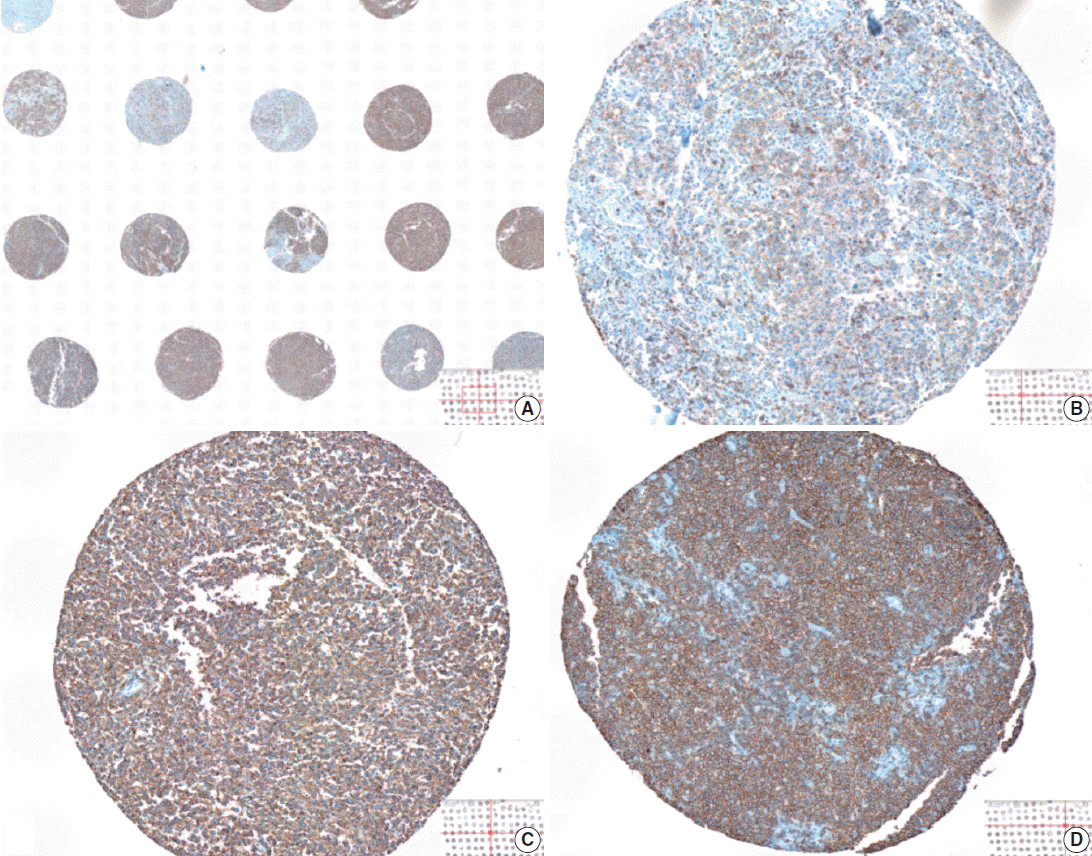
Visual heterogeneity in the intensity of CD20 staining in large B-cell lymphoma tumor tissues represented in a tissue microarray. The levels of CD20 expression is visually heterogeneous among tumor tissues (A), ranging from weak (B), intermediate (C), to strong (D) intensity of the 3,3’-diaminobenzidine (DAB) signal.
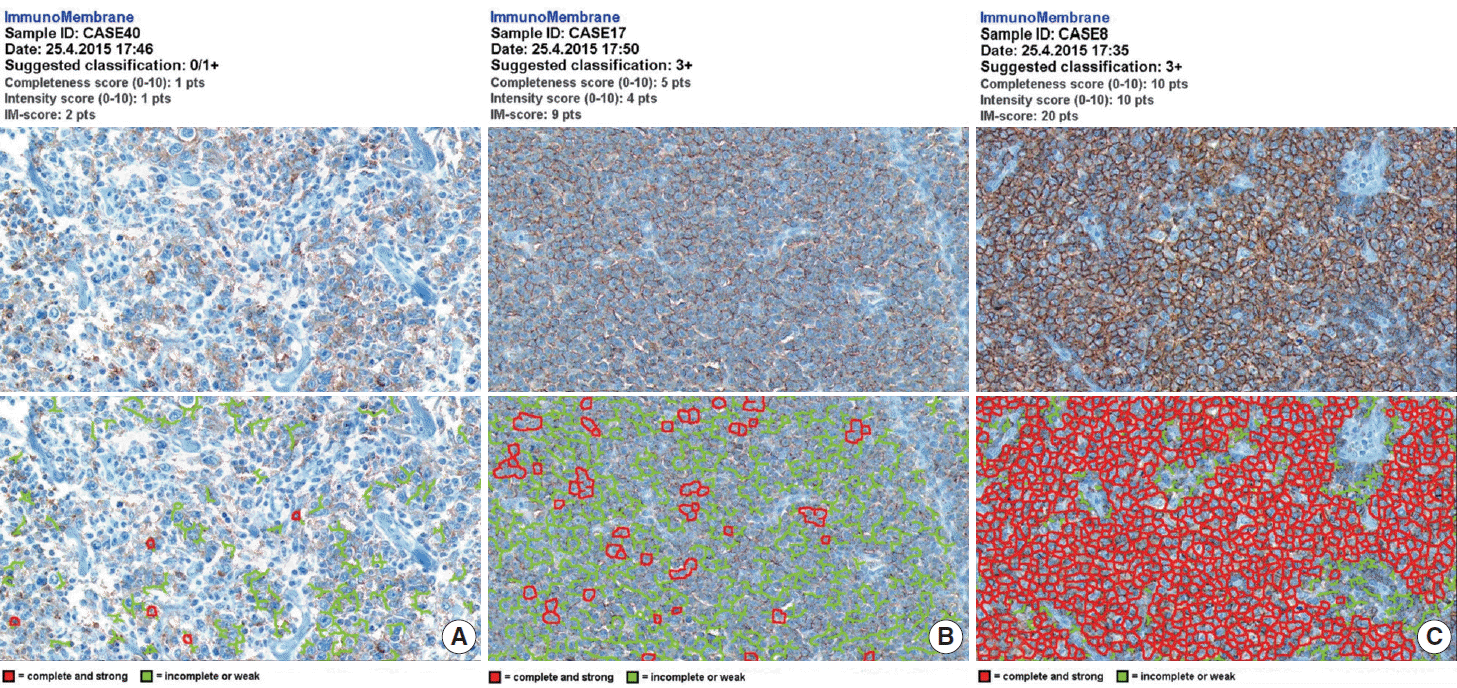
Semi-quantitative immunohistochemical scoring of CD20 expression. The images of weak and incomplete (A, upper), weak and complete (B, upper), and strong and complete (C, upper) staining for CD20 are digitally analyzed using the free web-based ImmunoMembrane (IM) plug-in that produces a combined score of 2 (A, lower), 9 (B, lower), and 20 (C, lower) in its pseudo-color image, respectively.
Statistical analysis
The primary outcomes of interest in this study were overall survival (OS) and event-free survival (EFS). OS was defined as the time interval between the date of diagnosis and the date of death by any cause. EFS was estimated from the date of diagnosis to the date of disease progression, relapse, last contact, or death. Complete response (CR) was determined according to the conventional response criteria. Receiver operating characteristic (ROC) curve analysis was used to select a prognostically relevant cut-off score of CD20 expression that can dichotomize the patients in terms of clinical otucome [8,9]. Kaplan-Meier analysis was used to estimate cumulative survivals and the differences between survival curves were analyzed using log-rank test. Chi-square test or Fisher exact test were used to compare the differences in frequency of categorical variables between two groups. Mann-Whitney U test and Kruskal-Wallis test were used to assess mean differences between the groups. Multivariate regression analysis using the Cox proportional hazards model was performed to determine the hazard ratios (HRs) of the clinicopathologic factors and CD20 levels. All p-values presented were two-sided, and p <.05 was considered statistically significant. All statistical analyses were performed using SPSS ver. 19.0 (IBM Co., Armonk, NY, USA).
RESULTS
Heterogeneity in CD20 levels among patients with DLBCL
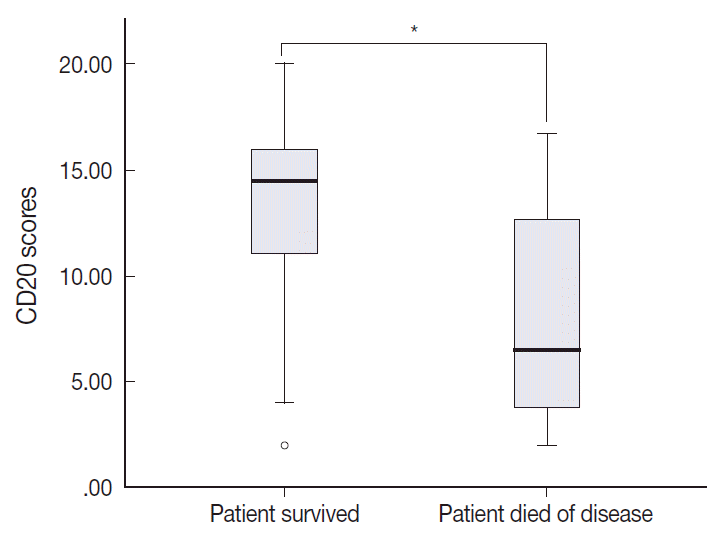
The TMA section immunostained for CD20 exhibited heterogeneous CD20 levels among patients, with a high degree of reproducibility in scores between duplicate tissue cores to duplicate runs (Fig. 3). As indicated by a wide and linear range of the semi-quantitative scores with a negatively skewed distribution of data on the frequency histogram (Fig. 4), the level of CD20 expression was significantly lower in patients who died of disease compared to those survived (p=.012) (Fig. 5).
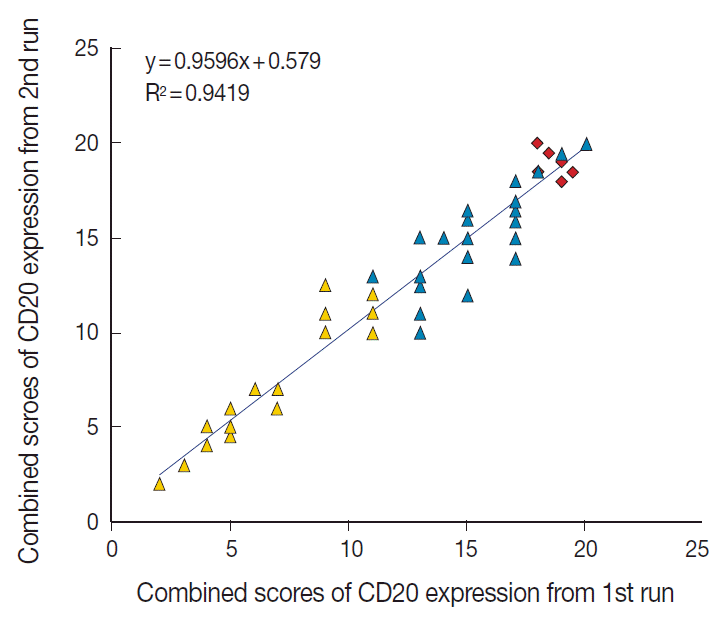
Reproducibility of the immunohistochemical scoring. The combined scores of CD20 expression obtained from the first run of semi-quantitative immunohistochemical scoring are reproducible in the second run. Yellow triangle, CD20-low group; blue triangle, CD20-high group; red rhombus, germinal center of the tonsil as control tissue.
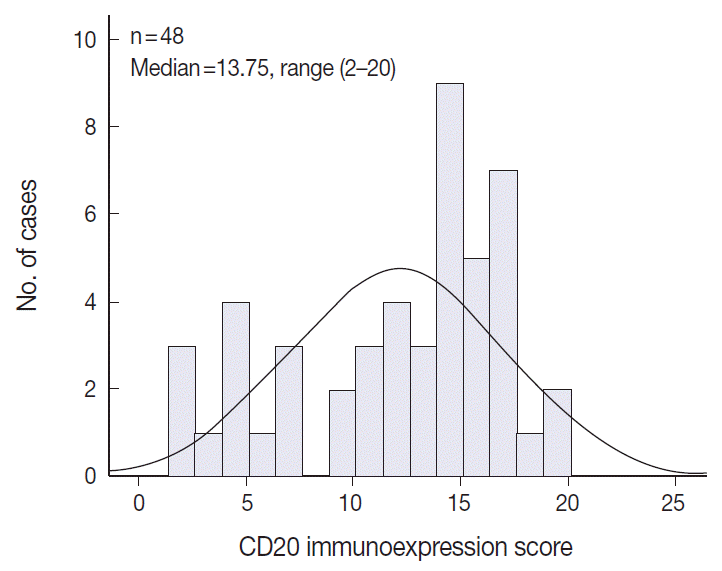
Negatively skewed distribution of the combined scores of CD20 expression. The frequency histogram of the scores illustrates a wide and linear range of the semi-quantitative scores with negatively skewed distribution.
Association between CD20 level and clinical outcome
The median follow-up period was 58.5 months (range, 11 to 125 months). Overall, there were 27 male (56.3%) and 21 female (43.7%) patients, and the median age was 58.5 years (range, 20 to 81 years). After six to eight cycles of R-CHOP chemotherapy, CR was achieved in 41 patients (85.4%) and 11 (11/41, 26.8%) of them experienced relapse.
The outcome-based ROC curve analysis produced a predictive cut-off score of 11.75 in CD20 levels (with an area under the ROC curve of 0.751; 95% confidence interval [CI], 0.571 to 0.930; sensitivity, 72.7%; specificity, 70.3%; p=.012) that could predict poor prognosis in terms of OS (Fig. 6). Based on the predictive cut-off score, the overall patients in our cohort were dichotomized into the CD20-low (n=20, 41.7%) and CD20-high (n=28, 58.3%).
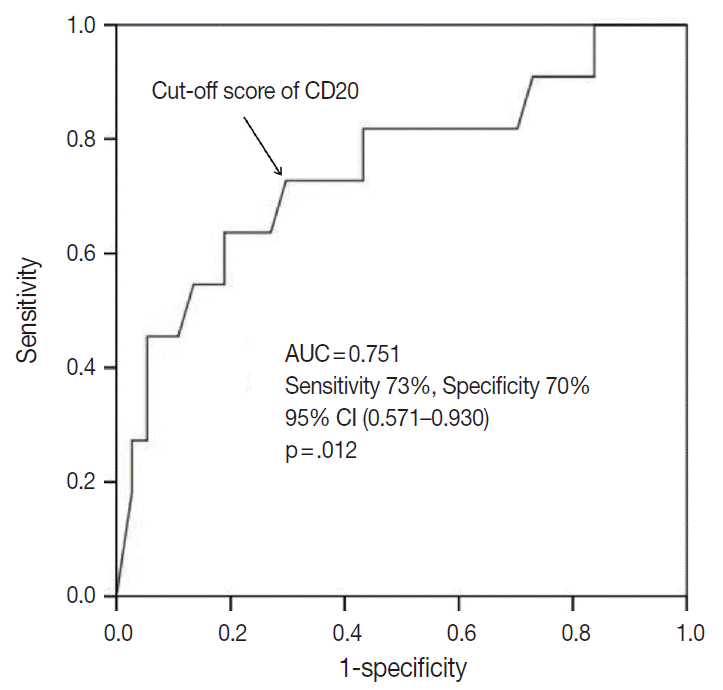
Determination of a cut-off score of CD20 expression level for poor survival outcome. Receiver operating characteristic (ROC) curve analysis was used to determine a statically optimal cut-off score of CD20 expression level for prediction of disease-associated deaths. The cut-off score of 11.75 derived from the ROC curve analysis maximized the sum of sensitivity and specificity (sensitivity, 72.7%; specificity, 70.3%; p = .012). AUC, area under the ROC curve; CI, confidence interval.
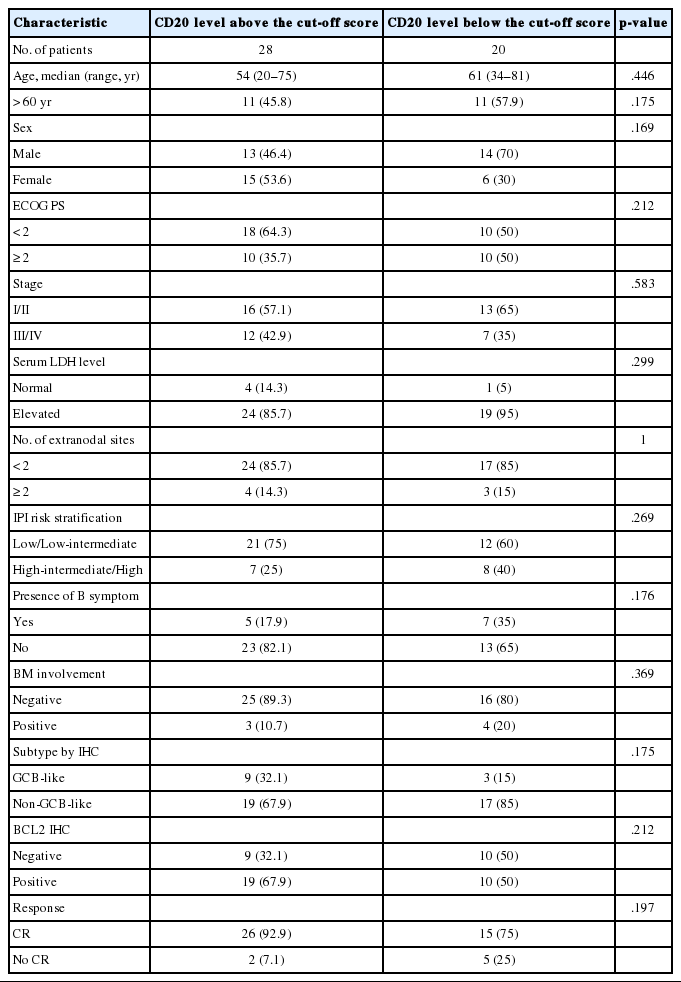
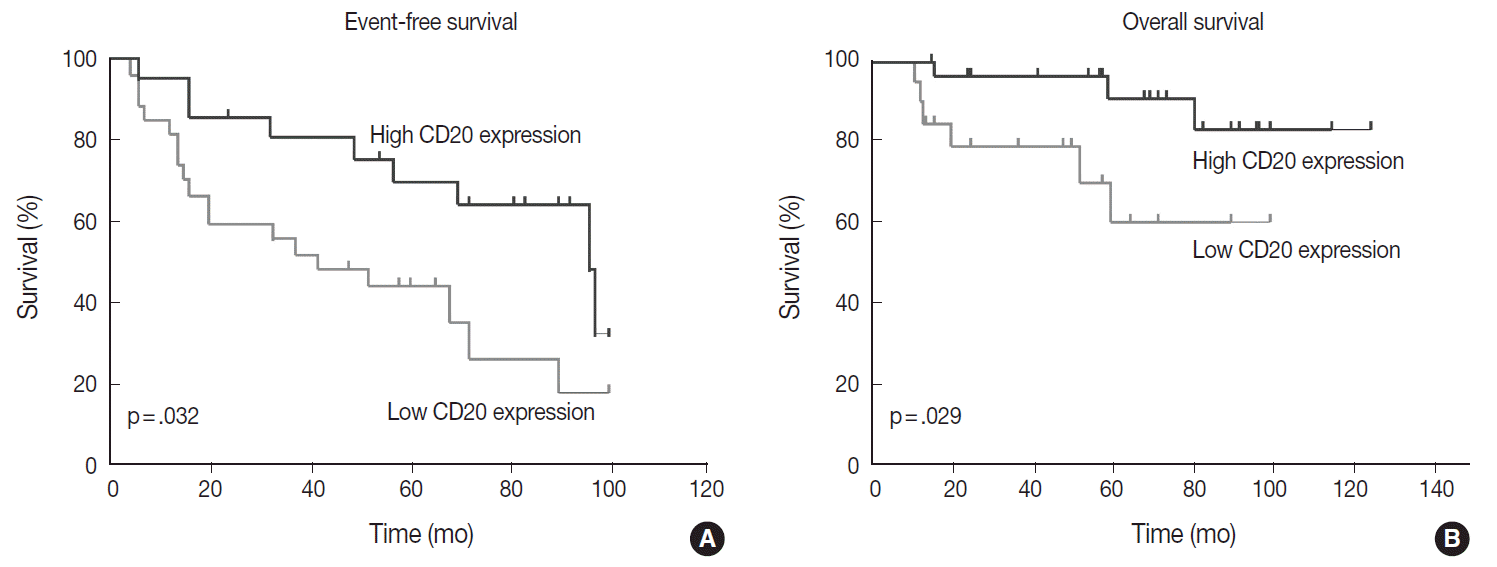
Table 1 shows the distribution of the clinical background characteristics of the patients in the two groups divided according to the CD20 expression level. There were no significant differences in clinicopathologic parameters between the two groups. CR was achieved in 15 patients (75%) in the CD20-low group and 26 patients (92.9%) in the CD20-high group, with no significant difference in CR rate between these two groups (p= .197). Eventually, disease relapse was experienced by four out of 15 patients (26.7%) in the CD20-low group and by seven out of 26 patients (26.9%) in CD20-high group, with no significant difference in relapse rate between these two groups. Clinical events including disease progression were more frequently observed in CD20-low group (14/20, 70%) compared to CD20-high group (13/28, 46.4%), with a significant difference in EFS (median, 37 months [range, 4 to 100 month] vs 96 months [range, 6 to 100 months]) for the CD20-high group (p=.032) (Fig. 7A). The 5-year EFS were 39.4% in CD20-low group and 66.5% in CD20-high group, respectively. Overall, nine patients died, including six deaths in the CD20-low group and three deaths in the CD20-high group. Median OS was 50 months (range, 11 to 100 months) for the CD20-low group and 71 months (range, 15 to 125 months) for the CD20-high group, with a significantly shorter 5-year EFS (39.4% vs 66.5%) and OS (59.9% vs 90.6%) in CD20-low group (Fig. 7B).
Prognostic factor analyses
In the univariate analysis of prognostic factors, following parameters were significantly associated with worse prognosis in terms of both EFS and OS: CD20 level lower than the cut-off score (p=.039 and p=.035) and two or more sites of extranodal involvement (p=.034 and p=.044). In addition, poor performance status with Eastern Cooperative Oncology Group (ECOG) score ≥2 (p=.042) and presence of B symptoms (p=.023) were significantly associated with a poor prognosis in terms of EFS, but not in terms of OS. The stage at diagnosis and International Prognostic Index score were not significantly associated with EFS (p=.423 and p=.099) and OS (p=.576 and p=.530). When all the parameters significant in univariate analysis were included in multivariate analysis, lower CD20 level remained an independent prognostic factor for EFS (HR, 2.187; 95% CI, 1.015 to 4.745; p=.048) and for OS (HR, 4.291; 95% CI, 1.012 to 17.724; p= .043) (Table 2). Two or more sites of extranodal involvement was an independent prognostic factor (HR, 2.768; 95% CI, 1.028 to 7.571; p=.047) for EFS but it was not of prognostic relevance with regard to OS (p=.098). ECOG performance status (ECOG PS) ≥2 (p=.125) and presence of B symptoms (p=.095) were not found to be in correlation with OS in multivariate analysis.
DISCUSSION
The prognostic significance of the traditional clinicopathologic parameters of DLBCL seems to be overshadowed by the introduction of R-CHOP as a standard regimen for DLBCL [8-10]. Bcl-2 expression assessed by immunohistochemical staining seems to be no longer associated with a poor outcome in DLBCL patients treated with R-CHOP [11]. In addition, the prognostic value of immunophenotypic subtype determined by immunohistochemistry for CD10, Bcl-6, and MUM1 is questioned in rituximab era [12,13]. Furthermore, the predictive significance of International Prognostic Index that has been the most important prognostic factor for DLBCL in pre-rituximab era also seems to be overridden by the addition of rituximab to CHOP regimen [14].
When assessed semi-quantitatively using flow cytometry (FCM) analysis, the levels of CD20 expression in the fresh tissue sample were quite heterogeneous both among and within different types of non-Hodgkin B-cell lymphomas [15,16]. In addition, the level of CD20 expression at the onset of disease seems to be an independent predictor for poor outcomes in patients treated with R-CHOP [15,17,18]. FCM analysis of fresh tissue sample, however, is not a routine practice in many institutions with limited resources. Furthermore, fresh tissue samples for FCM analysis are not always available. Accordingly, immunohistochemical assessment of CD20 expression in diagnostic tissue samples in forms of paraffin blocks should be a more feasible method both in terms of low cost and convenience in sample recruitment.
There has been no previous literature specific to the distribution of immunohistochemical levels of CD20 expression in the diagnostic FFPET samples of DLBCL and their association with the prognosis of the patients. In this study, we used a free web-based image analysis tool that enabled us to acquire objective semi-quantitative scores of CD20 expression levels based on intensity and completeness of CD20-immunostaining of the FFPET sections. As indicated by the previous investigations using FCM analysis of fresh tissue samples, the levels of CD20 expression assessed by semi-quantitative immunohistochemistry were quite heterogeneous among the patients, with scores spread over a wide and linear range. By correlating the expression level of CD20 with the clinical outcomes, we were able to identify a subgroup of DLBCL patients with CD20 expression levels below the cut-off score, who showed poor EFS and OS independent of other known clinical and pathologic parameters. Further studies are warranted to validate the prognostic role of the relative abundance of CD20 expression in a larger cohort.
Interestingly, Shimizu et al. [19] recently reported that histone deacetylase (HDAC) inhibitors augment cytotoxic effect of rituximab by increasing the level of CD20 in the cell lines of DLBCL. Accordingly, the patients with lower levels of CD20 expression who could be less amenable to rituximab therapy could probably benefit from pretreatment of HDAC inhibitors such as valproic acid prior to the standard R-CHOP treatment [20]. Alternatively, they could more likely benefit from the treatment with novel anti-CD20 monoclonal antibodies which show more anti-cancer activity in CD20 low-expression B-cell lymphomas. For example, ofatumumab (a fully human anti-CD20 monoclonal antibody) and obinutuzumab (a humanized type II antibody targeted against CD20) have been shown to be active and safe in clinical trials that had included patients with chronic lymphocytic leukemia which is known to have relatively lower levels of CD20 expression [21,22].
In conclusion, a level of CD20 expression is heterogeneous in DLBCL and lower level of CD20 expression is a poor prognostic marker for survival in patients with DLBCL who are treated with R-CHOP chemotherapy. Semi-quantitative immunohistochemical estimation of CD20 expression can be used to identify a subgroup of DLBCL patients with poor outcome who might possibly benefit from the pretreatment with agents that can increase the level of CD20 expression in the cell membranes of the tumor cells.
Notes
Conflicts of Interest
No potential conflict of interest relevant to this article was reported.
Acknowledgements
This work was supported by Inha University Research Grant. The authors wish to thank Yu Hwan Lim, Kyung Hwan Jang, Yong Hoon Lee, Young Min Lee, and Seok Joon Hong in the histology lab for their technical support and advice in the construction of the TMA blocks and Kyung Shin Kim and Eun Sook Kim in the immunopathology section for their excellent immunohistochemistry.
