DNA-protein biomarkers for immunotherapy in the era of precision oncology
Article information
Abstract
The use of biomarkers to guide patient and therapy selection has gained much attention to increase the scope and complexity of targeted therapy options and immunotherapy. Clinical trials provide a basis for discovery of biomarkers, which can then aid in development of new drugs. To that end, samples from cancer patients, including DNA, RNA, protein, and the metabolome isolated from cancer tissues and blood or urine, are analyzed in various ways to identify relevant biomarkers. In conjunction with nucleotide-based, high-throughput, next-generation sequencing techniques, therapy-guided biomarker assays relying on protein-based immunohistochemistry play a pivotal role in cancer care. In this review, we discuss the current knowledge regarding DNA and protein biomarkers for cancer immunotherapy.
Translational research is a two-way process in which new findings from basic research are applied in clinical trials and development of new drugs or treatments. Samples of DNA, RNA, proteins, the metabolome, etc. collected from cancer tissues and blood or urine are analyzed in clinical trials to search for valuable and relevant biomarkers that are crucial for drug development. Next-generation sequencing (NGS) has helped us understand and characterize many cancers, identify new cancer subtypes, develop biomarkers, and discover new treatment targets. NGS also has allowed us to learn about the mutational landscape of several cancers and to develop technologies and drugs targeting “driver” molecular abnormalities. Thus, the oncological community considers NGS as a tool to improve the effectiveness of cancer treatment. Comprehensive, integrated molecular analyses identify molecular relationships across a diverse set of human cancers, suggesting future directions to explore clinical actionability in cancer treatments [1]. Early successes in targeting and identifying individual oncogenic drivers and increased feasibility of tumor genome sequencing have made possible genome-driven oncology care [2]. We are now using NGS to capture genetic algorithms and register them for clinical trials.
Immunotherapy, especially use of immune checkpoint inhibitors (ICI), has led to dramatic changes in the treatment of several types of cancer in recent years [3]. Given that a small number of patients experience a long-lasting response, development of biomarkers to predict responsiveness to immunotherapy has become important. The most widely investigated biomarkers for immunotherapy are programmed death-ligand 1 (PD-L1), microsatellite instability/defective mismatch repair (MSI/dMMR), and tumor mutational burden (TMB). Although MSI/dMMR has been used for immunotherapy regardless of tumor type, PDL1 is being used in specific cancer types [3]. In this article, we concisely review the applications of NGS and immunohistochemistry (IHC)-based protein biomarkers, especially PD-L1, in precision oncology and clinical trials.
TUMOR MUTATIONAL BURDEN
Clinical significance and cut-off points
Although not yet approved for clinical use, TMB has been shown to predict the response to several forms of immunotherapy across multiple cancer types. Specifically, cancer patients with a high neoantigen load or high TMB are more likely to have a good clinical response to ICI [4].
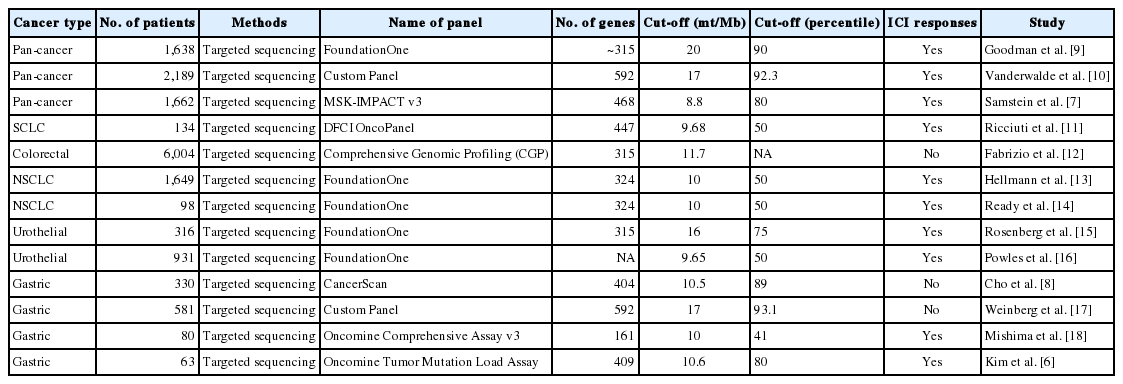
While not all mutations result in immunogenic neoantigens and determining which mutations are likely to induce immunogenic neoantigens remains a challenge, TMB represents a quantifiable measure of the number of mutations in a tumor that can be used for treatment selection [5]. TMB has been traditionally determined using whole-exome sequencing (WES); however, the high cost and long work time limit its widespread use in clinical settings. Therefore, current precision oncology platforms generally use NGS of targeted gene panels [6]. A recent study analyzing clinical data from 7,033 ICI- and non-ICI–treated advanced-stage cancer patients and genomic data from cancers sequenced with targeted NGS showed that higher somatic TMB (highest 20% in each histology subtype) was associated with better overall survival in all patients [7]. However, the TMB cut-off points associated with improved survival varied markedly between cancer types, suggesting that a universal definition of high TMB may not be possible. Similar findings in patients with gastric cancer were observed when the following cut-off points were applied: 11% for the higher mutation group in 330 non-ICI–treated patients [8] and 14.31 mt/mb in 63 ICI-treated patients [6].
Despite efforts to standardize TMB from multiple genomic profiling cancer panels [4], the cut-off value for TMB remains inconsistent. TMB is generally defined as the number of non-synonymous somatic mutations per megabase of genome examined, and a detailed description of TMB definitions in recently published papers using targeted sequencing is summarized in Table 1 [6–18].
Factors affecting tumor mutation burden
Measurement of mutation load using WES can be difficult due to its high cost and extensive analysis and data management requirements. To be applicable in a clinical setting, the following requirements need to be met: the test must be suitable for clinical samples even with a limited amount of DNA; and the test results should be delivered within a limited time, be accurate, help clinical decision-making, and must be affordable. Thus, targeted sequencing with comprehensive gene panels is desirable because of the lower sequencing costs, lower DNA input amounts, and shorter turnaround time [19]. However, the following factors affect TMB calculation: (1) Contents of tumor cell and coverage of sequencing, as targeted cancer panels enable deeper sequencing compared with WES. (2) Presence of sequence artifacts that can be caused by formalin fixation as formalin can cause various crosslinks and is a well-known source of sequencing artifacts due to fragmentation of DNA, denaturation, and deamination of cytosine bases. Specifically, using formalin-fixed paraffin-embedded tissues for NGS causes an increase in DNA sequence artifacts (C:G > T:A) [20].
Pre-analytical factors also affect TMB measurement [19]. Among the most important factors are the size and number of genes included within the targeted cancer panel. The most widely used panels are the MSK-IMPACT panel, which in its latest version targets 468 genes (1.22 Mb of the genome), and the Foundation Medicine Panel, which targets 315 genes (1.2 Mb). Recently, two commercially available panels have been developed: the Oncomine Tumor Mutation Load Assay (Life Technologies; 409 genes, 1.7 Mb) and the TruSight Oncology 500 (Illumina; 523 genes, 1.94 Mb). As the size of panels decreases, the zone of uncertainty associated with TMB measurement rapidly increases. Moreover, uncertainty rapidly increases when the size of the panels is less than 1 Mb. Therefore, a minimum panel size of 300 genes or 1 Mb has been suggested for TMB determination [5,21]. The final factor is the bioinformatic pipeline. For tumor-only sequencing in a clinical setting, germline false-positive variants can be filtered out using large, publicly available germline variant data sets. Use of germline databases is a critical step in measurement of TMB. These germline databases need to provide a sufficiently broad representation of all populations and patients with ethnic backgrounds whose underrepresentation would result in elevated rates of germline false-positive mutations [19]. The factors influencing TMB measurements and cut-off values are summarized in Table 2.
MICROSATELLITE INSTABILITY
Clinical significance
Microsatellite instability–high (MSI-H) is characterized by accumulation of mutations, such as insertion or deletion of a small number of nucleotides, in microsatellites (repeated sequences of 1–9 nucleotides) [22]. The MSI phenotype has been extensively studied in colorectal cancer and is caused by deficiency in the DNA mismatch repair (MMR) system [23–25]. MSI has recently been shown to occur in 6%–20% of colorectal cancer, 9%–20% of gastric cancer, and 17%–31% of endometrial cancer patients, with an incidence < 5% in other cancer types [26]. In addition, MSI correlates positively with survival outcome and predicts the response to ICI therapy [27]. For MSI, different microsatellites and microsatellite panels have been proposed, including the Bethesda/NCI panel, which is the gold standard microsatellite panel for MSI detection. Continuous development of NGS has resulted in the emergence of new computational algorithms allowing detection of MSI and changes in the standard of MSI detection in cancer [27].
Diagnosis of MSI with NGS
To diagnose MSI, conventional IHC or polymerase chain reaction (PCR) methods are widely used. For an IHC test to determine MSI status, antibodies for the four MMR proteins (MLH1, PMS2, MSH2, and MSH6) are used, and additional analysis for MLH1 methylation or BRAF V600E mutation might be necessary depending on the expression of the MMR proteins [28]. MLH1, PMS2, MSH2, and MSH6 form heterodimers by pairing two proteins (MSH2/MSH6 and MLH1/PMS2), so that one defective protein shows loss of expression in one or two proteins [29]. The IHC results are interpreted as intact antibody when unequivocal nuclear staining in viable tumor cells appears in the presence of an internal positive control. Using PCR-amplified microsatellite loci with fluorescently labeled primers, the labeled PCR products can be analyzed by capillary electrophoresis to separate the amplicons by size. If there is allelic size variation in two or more microsatellite markers, it is considered MSIH; otherwise, it is categorized microsatellite-stable (MSS) [8].
Since the development of NGS, a larger number of microsatellites can be analyzed for MSI detection. Ideally, MSI in cancer can be detected with a limit of detection at 1% in an MSS background and will further improve MSI detection in cancer.
After the first study [30] describing an MSI detection approach using WES and whole-genome sequencing data on colorectal and endometrial cancers from The Cancer Genome Atlas (TCGA), several NGS-based computational methods have been developed. These methods were based on length differences of selected microsatellites obtained from the read count of all alleles. Using Kolmogorov-Smirnov statistics for TCGA MSI analyses, several MSI detection programs were developed, including MSIsensor [31], mSINGs [30], and MANTIS [32], which present higher overall specificity and sensitivity compared with prior methods [27]. To detect MSI in cancer, two critical parameters should be taken into consideration. First, given that microsatellite marker changes markedly differ between cancer types, selection of microsatellite markers should be carefully conducted to ensure high sensitivity and specificity for MSI detection. Second, the analytical method should be highly resolute to allow discrimination of MSI and mutant allele genotype recognition and should present the lowest possible limit of detection for employment in samples with low mutant allele frequency [27].
RNA sequencing data have demonstrated that MSIseq is the only method to detect MSI based on the proportion of insertions and deletions in mono- to hexa-nucleotide repeat microsatellites among all insertions and deletions found in RNA transcripts [33]. Since MSI has been discovered in many cancer types by NGS and is a major predictive biomarker to understand the responses to ICI therapy in solid tumors, it is critical to develop and use new sensitive tools for MSI diagnosis in clinical applications.
PROTEIN BIOMARKERS BY IMMUNOHISTOCHEMISTRY
IHC as an important biomarker assay
IHC studies the localization of proteins or antigens in tissue sections through antigen-antibody interactions using labeled antibodies as specific reagents. This method is widely used in diagnosis and biomarker discovery because of its easy accessibility, relatively lower cost compared with other methods, and high effectivity if the target (biomarker) is a protein. IHC plays a pivotal role in cancer care, providing information about the expression status of a protein target. However, over the past decade, IHC use as a platform for biomarkers has been challenged by development of more sensitive quantitative molecular assays, which provide reference standards but lack morphological context. For IHC to be considered a “top-tier” biomarker assay, it must provide quantitative data, digitization of images, and automatic image analysis [34]. Unlike manual interpretation of IHC, which is subjective, time consuming, and presents inherent interobserver and intra-observer variability, digital image analysis offers rapid and uniform interpretation [35]. Recently, a study on tumor classification and mutation prediction in non-small cell lung cancer using hematoxylin and eosin imaging and deep learning found that digital image analysis offered a significant benefit of providing important prognostic information based on initial diagnosis [36]. Automatic quantification of biomarkers such as tumor-infiltrating lymphocytes (TIL) and PD-L1 is one of the most studied topics in imageomics, digital image analysis.
Factors affecting IHC results
The use of biomarkers to guide therapy selection is gaining unprecedented support as a targeted therapy option to increase scope and complexity [37]. To be applicable for therapy in a clinical setting, several conditions must be met: adequate sampling, fast fixation with proper fixatives and proper fixation time, development of assays with positive and negative controls, accurate interpretation, and quality control and assurance. Standardized, commercially available IHC assays are preferred over in house assays to ensure reliability and reproducibility [38]. During interpretation, the test should be rejected when following factors are present: (1) preanalytical parameters, especially fixation, are not in accordance with validated procedures, (2) analytical parameters are not as expected due to artifacts, (3) unsatisfactory results in the controls, or (4) lack or very low percentage (< 10%) of tumor cells in the stained section. Consistent quality control and assurance will help ensure reliable and consistent results. All laboratories should comply with the best practice guidelines to improve the accuracy and reliability of the test. The advantages, shortcomings, and methods regarding IHC are described in Table 3.
PD-L1 as a biomarker
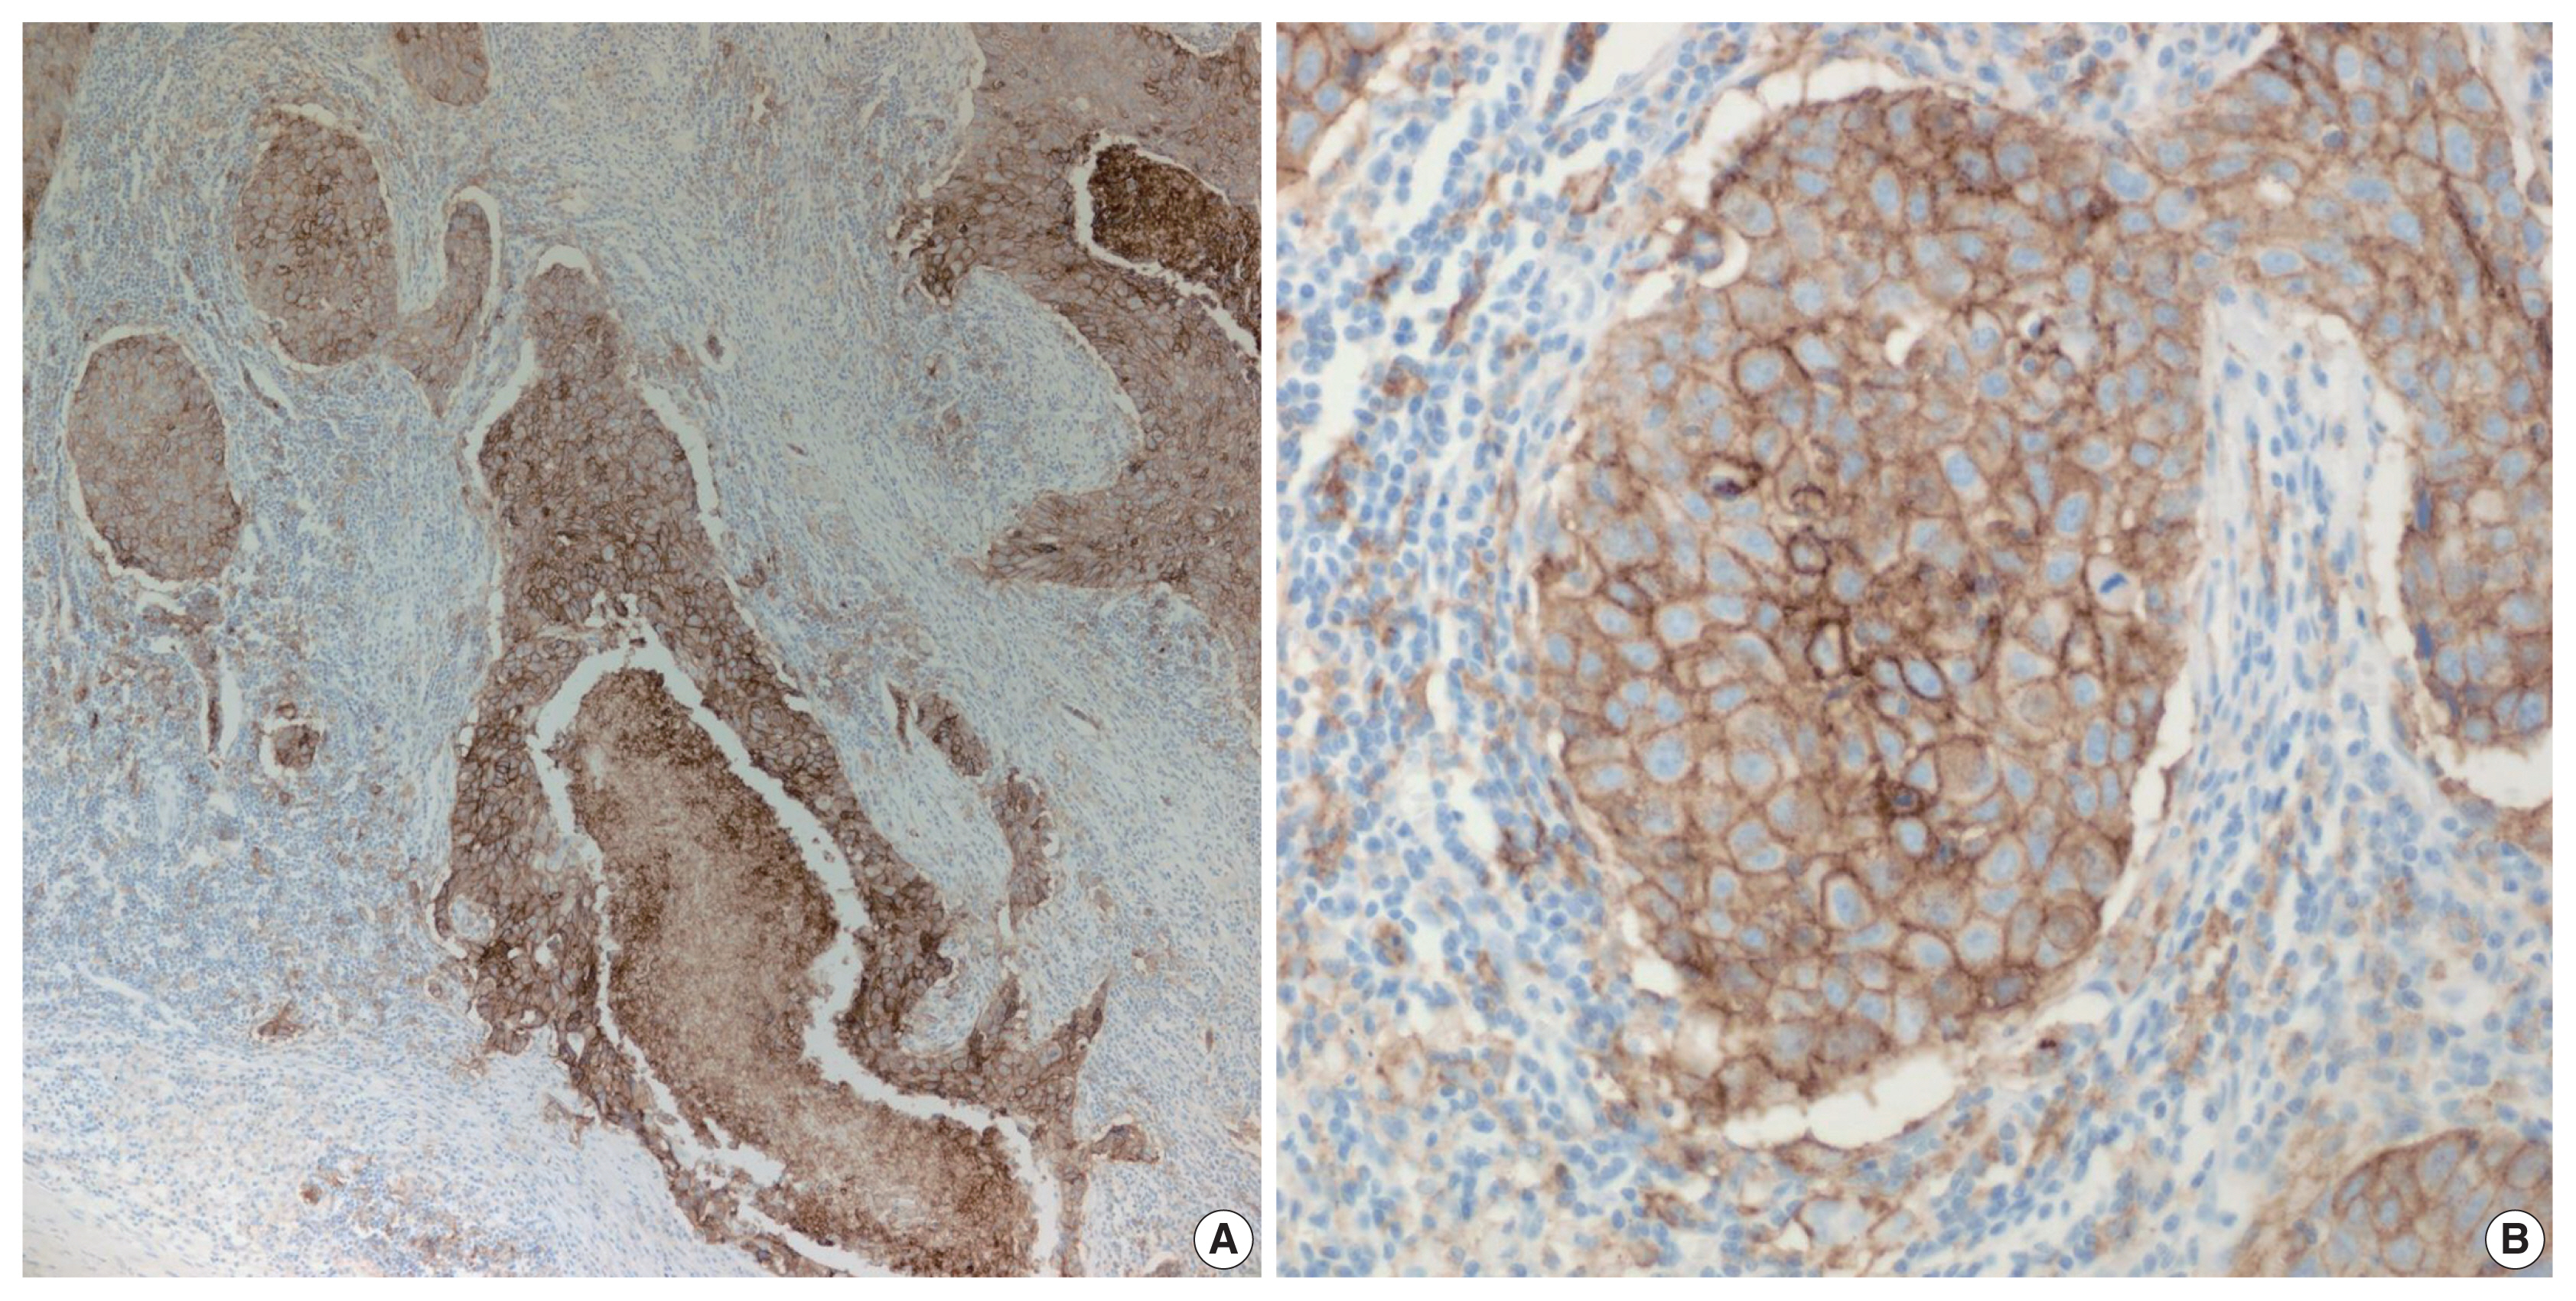
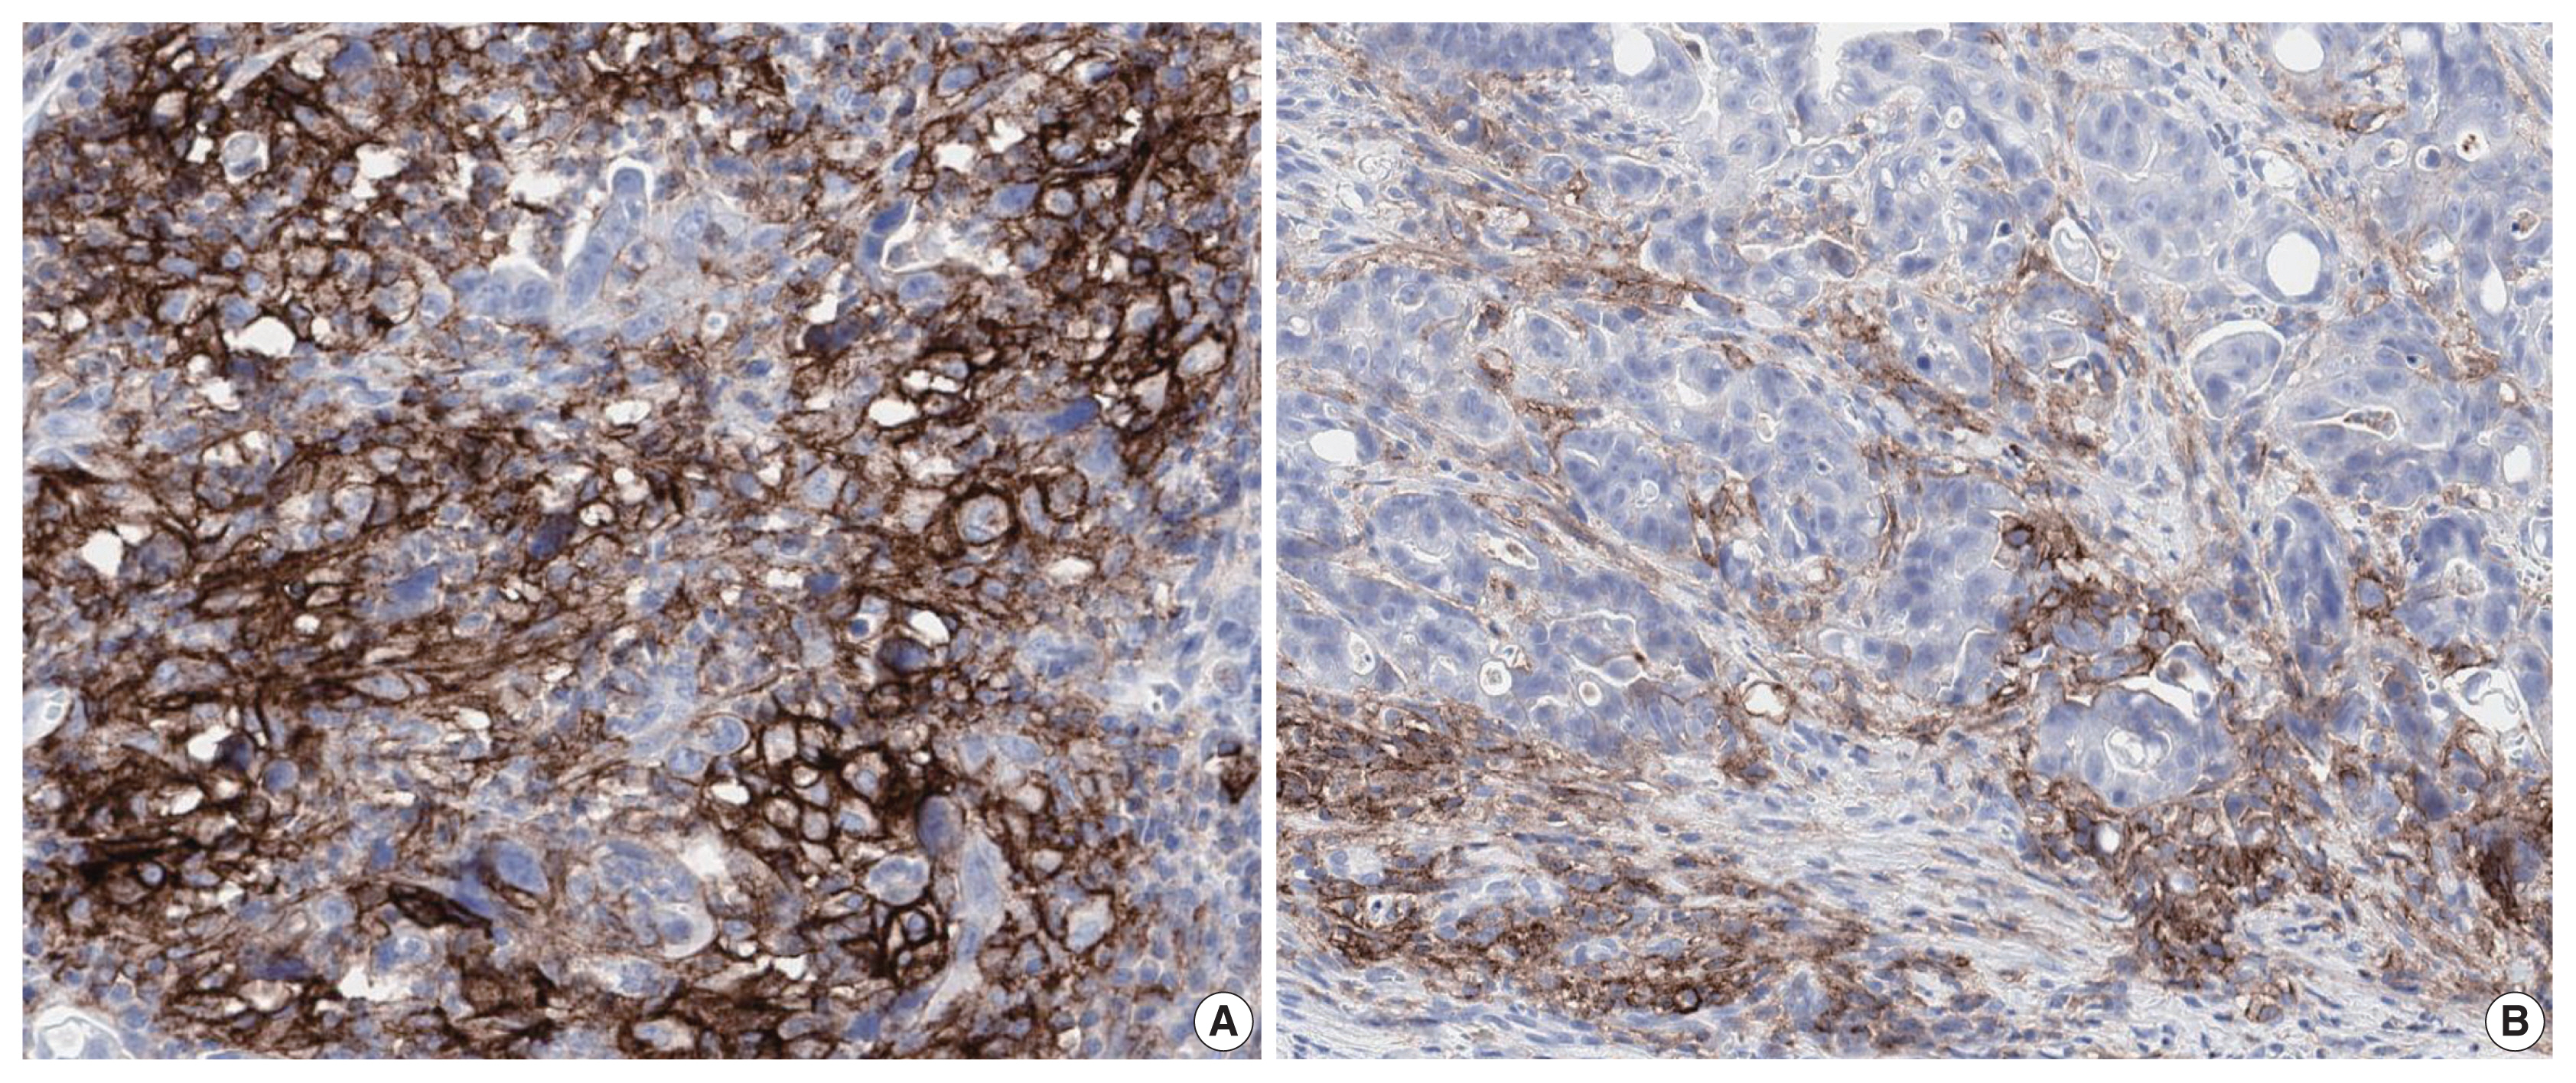
PD-L1 is a well-known and broadly used biomarkers for immunotherapy. Until now, it has been standard to perform IHC to evaluate PD-L1 expression. It is important for pathologists to pay attention to the reproducibility and accuracy in evaluating PD-L1 expression. Although the criteria differ depending on tumor type, both the tumor proportion score (TPS) and combined positive score (CPS) are widely used. For TPS, the representative cancer type is lung cancer (https://www.agilent.com/cs/library/usermanuals/public/29158_pd-l1-ihc-22C3-pharm-dx-nsclc-interpretation-manual.pdf). TPS is the percentage of viable tumor cells showing partial or complete membrane staining relative to all viable tumor cells (Fig. 1). For CPS, the representative tumors are urothelial carcinoma (https://www.agilent.com/cs/library/usermanuals/public/29276_22C3_pharmdx_uc_interpretation_manual_us.pdf) and gastric cancer (https://www.agilent.com/cs/library/usermanuals/public/29219_pd-l1-ihc-22C3-pharmdx-gastric-interpretation-manual_us.pdf). CPS is identified as the number of PD-L1–stained cells including tumor cells, lymphocytes, and macrophages divided by the total number of viable tumor cells, multiplied by 100. In gastric cancer, PD-L1–stained tumor cells and tumor-associated mononuclear inflammatory cells in gastric cancer exhibit distinct staining patterns (Fig. 2).

High programmed death-ligand 1 (≥ 50%) staining in partial or complete cell membrane (≥ 1+) in ≥ 50% of viable tumor cells in non-small cell lung cancers. (A) Lower magnification. (B) Higher magnification.

Programmed death-ligand 1 staining of tumor cells and tumor-associated mononuclear inflammatory cells in gastric cancer, exhibiting two distinct staining patterns: lattice (A) and interface (B).
PD-L1 is a cell surface protein encoded by the CD274 gene. Tumor cells up-regulate the expression of PD-L1 after exposure to interferon-γ and other cytokines [39]. Moreover, some immune cells in the tumor microenvironment (TME) such as antigen presenting cells, dendritic cells, macrophages, and T cells also show increased PD-L1 expression [40]. Evaluation using IHC has demonstrated that pre-treatment positive PD-L1 expression on tumor or immune cells may be used as a biomarker to predict favorable prognosis of ICI therapy in various cancer types [41]. Recently, there was an attempt to classify tumors into four types of TME based on PD-L1 expression status and TIL [42,43]: type I (PD-L1+/TIL+, adaptive immune resistance; 38%), type II (PD-L1−/TIL−, immune ignorance; 41%), type III (PD-L1+/TIL−, intrinsic induction of PD-L1; 1%), and type IV (PD-L1−/TIL+, tolerance; 20%) [44]. Patients with TME subtype I are the most likely to respond to programmed death-1/PD-L1 blockade, and the proportion of this TME type in various kinds of cancer can differ depending on genetic alterations, oncogene drivers of the cancer, and tissue type [42]. Since TME is heterogeneous between tumor types and between patients [45], in silico insights on TME are critical for successful immunotherapy [22]. Recently, it was shown that PD-L1 mRNA expression examined by RNA-seq [46] or Nanostring [47] correlates well with PD-L1 protein expression by IHC. Development of additional platforms will allow prediction of cancer progression and increase the length and quality of life of cancer patients.
In conclusion, despite the many obstacles, gene-targeted clinical trials may be very successful, and combined biomarkers will allow us to select optimal individual treatment strategies.
Notes
Ethics Statement
Not applicable.
Author Contributions
Writing—original draft: BK, SYK. Writing—review & editing: KMK. Approval of final manuscript: all authors.
Conflicts of Interest
The authors declare that they have no potential conflicts of interest.
Funding Statement
This work was supported by the Basic Science Research Program through the National Research Foundation of Korea (NRF) funded by the Ministry of Science and ICT (NRF-2017R1E1A1A01075005 and NRF-2017R1A2B 4012436) and by a grant from the Korea Health Technology R&D Project through the Korea Health Industry Development Institute (KHIDI) funded by the Ministry of Health & Welfare, Republic of Korea (HR20C0025).


