 E-submission
Articles
- Page Path
- HOME > J Pathol Transl Med > Volume 52(5); 2018 > Article
-
Original Article
An Immunohistochemical and Polarizing Microscopic Study of the Tumor Microenvironment in Varying Grades of Oral Squamous Cell Carcinoma -
Aeman Khalid
 , Safia Siddiqui1, Bharadwaj Bordoloi1, Nafis Faizi2, Fahad Samadi3, Noora Saeed
 -
Journal of Pathology and Translational Medicine 2018;52(5):314-322.
DOI: https://doi.org/10.4132/jptm.2018.07.17
Published online: July 27, 2018
1Department of Pathology, Jawahar Lal Nehru Medical College, Aligarh, India
2Department of Oral Pathology and Microbiology, Sardar Patel Post Graduate Institute of Dental & Medical Sciences, Lucknow, India
3Department of Community Medicine, Jawahar Lal Nehru Medical College, AMU, Aligarh, India
4Department of Oral Pathology and Microbiology, King George Medical University, Lucknow, India
- Corresponding Author Safia Siddiqui, MDS Department of Oral Pathology and Microbiology, Sardar Patel Post Graduate Institute of Dental & Medical Sciences, Lucknow 226025, UP, India Tel: +91-9838778650 Fax: +91-522-2440335 E-mail: safiasidd4@gmail.com
© 2018 The Korean Society of Pathologists/The Korean Society for Cytopathology
This is an Open Access article distributed under the terms of the Creative Commons Attribution Non-Commercial License (http://creativecommons.org/licenses/by-nc/4.0) which permits unrestricted non-commercial use, distribution, and reproduction in any medium, provided the original work is properly cited.
Abstract
-
Background
- Invasion of epithelial cells into the connective tissue brings about massive morphological and architectural changes in the underlying stroma. Myofibroblasts reorganize the stroma to facilitate the movement of tumor cells leading to metastasis. The aim of this study was to determine the number and pattern of distribution of myofibroblasts and the qualitative and quantitative change that they cause in the collagen present in the stroma in various grades of oral squamous cell carcinoma (OSCC).
-
Methods
- The study was divided into two groups with group I (test group, 65 cases) consisting of 29 cases of well-differentiated squamous cell carcinoma, 25 moderately differentiated SCC, and 11 poorly differentiated SCC, and group II (control group) consisting of 11 cases of normal mucosa. Sections from each sample were stained with anti–α-smooth muscle actin (α-SMA) antibodies, hematoxylin and eosin, and Picrosirius red. Several additional sections from each grade of OSCC were stained with Masson’s trichrome to observe the changes in collagen. For the statistical analysis, Fisher’s exact test, Tukey’s post hoc honest significant difference test, ANOVA, and the chi-square test were used, and p < .05 was considered statistically significant.
-
Results
- As the tumor stage progressed, an increase in the intensity α-SMA expression was seen, and the network pattern dominated in more dedifferentiated carcinomas. The collagen fibers became thin, loosely packed, and haphazardly aligned with progressing cancer. Additionally, the mean area fraction decreased, and the fibers attained a greenish yellow hue and a weak birefringence when observed using polarizing light microscopy.
-
Conclusions
- Myofibroblasts bring about numerous changes in collagen. As cancer progresses, there isincrease in pathological collagen,which enhances the movement of cells within the stroma.
- After obtaining permission from the Institutional Scientific and Ethical Committee (approval no. 811516/OP/EC), the present study was carried out on tissues archived in the department. Medical records, including informed consent and pathology reports, were reviewed and the patient’s age, sex, tumor location, tumor size, differentiation, invasion depth of tumor, lymph node metastasis, and clinical stage were recorded. Patients who had received preoperative chemotherapy and/or radiotherapy were excluded from the study.
- The study comprised 76 cases, which were divided into two groups. Group I consisted of 65 cases of histologically proven OSCC with 29 cases of well-differentiated squamous cell carcinoma (WDSCC), 25 of moderately differentiated SCC (MDSCC), and 11 of poorly differentiated SCC (PDSCC). Group II was the control and consisted of 11 cases of normal mucosa obtained following an operculectomy or frenectomy. Smooth muscle cells surrounding the blood vessels were used as a positive internal control for the α-SMA stained slides.
- Formalin-fixed, paraffin- embedded tissues were sectioned at 4 μm, and three sections from each sample were prepared. The first section was mounted on a poly-L-lysine coated slide and stained with antibodies against α-SMA. The second section was stained with hematoxylin and eosin, observed under a light microscope, and graded according to the Broder classification. The third section was stained with PSR and observed under a polarizing light microscope. Several additional sections from each grade of OSCC were obtained and stained with Masson’s Trichrome to observe the morphological changes in collagen.
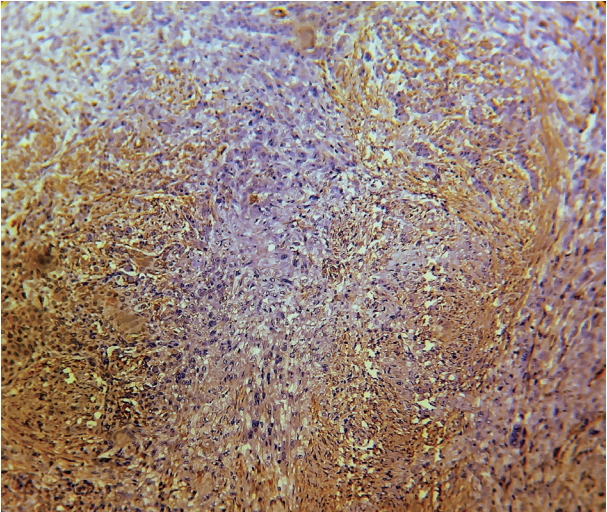
- For immunohistochemistry (IHC), the sections were first deparaffinized, hydrated and washed in distilled water for 5 minutes. Antigen retrieval was then performed by immersing the slides in pre-warmed 1 M citrate buffer (pH 6.0) and heating in a microwave oven at 95–98ºC for 20 minutes. Blocking of the endogenous peroxidase was performed by immersing the slides in a mixture of 50 mL of methanol with 1.5 mL of hydrogen peroxide for 30 minutes in a humidified chamber followed by washing in distilled water for 5 minutes. The slides were then cooled to room temperature and washed in 1 M Tris buffer (pH 7.2). Primary mouse anti-human α-SMA monoclonal antibody clone1 A4 (Thermo Scientific, Waltham, MA, USA) at a dilution of 1:50–100 was added to the sections, and the slides were incubated for 30 minutes at room temperature. The slides were then washed in 1 M Tris buffer (pH 7.2), and “horse radish peroxidaseconjugated goat anti-mouse secondary antibody” was added to the sections and incubated for 30 minutes. The slides were washed again in 1 M Tris buffer (pH 7.2) followed by the addition of diaminobenzidine (DAB) chromogen in DAB buffer (Thermo Scientific). The slides were incubated for 3 minutes then counterstained with hematoxylin.11 The anti–α-SMA antibody-labelled cells were identified by the strong, dark brown cytoplasmic staining of the myofibroblasts. The samples were then assessed for the intensity and pattern of myofibroblastic proliferation.
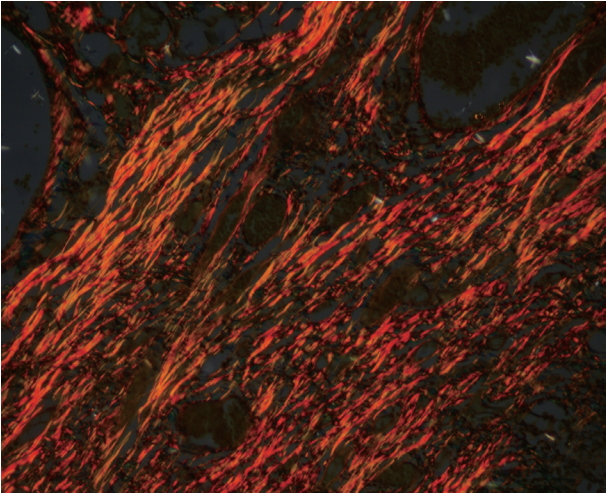
- For PSR staining, paraffin-embedded tissue sections were dehydrated and de-waxed then stained with Weigert’s hematoxylin for 8 minutes. The slides were then washed for 10 minutes under running tap water and stained with PSR stain for 1 hour followed by washing in 2 changes of acidified water. The sections were dehydrated in three changes of 100% alcohol and cleared by dipping in xylene followed by mounting using DPX mounting media and a cover slip. Using light microscopy, the nuclei appear black and collagen appears red. Using polarizing microscopy, collagen fibers produce orange red (OR), yellowish orange (YO), or green/greenish yellow (G/GY) birefringence [11].
- Intensity and pattern of α-SMA expression
- The percentage of cells positive for α-SMA in the tumor stroma were classified into the following categories [12]: absent/0, no positive cells; mild/1+, 1%–33% positive cells; moderate/2 +, 34%–66% positive cells; and intense/3 +, 67%–100% positive cells.
- The distribution and arrangement of positively stained myofibroblast cells were classified into three groups: focal, spindle, and network [13]. Focal indicates no specific arrangement of the myofibroblasts. In the spindle groups, myofibroblasts were arranged in one to three rows in a regular order in the periphery of the neoplastic islands or in the connective tissues with distinctive cell margins around the myofibroblasts and malignant tissue. A “network” classification includes myofibroblasts with vesicular nuclei and abundant cytoplasm arranged in multiple rows with an interwoven network of cytoplasmic extensions forming a network in the stroma of the connective tissue.
- Collagen evaluation
- The parameters used for the evaluation of the collagen were thickness, arrangement and orientation, packing, mean area fraction, and hue and birefringence exhibited by the fibers.
- For measuring fiber thickness, images of PSR-stained slides were obtained at 400 × magnification and processed using image analysis software (Image J, ver. 1.46 r, NIH, Bethesda, MD, USA). In samples from normal tissues, collagen fibers from the lamina propria were studied, and in OSCC samples, collagen fibers around tumor islands were used. For each section, two separate high-power fields with at least 50 fibers of each size (25 each of thick and thin fibers) were examined [14]. Collagen fibers with a thickness of 2–10 μm were considered thick, type I fibers and fibers 0.5–1.5 μm in diameter were considered thin, type III fibres [15].
- The arrangement and orientation of collagen fibers were categorized as either parallel or haphazard based on their appearance in relation to the tumor islands. The evaluation was performed in five selected fields at 100 × magnification [7].
- The packing of the collagen fibers was categorized as either dense or loose based on their appearance in 5 selected fields at 100 × magnification in the immediate vicinity of the tumor islands [7].
- For measuring the mean area fraction, images of the sections at 400 × magnification were evaluated using the image analysis software. The percentage of the area occupied by collagen fibers in a given field was calculated for each grade of OSCC and also for normal mucosa [7].
- For determining hue and birefringence, five random highpower fields for each slide of the connective tissue stroma at 400 × magnification were evaluated. In samples from normal tissues, collagen fibers from the lamina propria were studied, and in OSCC samples, collagen fibers around tumor islands were used. The predominant hue exhibited by the collagen fibers was classified as either OR, YO, or G/GY, and the birefringence was classified as either strong or weak [6,7,16-18].
- Categorical variables, such as α-SMA expression, pattern, collagen fiber orientation and packing, andhue and birefringence,are expressed as a percentage, and continuous variables, such as collagen fiber thickness and mean area fraction, areexpressed as the mean and standard deviation. For the categorical variable, the chi-square testwas used to test the significance of the association. When more than 20% of the individual cells had an expected value of less than five Fisher exact test was used. For the continuous variables, the mean and SD of the subgroups were tested for significance using Analysis of Variance (ANOVA). Since ANOVA does not comment on significant differences in subgroups, Tukey’s post hoc honest significance difference testing was used for further analysis if the ANOVA results were significant. For the collagen fiber thickness and mean area fraction, all four statistical tests were used. For all tests, p < .05 was considered statistically significant.
MATERIALS AND METHODS
Intensity score for α-SMA
Pattern of α-SMA expression
- Expression of α-SMA was not observed in the stroma of normal oral mucosa except for the blood vessels. The α-SMA expression in OSCC samples is shown in Table 1 and Figs. 1, 2, and 3. Among the different degrees of differentiation, a statistically significant increase in the intensity of α-SMA expression was found in MDSCC compared to WDSCC and in PDSCC compared to MDSCC (p < .001). A variation in the pattern of α-SMA expression was noted among the malignant lesions, which included focal, spindle, and network patterns of stromal myofibroblast positivity as shown in Table 2. Statistically significant differences were found in the expression pattern among the malignant lesions (p < .001). The network pattern was significantly dominant in carcinomas with less differentiation.
- The mean, SD, and range of fiber thickness (measured in μm) of different grades of OSCC are presented in Table 3. In WDSCC and normal mucosa, the collagen fibers appeared predominantly as bundles of thick fibers. The thickness gradually decreased as the carcinomas progressed from well to poorly differentiated. Statistically significant differences were seen between WDSCC and MDSCC (p < .001), WDSCC and PDSCC (p < .001), MDSCC and normal cells (p = .041), and PDSCC and normal cells (p = .002). The collagen fibers predominantly exhibited a parallel orientation in WDSCC, which gradually changed to a haphazard pattern with the progression towards poorly differentiated carcinoma as shown in Figs. 4, 5, and 6. These changes were statistically significant (p = .002) as shown in Table 4. The collagen fibers were densely packed around the tumor islands in most cases of WDSCC but loosely packed in most of the cases of MDSCC and in all cases of PDSCC. These differences were statistically significant (p = .001) as shown in Table 5. The mean area fraction occupied by the collagen fibers gradually decreased as the OSCC progressed from well to poorly differentiated. Statistically significant differences were seen between the groups as shown in Table 6.
- In a majority of the samples of normal mucosa and WDSCC, the collagen fibers predominantly exhibited an OR hue with strong birefringence as seen in Fig. 7. In most of the cases of MDSCC, the fibers predominantly exhibited a YO hue with strong birefringence as seen in Fig. 8, and in a majority of the PDSCC cases, the fibers predominantly exhibited a GY hue with weak birefringence as seen in Fig. 9. These groupings were highly significant (p < .001) as shown in Tables 7 and 8.
RESULTS
- In our study, OSCC was more common in males aged 40–59 years, and the most common site for oral cavity lesions was the floor of the mouth. In previous studies, oral cancer was also most common in middle-aged and older individuals [19,20]. Increased exposure to risk factors, such as smoking and tobacco or betel chewing, in males makes them more prone to develop oral cancer [21,22]. Due to the habitual placement of tobacco or a betel quid on the floor of the mouth, this site appears to be at increased risk of developing carcinoma.
- In our study, we found a significant increase in the number of myofibroblasts in OSCC compared to normal tissue, and more myofibroblasts were seen in more dedifferentiated carcinomas. Previous studies have demonstrated that factors derived from aggressive tumor cells are able to diffuse through the basement membrane and stimulate myofibroblast transformation [23,24]. OSCC-derived tumor growth factor β1 promotes fibroblast–myofibroblast trans-differentiation. and factors released from these myofibroblasts induce tumor cellular proliferation [25-27]. Additionally, hyaluronan is implicated in myofibroblast formation and maintenance. Reduced turnover of hyaluronan has been linked to differentiation of myofibroblasts, and there is a reciprocal relationship between the amount of hyaluronan in the matrix and the ability of myofibroblasts to deposit fibrillar matrix components [28].
- We found large variations in the pattern of α-SMA expression among the malignant lesions ranging from focal to spindle to network patterns of stromal myofibroblast positivity. In general, the network pattern of α-SMA was seen more often in more dedifferentiated carcinomas. It is likely that neoplastic lesions show more severe invasive behavior and a poorer prognosis because of the higher number of network-arranged myofibroblasts [13,25]. In a similar study, IHC was used to detect α-SMA–positive myofibroblasts in gastric cancer stromata and in non-neoplastic mucosa. Because more myofibroblasts were seen in gastric cancer than in the non-neoplastic mucosa, it was concluded that an increased number of collagen-producing myofibroblasts may be a crucial cause of increased collagen deposition in gastric cancer [29].
- In our study, the collagen fibers predominantly appeared as bundles of thick fibers in WDSCC. Previous studies have shown thata collagen-rich microenvironment can promote invasion and metastasis [30]. Similar to previous findings, the thickness of the collagen fibers decreased with progressing OSCC [6,31]. As cancer progresses, changes in the thickness of collagen fibers occurs with a decrease in the existing type I collagen and a simultaneous increase in type III collagen due to enzymatic degradation brought about by myofibroblasts [7,32]. Matrix metalloproteinases (MMPs) and lysosomal enzymes, particularly acidic cathepsin, are important proteolytic enzymes responsible for connective tissue dissolution [6,33]. Hyaluronan synthase 2 is one of the key regulators responsible for myofibroblast-mediated OSCC progression and acts by modulating the balance of MMP1 and tissue inhibitor of metalloproteinases (TIMP1) [34].
- Several changes occurred in the arrangement of the collagen fibers with the progression of OSCC. First, the orientation of collagen fibers changed from parallel to haphazard as seen in other studies [7,18,35]. Several studies have reported that collagen fibers are realigned with respect to the tumor border to promote cell invasion by enabling cells to migrate along the collagen fibres [36-40]. The packing of the fibers also changed from dense to loose as the carcinoma progressed, which was similar to a previous study [7]. The dense arrangement of collagen fibers is due to increased synthesis and increased cross-linking of fibrillar collagen by myofibroblasts [29]. With the progression of cancer, there is increased degradation of the stroma making it loosely packed [6,33]. Finally, the mean area fraction occupied by collagen fibers decreased gradually with progression from WDSCC to PDSCC as in previous studies [41,42]. This could be attributed to MMP-1, which causes degradation of type I collagen leading to a decrease in the mean area fraction [42].
- Differences in interference colors and birefringence intensity can be due to distinct patterns of physical aggregation, the degree of polymerization, and the three-dimensional organization of collagen fibres [15,43]. The strong birefringence and OR hue of the control and WDSCC samples appear to be related to the higher amount of thick type I collagen fibers. The weak birefringence and greenish-yellow hue of the PDSCC samples could be either be due to an increased number of thin fibers (i.e., type III collagen fibers that were identified as reticulin fibers) or the result of abnormal or pathological collagen formed by the tumor cells or stroma. Regardless of the cause, our results were in accordance with those of other studies [3,6,7,16,17,31].
- It was recently reported that pharmacological inhibition of NOX4 slows tumor growth in vivo by targeting myofibroblasts [44]. Lysyl oxidase-like 2 (LOXL2) antibodies disrupt the orientation and width of collagen fibers, ultimately resulting in decreased tumor growth [45]. Our data revealed that collagen fibers were quantitatively and qualitatively reorganized in the stroma of OSCC. We believe that the increase in activated fibroblasts (i.e., myofibroblasts) was a crucial contributor to collagen reorganization. Initially, there is an attempt to restrict the movement of tumor cells, but as the cancer progresses, there is an increase in pathological collagen, which enhances movement of the cells within the stroma. Therefore, targeting myofibroblasts and collagen cross-linking enzymes may be a promising treatment for oral cancer.
DISCUSSION


| Type of lesion | No. of cases |
α-SMA intensity score (%) |
|||
|---|---|---|---|---|---|
| 0 | 1+ (mild) | 2+ (moderate) | 3+ (intense) | ||
| WDSCC | 29 | 4 (13.8) | 17 (58.6) | 8 (27.6) | 0 |
| MDSCC | 25 | 0 | 7 (28) | 13 (52) | 5 (20) |
| PDSCC | 11 | 0 | 0 | 3 (27.3) | 8 (72.7) |
| Type of lesion | No. of cases | Negative staining | Focal pattern | Spindle pattern | Network pattern |
|---|---|---|---|---|---|
| WDSCC | 29 | 4 (13.8) | 19 (65.5) | 6 (20.7) | 0 |
| MDSCC | 25 | 0 | 3 (12) | 8 (32) | 14 (56) |
| PDSCC | 11 | 0 | 0 | 2 (18.2) | 9 (81.8) |
| Group | No. | Mean ± SD | Minimum–Maximum |
|---|---|---|---|
| WDSCC | 29 | 2.9 ± 1.1 | 1.0–5.3 |
| MDSCC | 25 | 1.9 ± 0.5 | 1.0–3.4 |
| PDSCC | 11 | 1.3 ± 0.4 | 1.0–2.2 |
| Normal mucosa | 11 | 2.7 ± 1.0 | 1.1–4.2 |
ANOVA test results: F(3,72) = 13.423, p < .001. Significant at p < .01.
Post-hoc Tukey’s honest significant difference testing reveals significant differences between WDSCC and MDSCC (p < .001); WDSCC and PDSCC (p < .001); MDSCC and normal (p = .041); and; PDSCC and normal (p = .002).
SD, standard deviation; WDSCC, well differentiated squamous cell carcinoma; MDSCC, moderately differentiated squamous cell carcinoma; PDSCC, poorly differentiated squamous cell carcinoma.
| Group |
Fibre orientation |
Total | |
|---|---|---|---|
| Haphazard | Parallel | ||
| WDSCC | 13 (44.8) | 16 (55.2) | 29 (100) |
| MDSCC | 19 (76) | 6 (24) | 25 (100) |
| PDSCC | 11 (100) | 0 (0) | 11 (100) |
| Total | 43 (66.2) | 22 (33.82) | 65 (100) |
| Group |
Fibre arrangement |
Total | |
|---|---|---|---|
| Dense | Loose | ||
| WDSCC | 19 (65.5) | 10 (34.5) | 29 (100) |
| MDSCC | 10 (40) | 15 (58.8) | 25 (100) |
| PDSCC | 0 | 11 (100) | 11 (100) |
| Total | 29 (44.6) | 36 (55.4) | 65 (100) |
| Group | No. | Mean ± SD (%) | Minimum–Maximum |
|---|---|---|---|
| WDSCC | 29 | 25.1 ± 5.5 | 17.7–37.0 |
| MDSCC | 25 | 18.9 ± 3.7 | 11.5–24.1 |
| PDSCC | 11 | 10.6 ± 3.0 | 7.0–16.3 |
| Normal mucosa | 11 | 31.5 ± 3.5 | 27.4–36.2 |
ANOVA test results. F(3,72) = 51.2, p < .001. Significant at p < .05.
Post-hoc Tukey’s honest significant difference (HSD) testing reveals significant differences between all of the groups with each other (p < .001).
SD, standard deviation; WDSCC, well differentiated squamous cell carcinoma; MDSCC, moderately differentiated squamous cell carcinoma; PDSCC, poorly differentiated squamous cell carcinoma.
Values are presented as number (%).
Fisher’s exact test, p < .001. Significant at p <. 01.
OR, orange red; YO, yellowish orange; GY, greenish yellow; WDSCC, well differentiated squamous cell carcinoma; MDSCC, moderately differentiated squamous cell carcinoma; PDSCC, poorly differentiated squamous cell carcinoma.
- 1. Khandekar SP, Bagdey PS, Tiwari RR. Oral cancer and some epidemiological factors: a hospital based study. Indian J Commun Med 2006; 31: 157-9.
- 2. Coelho KR. Challenges of the oral cancer burden in India. J Cancer Epidemiol 2012; 2012: 701932.ArticlePubMedPMCPDF
- 3. Aparna V, Charu S. Evaluation of collagen in different grades of oral squamous cell carcinoma by using the picrosirius red stain: a histochemical study. J Clin Diagn Res 2010; 4: 3444-9.
- 4. Shrestha P, Sakamoto F, Takagi H, Yamada T, Mori M. Enhanced tenascin immunoreactivity in leukoplakia and squamous cell carcinoma of the oral cavity: an immunohistochemical study. Eur J Cancer B Oral Oncol 1994; 30B: 132-7. ArticlePubMed
- 5. van den Hooff A. Stromal involvement in malignant growth. Adv Cancer Res 1988; 50: 159-96. PubMed
- 6. Arun Gopinathan P, Kokila G, Jyothi M, Ananjan C, Pradeep L, Humaira Nazir S. Study of collagen birefringence in different grades of oral squamous cell carcinoma using picrosirius red and polarized light microscopy. Scientifica (Cairo) 2015; 2015: 802980.PubMedPMCPDF
- 7. Kardam P, Mehendiratta M, Rehani S, Kumra M, Sahay K, Jain K. Stromal fibers in oral squamous cell carcinoma: a possible new prognostic indicator? J Oral Maxillofac Pathol 2016; 20: 405-12. ArticlePubMedPMC
- 8. Nakayama H, Enzan H, Miyazaki E, Naruse K, Kiyoku H, Hiroi M. The role of myofibroblasts at the tumor border of invasive colorectal adenocarcinomas. Jpn J Clin Oncol 1998; 28: 615-20. ArticlePubMed
- 9. Powell DW, Mifflin RC, Valentich JD, Crowe SE, Saada JI, West AB. Myofibroblasts. I. Paracrine cells important in health and disease. Am J Physiol 1999; 277: C1-9. ArticlePubMed
- 10. Rich L, Whittaker P. Collagen and picrosirius red staining: a polarized light assessment of fibrillar hue and spatial distribution. Braz J Morphol Sci 2005; 22: 97-104.
- 11. Bancroft JD, Gamble M. Theory and practice of histological techniques. 6th ed. London: Churchill Livingstone, 2008.
- 12. Tuxhorn JA, Ayala GE, Rowley DR. Reactive stroma in prostate cancer progression. J Urol 2001; 166: 2472-83. ArticlePubMed
- 13. Vered M, Allon I, Buchner A, Dayan D. Stromal myofibroblasts accompany modifications in the epithelial phenotype of tongue dysplastic and malignant lesions. Cancer Microenviron 2009; 2: 49-57. ArticlePubMedPMCPDF
- 14. Singh HP, Shetty DC, Wadhwan V, Aggarwal P. A quantitative and qualitative comparative analysis of collagen fibers to determine the role of connective tissue stroma on biological behavior of odontogenic cysts: a histochemical study. Natl J Maxillofac Surg 2012; 3: 15-20. ArticlePubMedPMC
- 15. Montes GS, Junqueira LC. The use of the Picrosirius-polarization method for the study of the biopathology of collagen. Mem Inst Oswaldo Cruz 1991; 86 Suppl 3: 1-11. ArticlePDF
- 16. Kalele KK, Managoli NA, Roopa NM, Kulkarni M, Bagul N, Kheur S. Assessment of collagen fibre nature, spatial distribution, hue and its correlation with invasion and metastasis in oral squamous cell carcinoma and surgical margins using picrosirius red and polarized microscope. J Dent Res Rev 2014; 1: 14-7.
- 17. Alrani D, Niranjan KC, Acharya S, Hallikeri K. Histochemical analysis of collagen reorganization at the tumor-stromal interface in oral squamous cell carcinoma: a polarizing microscopic study. Austin J Dent 2016; 3: 1-7.
- 18. Martins GB, Reis SR, Silva TM. Collagen type I expression in squamous cell carcinoma of the oral cavity. Pesqui Odontol Bras 2003; 17: 82-8. ArticlePubMedPDF
- 19. Schantz SP, Yu GP. Head and neck cancer incidence trends in young Americans, 1973-1997, with a special analysis for tongue cancer. Arch Otolaryngol Head Neck Surg 2002; 128: 268-74. ArticlePubMed
- 20. Llewellyn CD, Johnson NW, Warnakulasuriya KA. Risk factors for squamous cell carcinoma of the oral cavity in young people: a comprehensive literature review. Oral Oncol 2001; 37: 401-18. ArticlePubMed
- 21. Warnakulasuriya S. Living with oral cancer: epidemiology with particular reference to prevalence and life-style changes that influence survival. Oral Oncol 2010; 46: 407-10. ArticlePubMed
- 22. Silverman S Jr, Gorsky M, Lozada F. Oral leukoplakia and malignant transformation: a follow-up study of 257 patients. Cancer 1984; 53: 563-8. ArticlePubMed
- 23. Shimasaki N, Kuroda N, Miyazaki E, et al. The distribution pattern of myofibroblasts in the stroma of human bladder carcinoma depends on their invasiveness. Histol Histopathol 2006; 21: 349-53. PubMed
- 24. Chauhan H, Abraham A, Phillips JR, Pringle JH, Walker RA, Jones JL. There is more than one kind of myofibroblast: analysis of CD34 expression in benign, in situ, and invasive breast lesions. J Clin Pathol 2003; 56: 271-6. ArticlePubMedPMC
- 25. Seifi S, Shafaei S, Shafigh E, Sahabi SM, Ghasemi H. Myofibroblast stromal presence and distribution in squamous epithelial carcinomas, oral dysplasia and hyperkeratosis. Asian Pac J Cancer Prev 2010; 11: 359-64. PubMed
- 26. Kellermann MG, Sobral LM, da Silva SD, et al. Mutual paracrine effects of oral squamous cell carcinoma cells and normal oral fibroblasts: induction of fibroblast to myofibroblast transdifferentiation and modulation of tumor cell proliferation. Oral Oncol 2008; 44: 509-17. ArticlePubMed
- 27. Marsh D, Suchak K, Moutasim KA, et al. Stromal features are predictive of disease mortality in oral cancer patients. J Pathol 2011; 223: 470-81. ArticlePubMedPDF
- 28. Evanko SP, Potter-Perigo S, Petty LJ, Workman GA, Wight TN. Hyaluronan controls the deposition of fibronectin and collagen and modulates TGF-beta1 induction of lung myofibroblasts. Matrix Biol 2015; 42: 74-92. PubMed
- 29. Zhou ZH, Ji CD, Xiao HL, Zhao HB, Cui YH, Bian XW. Reorganized collagen in the tumor microenvironment of gastric cancer and its association with prognosis. J Cancer 2017; 8: 1466-76. ArticlePubMedPMC
- 30. Provenzano PP, Inman DR, Eliceiri KW, et al. Collagen density promotes mammary tumor initiation and progression. BMC Med 2008; 6: 11.ArticlePubMedPMCPDF
- 31. John RE, Murthy S. Morphological analysis of collagen and elastic fibers in oral squamous cell carcinoma using special stains and comparison with Broder's and Bryne's grading systems. Indian J Dent Res 2016; 27: 242-8. ArticlePubMed
- 32. Yokoyama M. Alterations in stromal reaction during tumour progression in oral mucosa. J Hard Tissue Biol 2011; 20: 23-30.
- 33. Davies KJ. The Complex interaction of matrix metalloproteinases in the migration of cancer cells through breast tissue stroma. Int J Breast Cancer 2014; 2014: 839094.ArticlePubMedPMCPDF
- 34. Zhang Z, Tao D, Zhang P, et al. Hyaluronan synthase 2 expressed by cancer-associated fibroblasts promotes oral cancer invasion. J Exp Clin Cancer Res 2016; 35: 181.ArticlePubMedPMCPDF
- 35. Manjunatha BS, Agrawal A, Shah V. Histopathological evaluation of collagen fibres using picrosirius red stain and polarizing microscopy in oral squamous cell carcinoma. J Can Res Ther 2015; 11: 272-6. Article
- 36. Fang M, Yuan J, Peng C, Li Y. Collagen as a double-edged sword in tumor progression. Tumour Biol 2014; 35: 2871-82. ArticlePubMedPDF
- 37. Conklin MW, Eickhoff JC, Riching KM, et al. Aligned collagen is a prognostic signature for survival in human breast carcinoma. Am J Pathol 2011; 178: 1221-32. ArticlePubMedPMC
- 38. Levental KR, Yu H, Kass L, et al. Matrix crosslinking forces tumor progression by enhancing integrin signaling. Cell 2009; 139: 891-906. ArticlePubMedPMC
- 39. Provenzano PP, Eliceiri KW, Campbell JM, Inman DR, White JG, Keely PJ. Collagen reorganization at the tumor-stromal interface facilitates local invasion. BMC Med 2006; 4: 38.ArticlePubMedPMCPDF
- 40. Paszek MJ, Zahir N, Johnson KR, et al. Tensional homeostasis and the malignant phenotype. Cancer Cell 2005; 8: 241-54. ArticlePubMed
- 41. George J, Narang RS, Rao NN. Stromal response in different histological grades of oral squamous cell carcinoma: a histochemical study. Indian J Dent Res 2012; 23: 842.ArticlePubMed
- 42. Ziober BL, Turner MA, Palefsky JM, Banda MJ, Kramer RH. Type I collagen degradation by invasive oral squamous cell carcinoma. Oral Oncol 2000; 36: 365-72. ArticlePubMed
- 43. Dayan D, Hiss Y, Hirshberg A, Bubis JJ, Wolman M. Are the polarization colors of picrosirius red-stained collagen determined only by the diameter of the fibers? Histochemistry 1989; 93: 27-9. ArticlePubMedPDF
- 44. Hanley CJ, Mellone M, Ford K, et al. Targeting the myofibroblastic cancer-associated fibroblast phenotype through inhibition of NOX4. J Natl Cancer Inst 2018; 110: 109-20. ArticlePubMedPDF
- 45. Grossman M, Ben-Chetrit N, Zhuravlev A, et al. Tumor cell invasion can be blocked by modulators of collagen fibril alignment that control assembly of the extracellular matrix. Cancer Res 2016; 76: 4249-58. ArticlePubMedPDF
REFERENCES
Figure & Data
References
Citations
- Assessment of collagen birefringence in different grades of oral squamous cell carcinoma using Picrosirius red – polarizing microscopy and comparison with Picrosirius red – Fast green stain
Deba Kumar Das, Jiji George, Ankita Singh, Puneet Ahuja
Journal of Oral and Maxillofacial Pathology.2026; 30(1): 160. CrossRef - Inflammation and Stromal Alterations–Histopathological Assessment of Invasive Changes in Oral Squamous Cell Carcinoma
Surbhi, Anju Devi, Anjali Narwal, Mala Kamboj
Journal of Maxillofacial and Oral Surgery.2026;[Epub] CrossRef - Multifractal Alterations in Oral Sub-Epithelial Connective Tissue During Progression of Pre-Cancer and Cancer
Debaleena Nawn, Sawon Pratiher, Subhankar Chattoraj, Debjani Chakraborty, Mousumi Pal, Ranjan Rashmi Paul, Srimonti Dutta, Jyotirmoy Chatterjee
IEEE Journal of Biomedical and Health Informatics.2021; 25(1): 152. CrossRef
 PubReader
 ePub Link
-
 Cite this Article
- Cite this Article
-
- Close
- Download Citation
- Close
- Figure
-
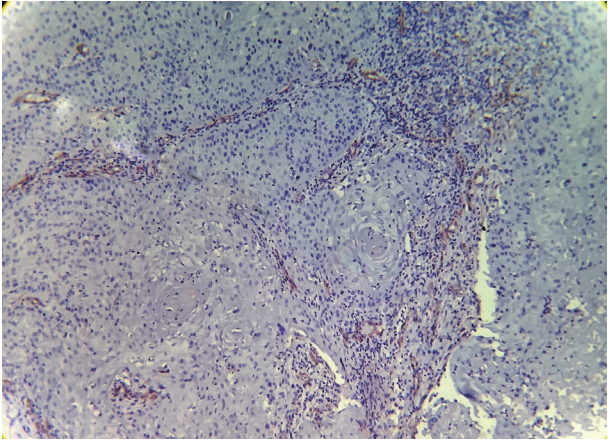
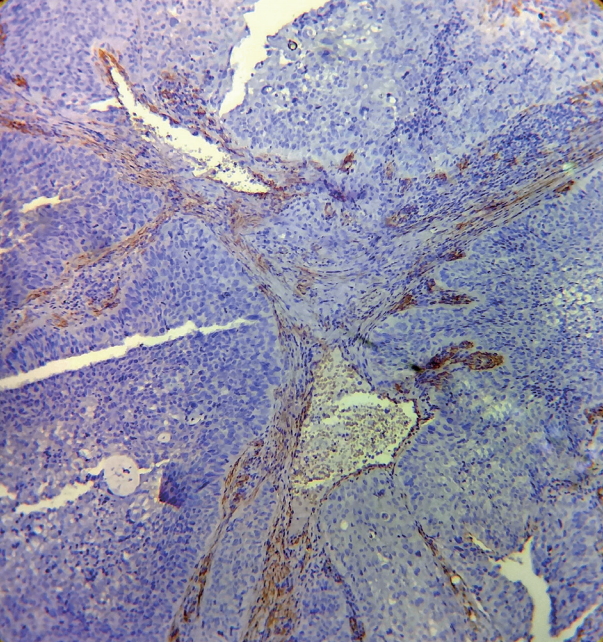

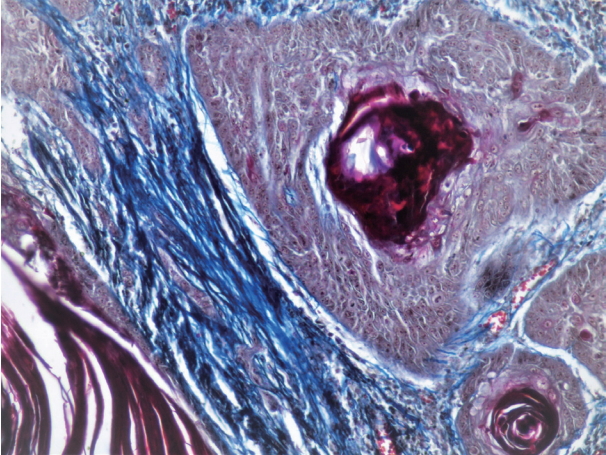
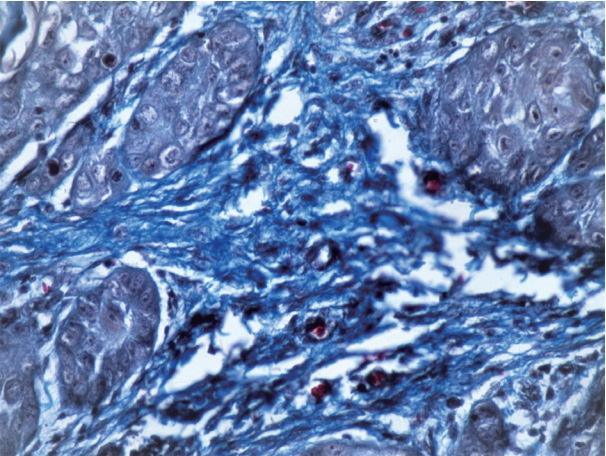
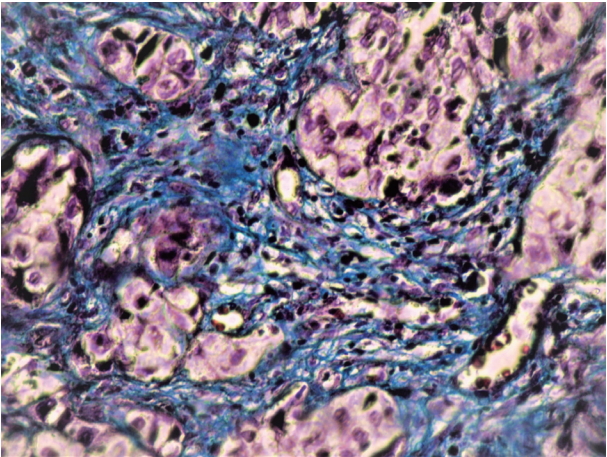

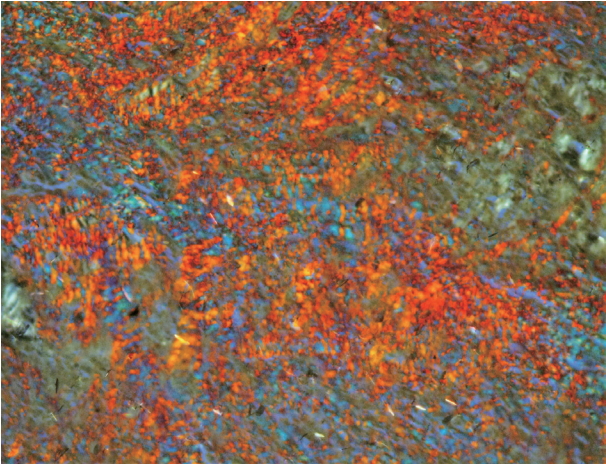
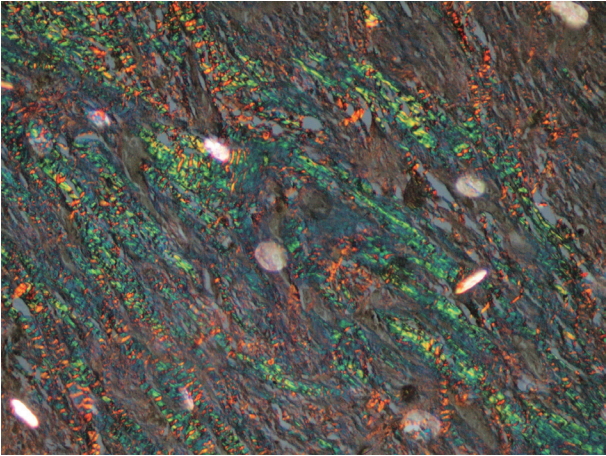


Fig. 1.
Fig. 2.
Fig. 3.
Fig. 4.
Fig. 5.
Fig. 6.
Fig. 7.
Fig. 8.
Fig. 9.
| Type of lesion | No. of cases | α-SMA intensity score (%) |
|||
|---|---|---|---|---|---|
| 0 | 1+ (mild) | 2+ (moderate) | 3+ (intense) | ||
| WDSCC | 29 | 4 (13.8) | 17 (58.6) | 8 (27.6) | 0 |
| MDSCC | 25 | 0 | 7 (28) | 13 (52) | 5 (20) |
| PDSCC | 11 | 0 | 0 | 3 (27.3) | 8 (72.7) |
| Type of lesion | No. of cases | Negative staining | Focal pattern | Spindle pattern | Network pattern |
|---|---|---|---|---|---|
| WDSCC | 29 | 4 (13.8) | 19 (65.5) | 6 (20.7) | 0 |
| MDSCC | 25 | 0 | 3 (12) | 8 (32) | 14 (56) |
| PDSCC | 11 | 0 | 0 | 2 (18.2) | 9 (81.8) |
| Group | No. | Mean ± SD | Minimum–Maximum |
|---|---|---|---|
| WDSCC | 29 | 2.9 ± 1.1 | 1.0–5.3 |
| MDSCC | 25 | 1.9 ± 0.5 | 1.0–3.4 |
| PDSCC | 11 | 1.3 ± 0.4 | 1.0–2.2 |
| Normal mucosa | 11 | 2.7 ± 1.0 | 1.1–4.2 |
| Group | Fibre orientation |
Total | |
|---|---|---|---|
| Haphazard | Parallel | ||
| WDSCC | 13 (44.8) | 16 (55.2) | 29 (100) |
| MDSCC | 19 (76) | 6 (24) | 25 (100) |
| PDSCC | 11 (100) | 0 (0) | 11 (100) |
| Total | 43 (66.2) | 22 (33.82) | 65 (100) |
| Group | Fibre arrangement |
Total | |
|---|---|---|---|
| Dense | Loose | ||
| WDSCC | 19 (65.5) | 10 (34.5) | 29 (100) |
| MDSCC | 10 (40) | 15 (58.8) | 25 (100) |
| PDSCC | 0 | 11 (100) | 11 (100) |
| Total | 29 (44.6) | 36 (55.4) | 65 (100) |
| Group | No. | Mean ± SD (%) | Minimum–Maximum |
|---|---|---|---|
| WDSCC | 29 | 25.1 ± 5.5 | 17.7–37.0 |
| MDSCC | 25 | 18.9 ± 3.7 | 11.5–24.1 |
| PDSCC | 11 | 10.6 ± 3.0 | 7.0–16.3 |
| Normal mucosa | 11 | 31.5 ± 3.5 | 27.4–36.2 |
| Group | Hue |
Total | ||
|---|---|---|---|---|
| OR | YO | GY | ||
| Normal mucosa | 6 (54.6) | 4 (36.4) | 1 (9.1) | 11 (100) |
| WDSCC | 18 (62) | 8 (27.5) | 3 (10.3) | 29 (100) |
| MDSCC | 9 (35.3) | 13 (52) | 3 (12) | 25 (100) |
| PDSCC | 0 (0) | 3 (27.3) | 8 (72.7) | 11 (100) |
| Total | 33 (43.4) | 28 (36.8) | 15 (19.7) | 76 (100) |
| Group | Birefringence |
Total | |
|---|---|---|---|
| Strong | Weak | ||
| Normal mucosa | 10 (90.9) | 1 (9.1) | 11 (100) |
| WDSCC | 26 (89.6) | 3 (10.3) | 29 (100) |
| MDSCC | 19 (76) | 6 (24.0) | 25 (100) |
| PDSCC | 3 (27.3) | 8 (72.7) | 11 (100) |
| Total | 60 (81.1) | 14 (18.9) | 76 (100) |
Values are presented as number (%). Fisher exact test p < .001. α-SMA, α-smooth muscle actin; WDSCC, well differentiated squamous cell carcinoma; MDSCC, moderately differentiated squamous cell carcinoma; PDSCC, poorly differentiated squamous cell carcinoma.
Values are presented as number (%). Fisher exact test p < .001. α-SMA, α-smooth muscle actin; WDSCC, well differentiated squamous cell carcinoma; MDSCC, moderately differentiated squamous cell carcinoma; PDSCC, poorly differentiated squamous cell carcinoma.
ANOVA test results: F(3,72) = 13.423, p < .001. Significant at p < .01. SD, standard deviation; WDSCC, well differentiated squamous cell carcinoma; MDSCC, moderately differentiated squamous cell carcinoma; PDSCC, poorly differentiated squamous cell carcinoma.
Values are presented as number (%). Chi-square = 12.6, df = 2, p = .002. Significant at p < .05. WDSCC, well differentiated squamous cell carcinoma; MDSCC, moderately differentiated squamous cell carcinoma; PDSCC, poorly differentiated squamous cell carcinoma.
Values are presented as number (%). Chi-square = 14.2, df = 2, p = .001. Significant at p < .05. WDSCC, well differentiated squamous cell carcinoma; MDSCC, moderately differentiated squamous cell carcinoma; PDSCC, poorly differentiated squamous cell carcinoma.
ANOVA test results. F(3,72) = 51.2, p < .001. Significant at p < .05. SD, standard deviation; WDSCC, well differentiated squamous cell carcinoma; MDSCC, moderately differentiated squamous cell carcinoma; PDSCC, poorly differentiated squamous cell carcinoma.
Values are presented as number (%). Fisher’s exact test, p < .001. Significant at p <. 01. OR, orange red; YO, yellowish orange; GY, greenish yellow; WDSCC, well differentiated squamous cell carcinoma; MDSCC, moderately differentiated squamous cell carcinoma; PDSCC, poorly differentiated squamous cell carcinoma.
Values are presented as number (%). Chi-square = 19.2, df = 3, p < .001. Significant at p < .01. WDSCC, well differentiated squamous cell carcinoma; MDSCC, moderately differentiated squamous cell carcinoma; PDSCC, poorly differentiated squamous cell carcinoma.

