
 E-submission
Articles
- Page Path
- HOME > J Pathol Transl Med > Forthcoming articles > Article
-
Original Article
Bronchial lesions in a high serum IgA mouse model: pulmonary venular IgA deposition and spatially distinct lymphoid cell aggregation -
Areum Kim1, Minhyeok Lee2
 , Yohan Park3, Wan Jin Hwang4, Hyeseung Lee1, Joo Heon Kim1, Jin Man Kim1, Yong Min Kim1, Jin Sun Park1, Junguee Lee1
 -
DOI: https://doi.org/10.4132/jptm.2026.06.01
Published online: July 16, 2026
1Department of Pathology, Konyang University Hospital, Konyang University College of Medicine, Daejeon, Korea
2Division of Pulmonology, Department of Internal Medicine, Konyang University Hospital, Konyang University College of Medicine, Daejeon, Korea
3Division of Nephrology, Department of Internal Medicine, Konyang University Hospital, Konyang University College of Medicine, Daejeon, Korea
4Department of Thoracic & Cardiovascular Surgery, Konyang University Hospital, Konyang University College of Medicine, Daejeon, Korea
- Corresponding Author: Junguee Lee, MD, PhD Department of Pathology, Konyang University Hospital, Konyang University College of Medicine, 158 Gwanjeodong-ro, Seo-gu, Daejeon 35365, Korea Tel: +82-42-600-6599, Fax: +82-42-600-9978, E-mail: junguee@konyang.ac.kr
© The Korean Society of Pathologists/The Korean Society for Cytopathology
This is an Open Access article distributed under the terms of the Creative Commons Attribution Non-Commercial License (https://creativecommons.org/licenses/by-nc/4.0) which permits unrestricted non-commercial use, distribution, and reproduction in any medium, provided the original work is properly cited.
- 139 Views
- 9 Download


Abstract
-
Background
- Immunoglobulin A (IgA) nephropathy is a systemic immune complex–mediated disease primarily affecting the kidneys, yet pulmonary involvement remains poorly characterized. This study investigated pulmonary structural alterations, IgA deposition, immune cell distribution, and the impact of chronic environmental immune stimulation.
-
Methods
- High-IgA (HIGA) mice and BALB/c controls were examined under baseline conditions and following chronic particulate matter (PM) exposure. Histopathology, immunofluorescence, immunohistochemistry, and lectin-based assays were used to assess pulmonary IgA deposition, lymphoid cell aggregation, and immune activation.
-
Results
- Compared with BALB/c controls, HIGA mice exhibited pulmonary venular remodeling characterized by thickening of the venular tunica media and IgA deposition within the smooth muscle layer. Under baseline conditions, lymphoid cell aggregation in HIGA mice was predominantly localized to peribronchial regions, whereas IgA deposition and C3a deposition were confined to pulmonary venules with minimal spatial overlap. Following PM exposure, HIGA mice developed additional perivenular lymphoid cell aggregation that spatially corresponded with IgA deposition, whereas BALB/c mice showed predominantly peribronchial aggregation. PM exposure was associated with increased pulmonary Toll-like receptor 9 (TLR9) expression in both strains. In HIGA mice, TLR9-positive immune cells and interleukin-6 (IL6) expression were enriched in perivenular lymphoid cell aggregates.
-
Conclusions
- Pulmonary IgA deposition in HIGA mice is associated with vascular remodeling and compartment-specific immune cell distribution, particularly under environmental stimulation. These findings support an association between IgA deposition and localized immune activation in the lung. However, the causal roles of TLR9 and IL6 in this process remain to be determined.
- Immunoglobulin A (IgA) nephropathy is the most prevalent form of primary glomerulonephritis worldwide and remains a leading cause of chronic kidney disease, with approximately 40% of patients progressing to end-stage renal disease within 20 years [1]. Despite extensive investigation, the precise pathogenesis of IgA nephropathy remains incompletely understood. The widely accepted multi-hit hypothesis proposes a sequential cascade of events that ultimately results in kidney injury [2]. The first step involves aberrant O-glycosylation of IgA1, resulting in elevated circulating levels of galactose-deficient IgA1 (Gd-IgA1) bearing abnormal O-glycans in the hinge region. This structural abnormality renders Gd-IgA1 immunogenic, thereby inducing the production of specific IgG and IgA autoantibodies, which constitutes the second hit. The third hit is characterized by the formation of circulating immune complexes through the binding of these autoantibodies to Gd-IgA1. Finally, deposition of these immune complexes within the glomerular mesangium activates mesangial cells and initiates an immune-mediated response, ultimately contributing to the progression of renal injury.
- Emerging evidence highlights the importance of mucosal immune dysregulation in the initiation and amplification of this pathogenic cascade. In particular, Toll-like receptor 9 (TLR9), which recognizes unmethylated CpG DNA motifs, has been implicated in abnormal IgA responses. Experimental studies in a mouse model of IgA nephropathy have reported that TLR9 activation is linked to increased production of interleukin-6 (IL6) and a proliferation-inducing ligand (APRIL) [3]. Through APRIL and IL6–dependent pathways, TLR9 signaling may promote the overproduction of aberrantly glycosylated IgA, thereby potentially exacerbating immune complex formation and renal injury [4]. These findings suggest that mucosal immune activation may contribute to the generation of aberrant IgA and the amplification of downstream immune responses. However, the extent to which these pathways contribute to tissue-specific pathology beyond the kidney remains unclear.
- Although IgA nephropathy has traditionally been regarded as a kidney-limited disease, increasing evidence supports the concept that elevated levels of circulating IgA and immune complexes may involve extrarenal organs. These IgA-containing immune complexes are distributed systemically, suggesting that extrarenal vascular beds—including the pulmonary microcirculation—may be susceptible to immune-mediated alterations under certain conditions. Clinical observations, such as rare cases of diffuse alveolar hemorrhage in patients with IgA nephropathy, suggest that pulmonary involvement can occur, although the underlying mechanisms remain poorly defined [5].
- The high-IgA (HIGA) mouse model, which exhibits sustained elevation of serum IgA and spontaneous glomerular IgA deposition, recapitulates key features of human IgA nephropathy and has been widely used to investigate disease mechanisms [6]. While renal manifestations in HIGA mice have been well characterized, the potential impact of systemic IgA excess on the pulmonary vasculature and local immune responses has not been systematically examined.
- In addition to systemic immune dysregulation, environmental factors may influence disease expression. In particular, inhaled particulate matter (PM) is known to induce mucosal immune activation and innate immune signaling pathways, including TLR-mediated responses. Such environmental stimuli may modulate local immune responses in the lung and interact with pre-existing immunological conditions, such as elevated circulating IgA. However, the relationship between environmental exposure, IgA deposition, and pulmonary immune alterations remains to be elucidated.
- In this study, we investigate pulmonary structural and immunological changes in HIGA mice, with a focus on IgA deposition, vascular remodeling, and lymphoid cell aggregation. We further examined the effects of chronic PM exposure on the spatial distribution of immune responses and the expression of innate immune markers, including TLR9 and IL6. Rather than establishing a direct mechanistic pathway, this study aims to characterize the associations between systemic IgA dysregulation, environmental immune stimulation, and localized pulmonary immune responses. A better understanding of these relationships may provide insight into the potential extrarenal manifestations of IgA nephropathy and inform future mechanistic investigations.
INTRODUCTION
- Mice and experimental design
- Female BALB/c mice (n = 10) and HIGA mice (n = 10) at 10 weeks of age were purchased from Japan SLC, Inc. (Shizuoka, Japan). Animals were randomized into four experimental groups (n = 5 per group): BALB/c-PM nonexposure (NE), BALB/c-PM exposure (E), HIGA-NE, and HIGA-E.
- PM exposure was performed using a standardized reference dust material (ISO 12103-1 A1 Ultrafine Test Dust, Powder Technology Inc., Burnsville, MN, USA). Mice were housed in a custom-built exposure chamber (40 × 20 × 25 cm) designed for controlled PM delivery. PM was introduced through a bottom inlet system, allowing uniform dispersion within the chamber. To ensure stable exposure conditions, PM concentrations were continuously monitored using an optical sensor (PMS5003ST, Plantower Technology, Shenzhen, China) positioned at the center of the chamber. Sensor outputs were recorded in real time throughout each exposure session. When PM concentrations decreased below the predefined target range, additional PM was introduced to maintain consistent exposure levels.
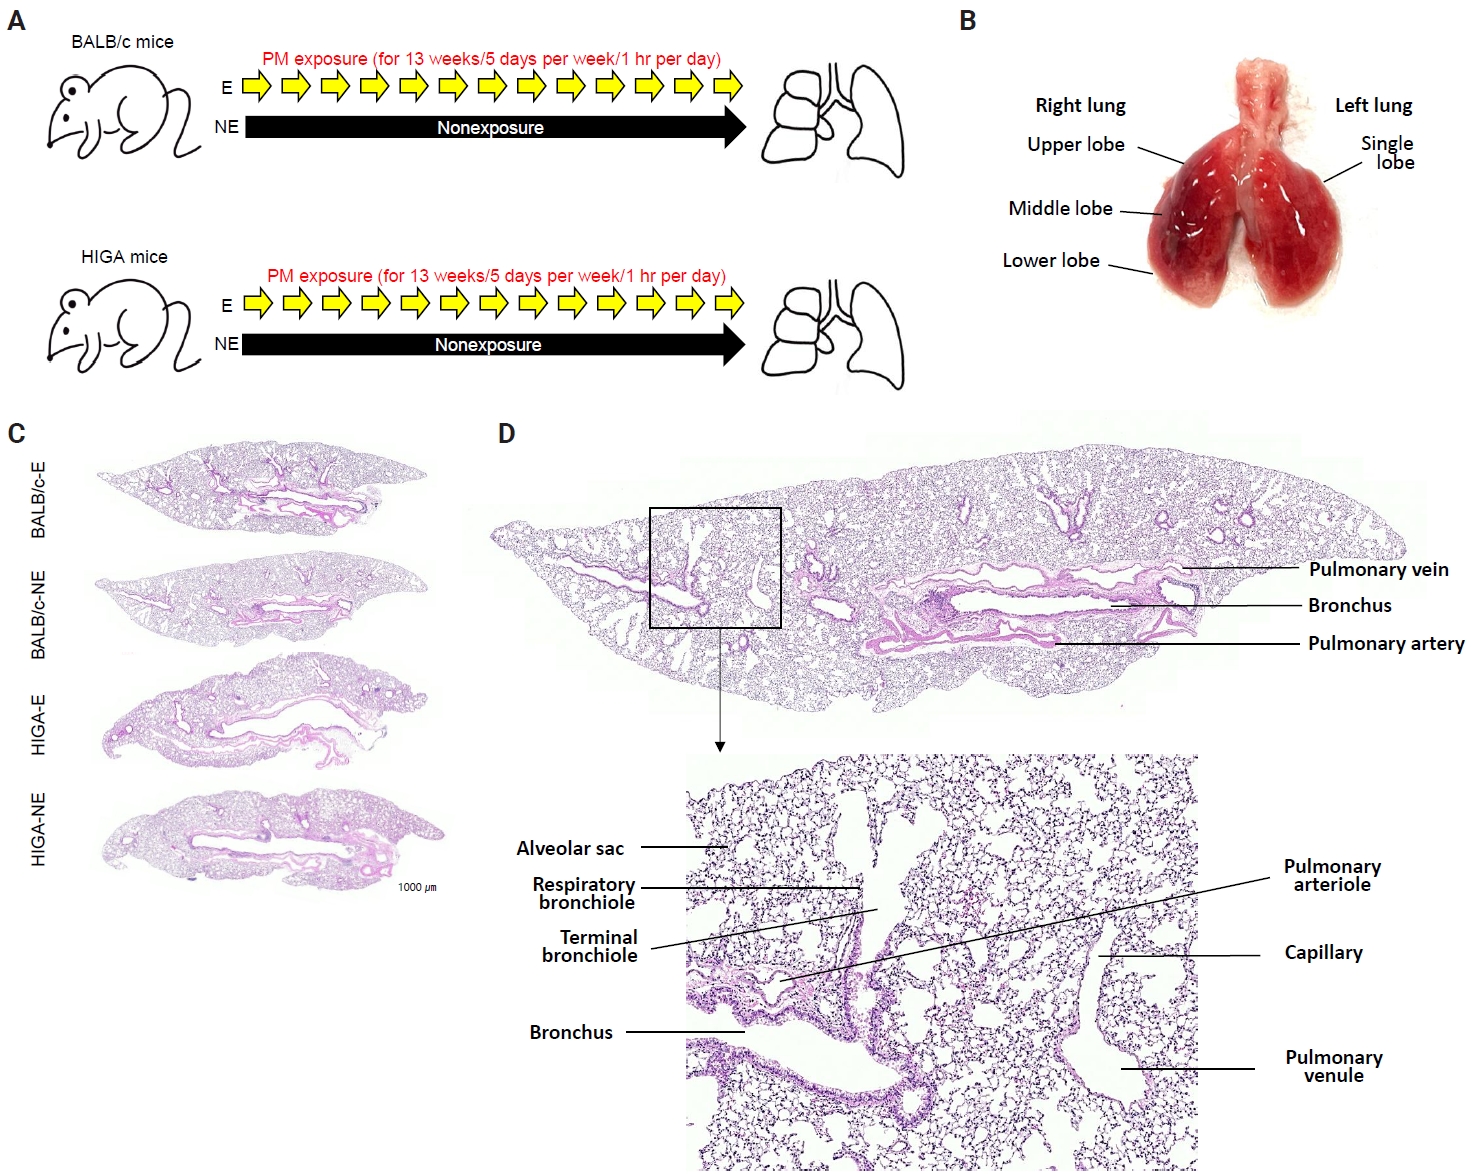
- Following a 1-week acclimation period, mice in the exposure groups were subjected to PM for 1 hour per day, 5 days per week, over a total duration of 13 weeks (Fig. 1A). BALB/c-NE and HIGA-NE groups were maintained in a separate, identical chamber supplied with PM-filtered air, resulting in negligible PM exposure (Fig. 1A). After 13 weeks of exposure to the experimental environment, 24-week-old mice were euthanized under urethane anesthesia, and lung tissues were harvested for subsequent analysis (Fig. 1B).
- Histological analysis
- The extracted right lung was inflated by injection of 10% neutral buffered formalin through the right main bronchus using a syringe. Then, the right lung tissues were fixed with 10% neutral buffered formalin for 24 hours at room temperature, processed, and embedded in paraffin. Paraffin blocks were cut into 4-μm-thick sections. Tissue slices were routinely deparaffinized and stained with hematoxylin and eosin (Fig. 1C).
- Immunofluorescence staining
- Paraffin-embedded 4-μm-thick tissue slices were placed in an oven and incubated at 56°C for 3 hours. Thereafter, tissue slices were deparaffinized in xylene and rehydrated through a graded series of ethanol baths. Antigens were retrieved in antigen retrieval buffer (0.01 M citric acid–sodium citrate, pH 6.0) by heating the cross-sections in an autoclave at 121°C for 25 minutes. After washing, the tissue slices were air-dried for 30 minutes and then re-washed with 1× phosphate-buffered saline (10 mM Na2HPO4, pH 7.4, and 150 mM NaCl). Tissue sections were stained using the BenchMark ULTRA PLUS system (Roche, Basel, Switzerland). Primary antibodies were IgA (1:1,000, Abcam, Cambridge, UK) and C3a (1:1,000, Abcam). The stained slides were observed under an Olympus BX53 microscope equipped with YODN Hyper E640 illuminator (Olympus Corp., Tokyo, Japan).
- Immunohistochemical staining
- Paraffin-embedded 4-μm-thick tissue slices were placed in an oven and incubated at 56°C for 3 hours. Immunohistochemistry (IHC) was performed using the BenchMark ULTRA PLUS system (Roche Diagnostics, Indianapolis, IN, USA). Primary antibodies were CD3 (1:200, Abcam), CD20 (1:200, Abcam), Bcl6 (1:200, Abcam), TLR9 (1:200, Abcam), IL6 (1:200, Novus Biologicals, Centennial, CO, USA), CD138 (1:200, Abcam), and F4/80 (1:200, Abcam). Slides were cover slipped and analyzed under an OLYMPUS BX53 microscope.
- Definition of peribronchial and perivenular compartments
- For spatial localization analysis, peribronchial compartments were defined as regions immediately adjacent to the bronchial wall, including the surrounding peribronchiolar connective tissue. Perivenular compartments were defined as regions surrounding pulmonary venules identified morphologically by their thin vascular walls and the absence of an accompanying airway structure. Localization of lymphoid cell aggregates, IgA deposition, and C3a positivity was evaluated according to their predominant distribution within these compartments.
- Measurement of serum IgA and IgA glycosylation by lectin-based enzyme-linked immunosorbent assay
- Serum IgA concentrations were measured using a commercial enzyme-linked immunosorbent assay kit (Bethyl Laboratories, Montgomery, TX, USA) according to the manufacturer’s instructions. To evaluate IgA glycosylation patterns, a lectin-based detection method was employed using Sambucus nigra lectin (SNL; Vector Laboratories, Newark, CA, USA) and Ricinus communis agglutinin I (RCA-I; Vector Laboratories), which preferentially bind terminal sialic acid and galactose residues, respectively. Serum samples were applied to IgA capture plates, followed by incubation with biotinylated SNL or RCA-I. Lectin binding was detected using an avidin–horseradish peroxidase conjugate, and the absorbance was recorded at 450 nm. This method, frequently applied in rodent models, provides an indirect assessment of IgA glycosylation by reflecting the terminal sugar composition of N-linked glycans.
- Assessment of TLR9 expression
- TLR9 is expressed intracellularly in endosomal compartments of various immune cells, including B cells, plasmacytoid dendritic cells, and macrophages [7]. TLR9 expression was assessed by counting the number of TLR9-positive cells within areas of immune cell aggregation. To characterize the cellular composition of these aggregates, IHC staining was performed. T lymphocytes were identified by CD3 (1:200, Abcam), B lymphocytes by CD20 (1:200, Abcam), plasma cells by CD138 (1:200, Abcam), and macrophages by F4/80 (1:200, Abcam).
- Histological quantification and unit of analysis
- Histological and immunohistochemical analyses were performed using the entire available lung section rather than limited focal regions. Multiple representative high-power fields encompassing the whole lung section were analyzed for each mouse. Quantitative measurements were initially obtained at the field level and subsequently averaged to generate a single value per mouse, which was used as the biological replicate for statistical analysis. Spatial localization analyses were performed by separately evaluating peribronchial and perivenular compartments.
- Quantification of lung TLR9 levels by enzyme-linked immunosorbent assay
- TLR9 levels in lung tissue were quantified using an enzyme-linked immunosorbent assay (ELISA) kit (Cat. No. A77428, Antibodies.com, Cambridge, UK). The left lung of each mouse was homogenized using the BeadBlaster 24 Microtube homogenizer (D2400, Benchmark Scientific, Sayreville, NJ, USA), and the supernatant was collected for the assay. Samples were diluted to 1:60, and the assay was conducted following the manufacturer’s instructions. A standard curve was generated using 1 ng/mL TLR9, and optical density was measured at 450 nm.
- Statistical analysis
- All statistical analyses were conducted using SPSS ver. 17.0 (SPSS Inc., Chicago, IL, USA). Data were presented as means ± standard deviation. Pairwise statistical comparisons were performed between predefined biologically relevant groups, including BALB/c-NE vs. BALB/c-E, BALB/c-NE vs. HIGA-NE, BALB/c-NE vs. HIGA-E, BALB/c-E vs. HIGA-NE, BALB/c-E vs. HIGA-E, and HIGA-NE vs. HIGA-E. The statistical significance of differences between two groups was determined using a Student’s t-test. Differences with p-value < .05 were considered to be statistically significant.
MATERIALS AND METHODS
- Structural and histological alterations in the lungs of HIGA mice compared with BALB/c controls
- In both BALB/c and HIGA mice, the lungs are anatomically divided into right and left lobes, with the right lung comprising four lobes and the left lung consisting of a single lobe (Fig. 1B). Gross examination revealed no discernible differences in lung morphology among the experimental groups. The pulmonary airways were located in close proximity to blood vessels, with the pulmonary arteries running parallel to the bronchi and conducting bronchioles (Fig. 1D). Histological examination confirmed that the lower respiratory tract consisted of bronchi, bronchioles, alveolar ducts, and alveolar sacs (Fig. 1D).
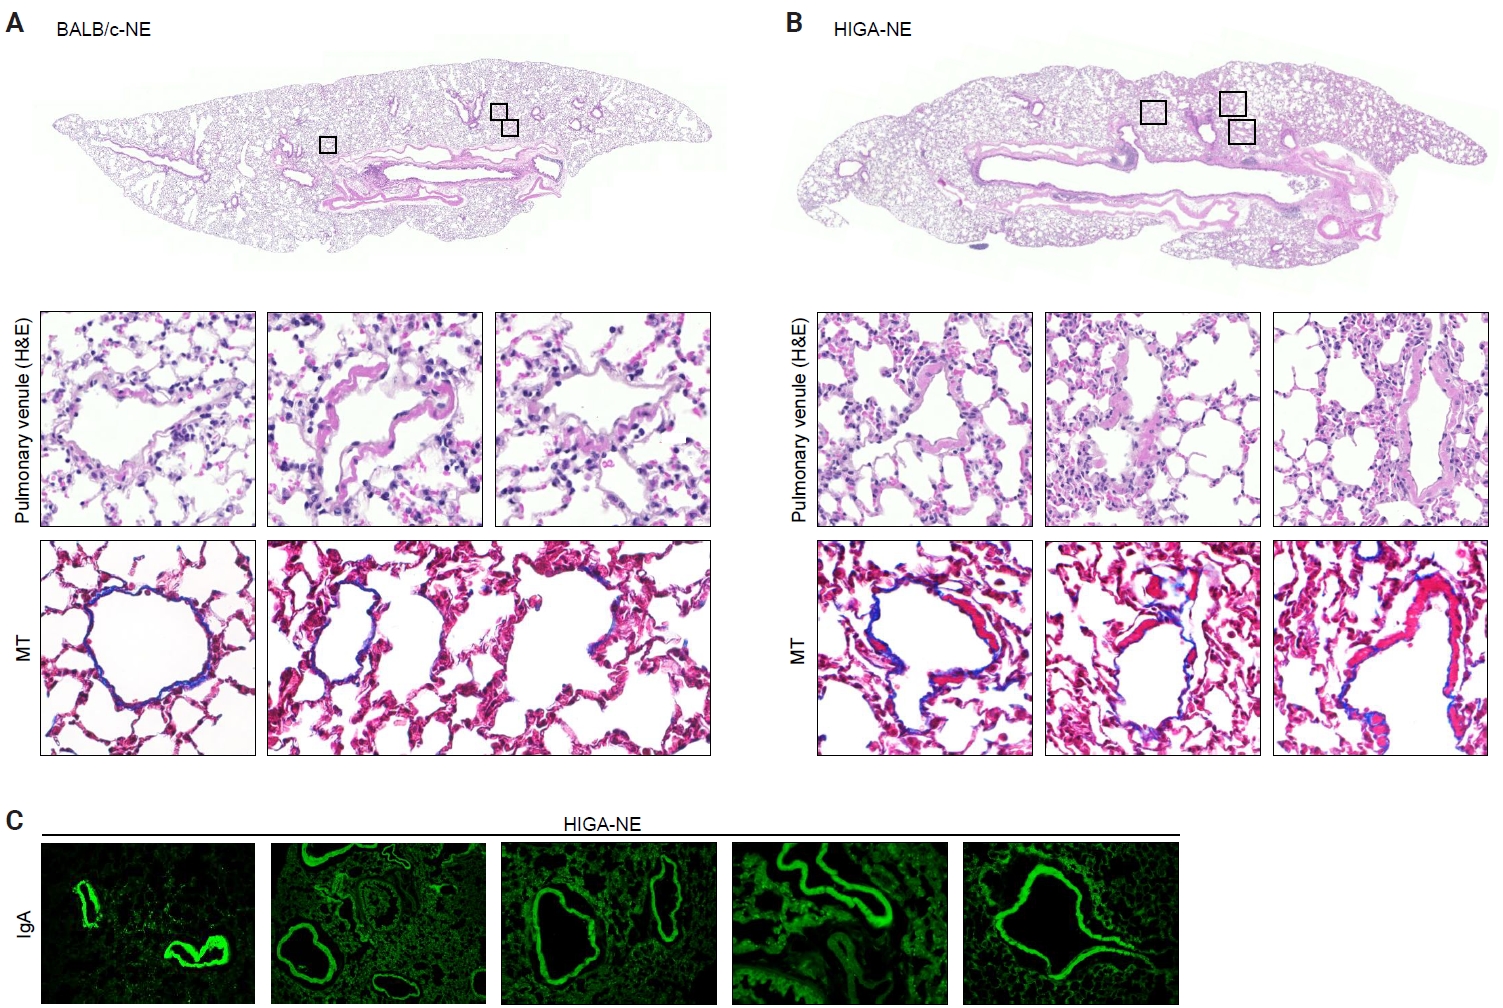
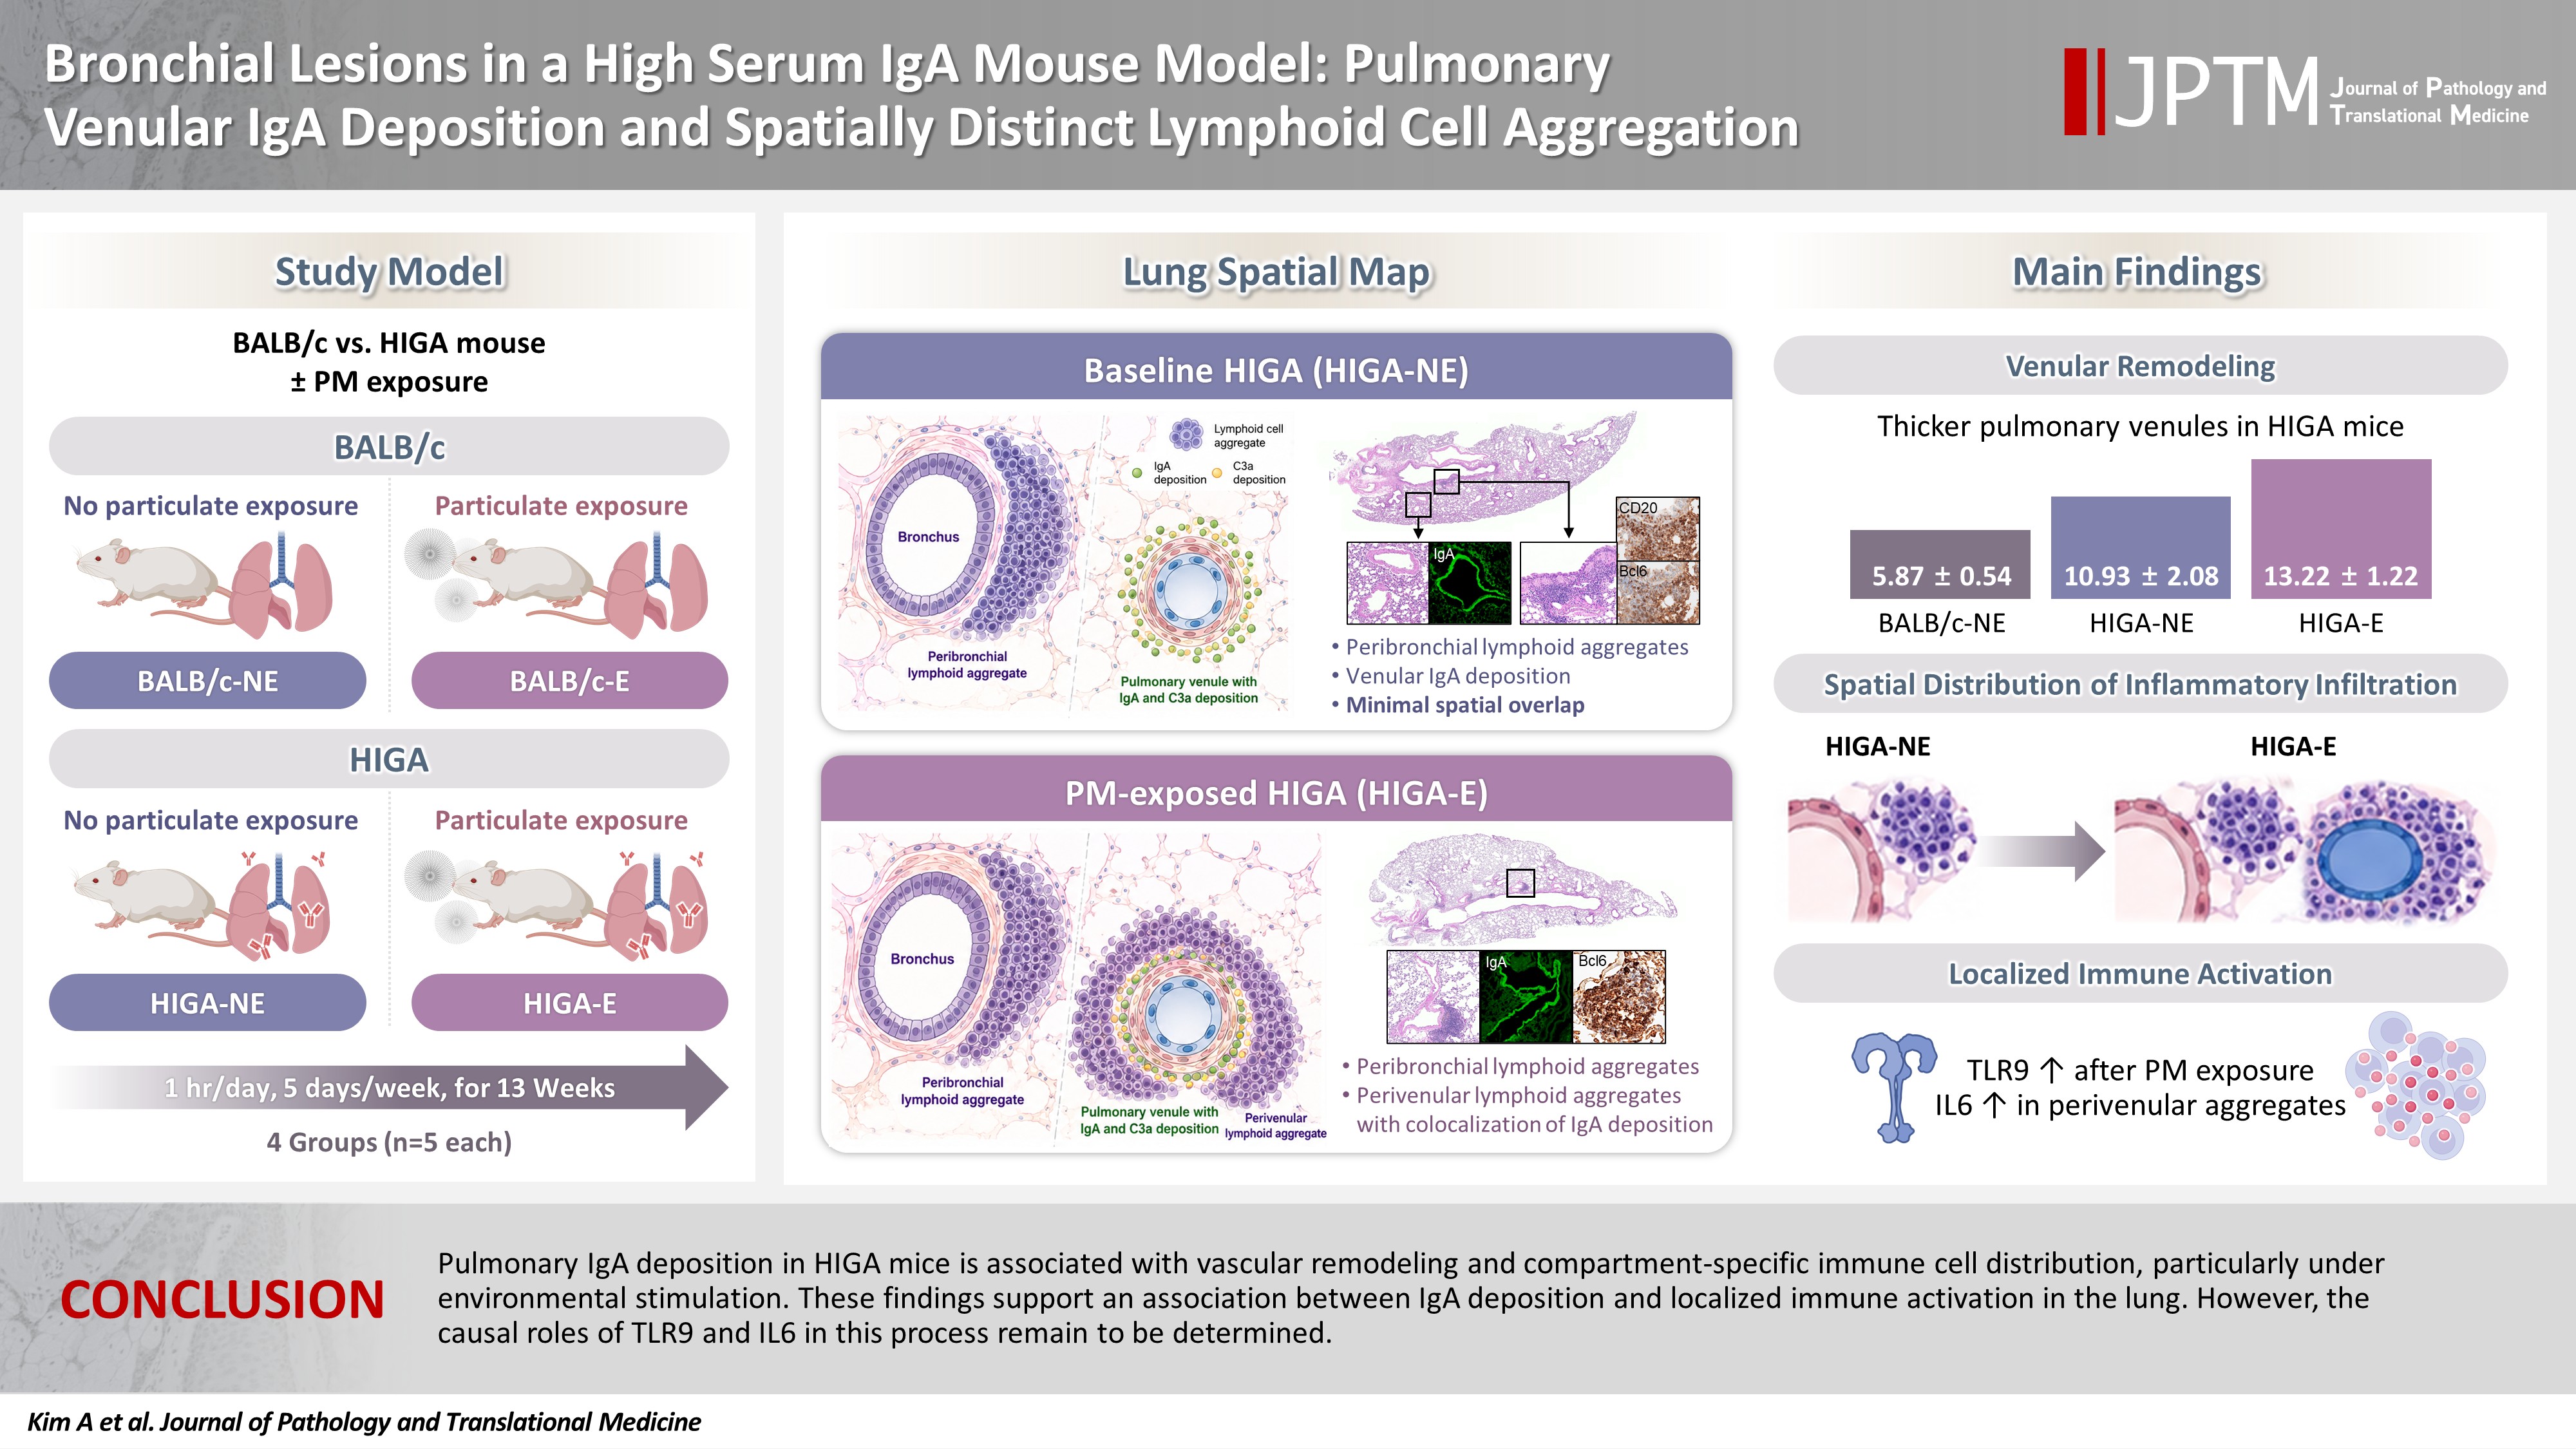
- Despite similar overall gross and histological architecture, notable differences were observed in the pulmonary vasculature between the two strains. Compared with BALB/c-NE mice, HIGA-NE mice exhibited significant vascular wall thickening, particularly within the pulmonary venules. In BALB/c-NE mice, venules showed a thin tunica media composed of delicate elastic fibers and sparse smooth muscle cells, as demonstrated by Masson’s trichrome staining (Fig. 2A). In contrast, HIGA-NE mice displayed prominent thickening of the venular walls, with increased smooth muscle layer within the tunica media (Fig. 2B). Quantitative morphometric analysis confirmed a significant increase in venular tunica media thickness in HIGA-NE mice (10.93 ± 2.08 µm) compared with BALB/c-NE mice (5.87 ± 0.54 µm, p = 0.003) (Table 1).
- Given that HIGA mice are characterized by elevated serum IgA levels and glomerular IgA deposition, we next examined whether IgA deposition also occurred in the pulmonary vasculature. Immunofluorescence (IF) staining revealed distinct IgA deposition localized to the smooth muscle layer of pulmonary venules in HIGA-NE mice, whereas no IgA deposition was detected in BALB/c-NE controls (Fig. 2C).
- Peribronchial lymphoid cell aggregation in the lungs of HIGA mice
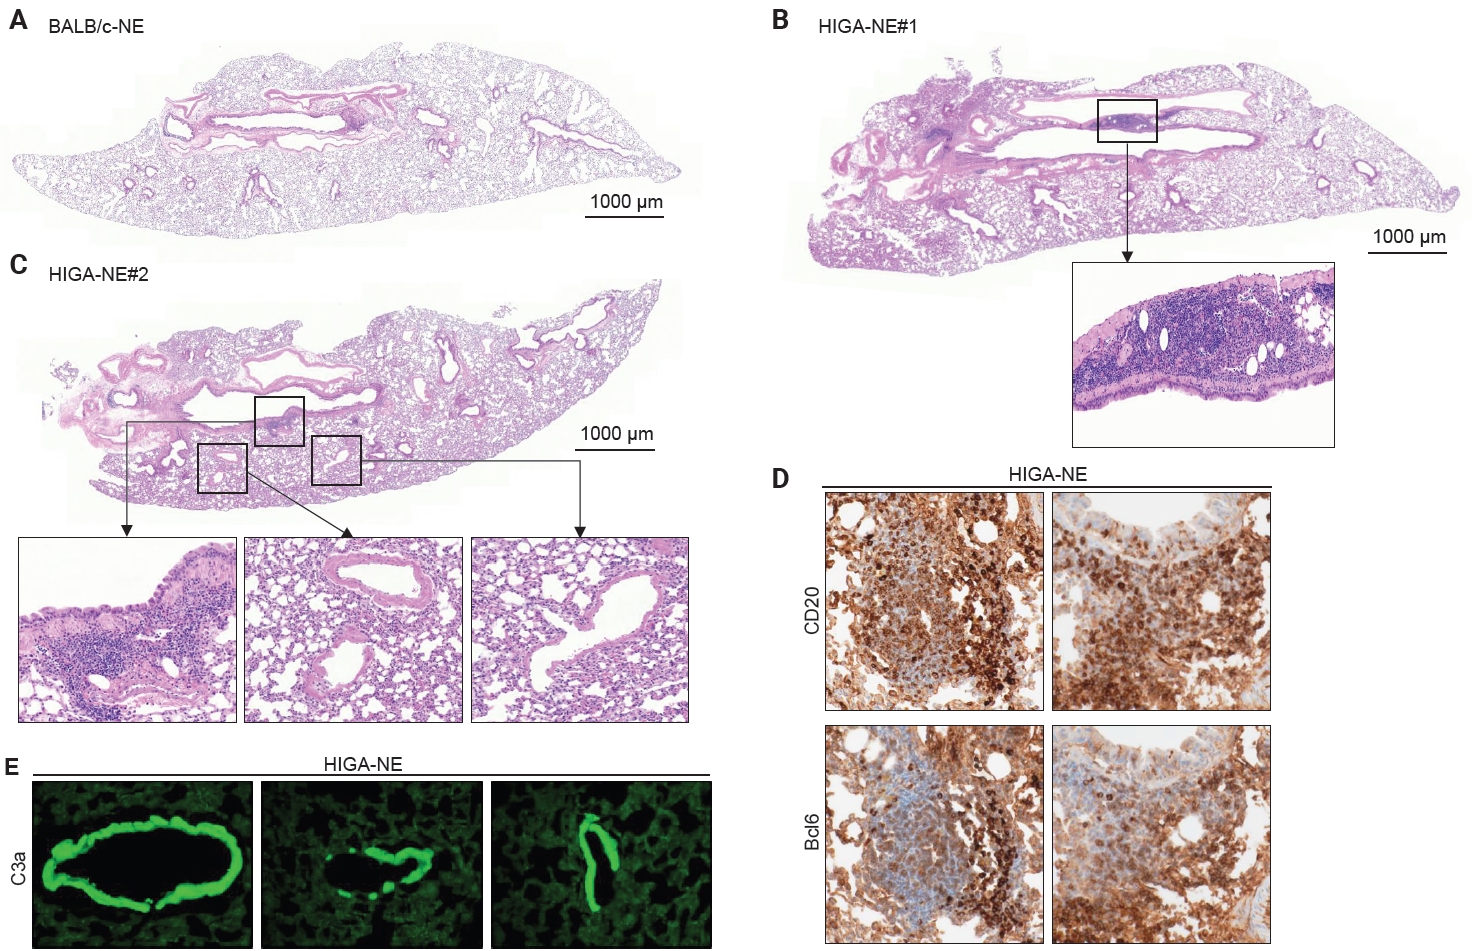
- Compared with BALB/c-NE mice (Fig. 3A), HIGA-NE mice exhibited prominent inflammatory cell aggregation, predominantly localized to the peribronchial regions, particularly around the main bronchi (Fig. 3B, C). These aggregates consisted predominantly of lymphocytes, with smaller numbers of macrophages and plasma cells. In some areas, the aggregates exhibited features suggestive of lymphoid follicular organization, including germinal center–like structures. IHC demonstrated distinct B-cell and T-cell compartmentalization, as indicated by CD20 and CD3 staining, along with Bcl6-positive cells, supporting germinal center formation (Fig. 3D). These findings support the presence of organized lymphoid structures.
- To evaluate whether the IgA deposited in the pulmonary vasculature corresponds to pathogenic Gd-IgA1, serum IgA levels and IgA glycosylation status were evaluated. Serum IgA levels were substantially higher in HIGA-NE (6,069 ± 493 μg/mL) and HIGA-E (6,743 ± 758 μg/mL) mice than in BALB/c-NE mice (699 ± 69 μg/mL, p < 0.05), consistent with the hyper-IgAemic phenotype of this model. Lectin-binding assays using RCA-I and SNL were performed as surrogate measures of IgA glycosylation, as commonly applied in rodent studies, primarily reflecting N-glycan structures [8]. Reduced lectin binding in HIGA mice suggests a relative increase in poorly glycosylated IgA fractions. RCA-I and SNL binding levels were 1.75 ± 0.31 and 1.73 ± 0.28 at OD450 in the HIGA-NE group, respectively. Those in the HIGA-E mice were 1.32 ± 0.10 and 1.30 ± 0.15 at OD450. In contrast, RCA-I and SNL were not reliably detected in BALB/c mice. This may be attributable to the substantially lower serum IgA concentrations in this group, which could fall near or below the detection threshold of the lectin-based assay.
- In the pathogenesis of IgA nephropathy, local deposition of Gd-IgA1–containing immune complexes is known to be associated with complement activation in the mesangial region [9]. To assess the functional relevance of pulmonary IgA deposition, complement activation was evaluated by IF staining for C3a. C3a deposition was detected in the pulmonary venules of HIGA-NE mice (Fig. 3E), suggesting that the deposited IgA is associated with complement activation rather than being biologically inert.
- Although the precise molecular nature of the deposited IgA—specifically, whether it corresponds to Gd-IgA1—could not be determined in this model, these findings suggest that pulmonary IgA deposition occurs in a biologically active context and may contribute to local inflammatory processes.
- Notably, peribronchial lymphoid cell aggregation was spatially distinct from perivenular IgA and C3a deposition in HIGA-NE mice. This spatial separation indicates that peribronchial lymphoid organization and perivenular IgA deposition occur through partially independent mechanisms. Therefore, further studies are required to establish a direct association between IgA deposition and lymphoid cell aggregation.
- Spatial distribution of pulmonary lymphoid cell aggregation in HIGA mice following PM inhalation
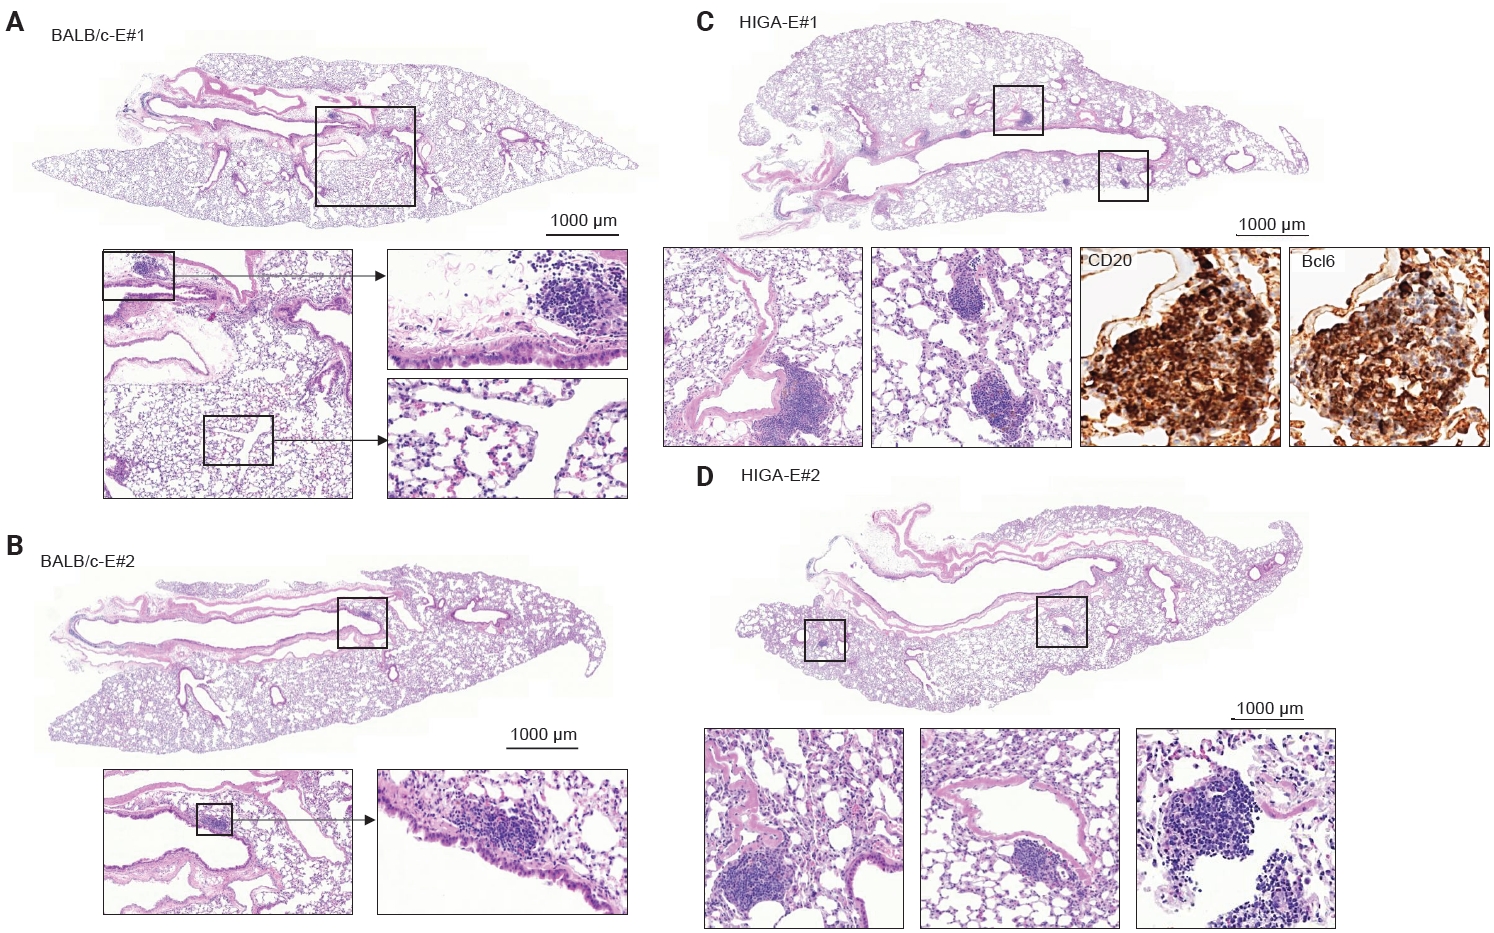
- To further investigate the relationship between IgA deposition and lymphoid cell responses, mice were exposed to PM. Following PM exposure, BALB/c-E mice demonstrated lymphoid cell aggregation primarily localized to the peribronchial regions (Fig. 4A, B). In contrast, HIGA-E mice exhibited lymphoid cell aggregation in both the peribronchial and perivenular compartments (Fig. 4C, D).
- Quantitative analysis showed that the total area of lymphoid cell aggregates was significantly increased in HIGA-E mice compared with other groups (p < 0.001 for all). The mean aggregate areas were zero in BALB/c-NE, 10,468.3 ± 1,066.3 µm² in BALB/c-E, 64,342.8 ± 7,590.2 µm² in HIGA-NE, and 110,786.0 ± 13,543.0 µm² in HIGA-E mice (Table 1). To further characterize the spatial distribution, the area of lymphoid cell aggregation was analyzed separately in the peribronchial and perivenular compartments (Table 1). HIGA-E mice showed persistent peribronchial aggregation (10.78 ± 3.36 µm²) together with a marked increase in perivenular lymphoid cell infiltration (9.60 ± 2.96 µm²). This de novo perivenular infiltration was the primary driver of the increased total lymphoid cell area in the HIGA-E group, distinguishing it from the BALB/c-E and HIGA-NE groups. These findings indicate that PM exposure is associated with altered compartment-specific lymphoid cell distribution in HIGA mice.
- TLR9 and IL6 expression in the lungs of HIGA mice following PM inhalation
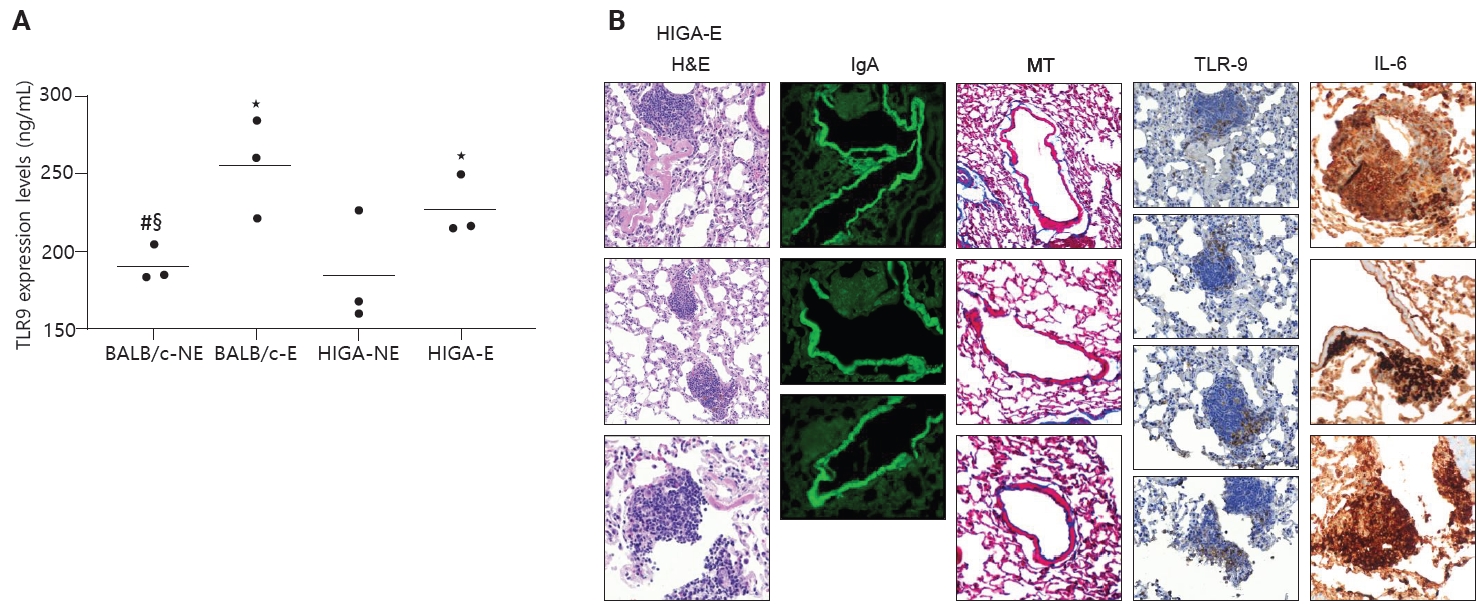
- In patients with IgA nephropathy, mucosal immune responses are abnormally activated, leading to the overproduction of Gd-IgA1. This dysregulation is thought to be mediated by enhanced TLR9 signaling [10]. To assess innate immune activation in response to PM exposure, TLR9 expression levels were examined. ELISA analysis revealed that TLR9 expression was significantly increased in PM-exposed groups (BALB/c-E and HIGA-E) compared to nonexposed groups (BALB/c-NE and HIGA-NE) (Fig. 5A).
- TLR9 is primarily expressed in the endosomal compartments of immune cells, including B lymphocytes, plasmacytoid dendritic cells, and macrophages [11]. TLR9-expressing cells were identified by IHC staining, and TLR9-positive cells were predominantly localized within areas of lymphoid cell aggregation. The proportion of TLR9-positive cells within lymphoid cell aggregates was subsequently quantified. BALB/c-NE mice were excluded due to the absence of lymphoid cell aggregates. The proportions of TLR9-positive cells were 0.12% ± 0.07% in BALB/c-E, 0.10% ± 0.08% in HIGA-NE, and 0.07% ± 0.05% in HIGA-E mice. Notably, a statistically significant difference was observed between the BALB/c-E and HIGA-E groups (p < 0.001) (Table 1).
- Because HIGA-E mice exhibited lymphoid cell aggregation in both peribronchial and perivenular regions, TLR9-positive immune cells were further analyzed separately within peribronchial and perivenular lymphoid cell aggregates. In HIGA-E mice, TLR9-positive immune cells were relatively enriched within perivenular aggregates compared with peribronchial regions (Table 1, Fig. 5B). In addition, IL6 expression was higher in perivenular aggregates of HIGA-E mice compared with HIGA-NE mice (Fig. 5B). These findings indicate that perivenular lymphoid cell aggregation in HIGA mice is accompanied by increased TLR9 and IL6 expression. However, these observations are correlative and do not establish a causal relationship between these pathways and the observed tissue changes.
- Taken together, these results indicate that PM exposure is associated with increased TLR9 expression and lymphoid cell aggregation in the lung. In BALB/c-E mice, lymphoid cell aggregation is predominantly localized to peribronchial regions. In HIGA-NE mice, IgA deposition in pulmonary venules is observed without a corresponding increase in TLR9 or IL6 expression. In HIGA-E mice, PM exposure is associated with the coexistence of pulmonary IgA deposition, perivenular lymphoid cell aggregation, and increased expression of TLR9 and IL6 within these regions. These findings suggest a potential link between IgA deposition and localized immune activation under conditions of environmental stimulation. However, the present data are observational in nature and do not establish a direct causal relationship between TLR9/IL6 signaling and the development of perivenular inflammation.
RESULTS
- This study demonstrates distinct structural and immunological alterations in the lungs of HIGA mice, characterized by pulmonary venular IgA deposition, vascular remodeling, and compartment-specific lymphoid cell aggregation. These features were observed in association with chronic environmental immune stimulation, such as PM exposure. The findings support a potential association between perivenular IgA deposition and altered immune cell distribution, particularly under conditions of environmental stimulation.
- Evidence of complement activation was observed in the present study, as indicated by C3a deposition in pulmonary venules. In renal IgA nephropathy, complement activation—particularly via the alternative and lectin pathways—is closely associated with mesangial injury and disease progression [12]. The detection of C3a in pulmonary venules suggests that deposited IgA is not biologically inert and may be associated with downstream immune activation. However, the extent to which complement activation contributes to structural or inflammatory changes in the lung cannot be determined from the current data.
- Importantly, in HIGA mice under baseline conditions, IgA deposition in pulmonary venules was observed in the absence of prominent perivenular lymphoid cell aggregation, whereas lymphoid responses were predominantly localized to peribronchial regions. This spatial dissociation suggests that IgA deposition alone may be insufficient to elicit an overt perivascular immune response. Instead, additional environmental stimuli, such as PM exposure, appear to be associated with the emergence of perivenular lymphoid cell aggregation that spatially overlapped with IgA deposition. Following PM exposure, HIGA mice exhibited lymphoid cell aggregation in both peribronchial and perivenular compartments, whereas BALB/c mice demonstrated predominantly peribronchial localization. These findings indicate that systemic IgA elevation and pulmonary IgA deposition may be associated with vascular microenvironment that responds differently to secondary immune stimulation.
- TLR9 signaling has been implicated in mucosal immune activation and aberrant IgA responses in IgA nephropathy. In this study, PM exposure was associated with increased pulmonary TLR9 expression in both BALB/c and HIGA mice. Notably, in HIGA-E mice, TLR9–positive immune cells were selectively enriched within perivenular lymphoid cell aggregates compared with peribronchial regions. In addition, IL6 expression was increased in perivenular aggregates of HIGA-E mice. These findings suggest that localized immune activation involving TLR9 and IL6 is associated with perivenular inflammatory regions in the context of PM exposure. However, these findings are based on correlative data. Functional validation experiments—such as pharmacologic inhibition of TLR9 signaling or neutralization of IL6—were not performed in the present study. Therefore, it cannot be concluded that the TLR9/IL6 pathway plays a causal role in driving perivenular inflammation. Instead, our data support an association between environmental immune stimulation, IgA deposition, and localized immune activation. Further mechanistic studies will be required to determine whether TLR9/IL6 signaling is necessary or sufficient for the observed pathological changes.
- From a broader perspective, the present findings support a conceptual framework in which pulmonary IgA deposition is associated with a vascular microenvironment that exhibits altered responsiveness to secondary immune stimuli. This interpretation is consistent with clinical observations in IgA nephropathy, where respiratory infections often precede disease exacerbations and, in rare cases, pulmonary complications [13]. However, direct extrapolation of these findings to human disease should be made with caution. In addition, the data raise the possibility that environmental exposures, such as air pollution, may contribute to heterogeneity in disease expression among susceptible individuals. The HIGA mouse model, particularly under controlled environmental conditions, may provide a useful experimental system for further investigating these interactions.
- Several limitations should be acknowledged. First, the glycosylation status of IgA deposited in lung tissue was not directly evaluated. Lectin-binding assays were used as surrogate measures of IgA glycosylation; however, these approaches primarily reflect N-glycan structures and do not directly assess Gd-IgA1, which is central to human IgA nephropathy. In addition, RCA-I binding was not detectable in BALB/c mice, likely due to the markedly low serum IgA levels, which may have limited assay sensitivity. Second, functional assessments of pulmonary physiology were not performed, and thus, the clinical significance of the observed histological changes remains to be determined. Third, although PM exposure provided a reproducible model of environmental immune stimulation, it does not fully recapitulate respiratory pathogens relevant to human disease. Finally, the relatively small sample size (n = 5 per group) may limit the generalizability of the findings.
- In conclusion, this study demonstrates that pulmonary IgA deposition in HIGA mice is associated with vascular remodeling and compartment-specific immune cell aggregation, particularly under conditions of environmental exposure. These findings support a possible link between systemic IgA dysregulation and pulmonary immune alterations, suggesting that the lung may represent a potential extrarenal site involved in IgA nephropathy. However, these findings are based on observational data, and the causal role of specific immune pathways, including TLR9 and IL6, remains to be determined. Further studies are required to clarify the underlying mechanisms and to determine the clinical relevance of these observations.
DISCUSSION
Ethics Statement
All experiments were approved by the Institutional Animal Care and Use Committee (IACUC) of Konyang University (approval No. P-23-11-E-01) and conducted in accordance with the institutional guidelines and regulations.
Availability of Data and Material
The datasets generated and/or analyzed during the current study are available from the corresponding author on reasonable request.
Code Availability
Not applicable.
Author Contributions
Conceptualization: JL, ML, YP. Data curation: AK, JL. Formal analysis: AK, JL. Funding acquisition: JL. Investigation: AK, JL, ML, YP, HL. Methodology: AK, JL, ML, YP, JSP, YMK. Supervision: JHK, JMK, WJH. Validation: AK, JL, JHK, JMK. Visualization: AK, JL. Writing—original draft: AK, JL, ML, YP. Writing—review & editing: AK, JL. Approval of final manuscript: all authors.
Conflicts of Interest
The authors declare that they have no potential conflicts of interest.
Funding Statement
This work was supported by 2023 Research Settlement Fund for the New Faculty of Konyang University Hospital (Junguee Lee).
- 1. Rajasekaran A, Julian BA, Rizk DV. IgA nephropathy: an interesting autoimmune kidney disease. Am J Med Sci 2021; 361: 176-94. ArticlePubMedPMC
- 2. Khan SR, Canales BK, Dominguez-Gutierrez PR. Randall's plaque and calcium oxalate stone formation: role for immunity and inflammation. Nat Rev Nephrol 2021; 17: 417-33. ArticlePubMedPDF
- 3. Novak J, Julian BA, Mestecky J, Renfrow MB. Glycosylation of IgA1 and pathogenesis of IgA nephropathy. Semin Immunopathol 2012; 34: 365-82. ArticlePubMedPDF
- 4. Makita Y, Suzuki H, Kano T, et al. TLR9 activation induces aberrant IgA glycosylation via APRIL- and IL-6-mediated pathways in IgA nephropathy. Kidney Int 2020; 97: 340-9. ArticlePubMedPMC
- 5. Joglekar K, Eason JD, Molnar MZ. Do we really need more evidence to use hepatitis C positive donor kidney more liberally? Clin Kidney J 2017; 10: 560-3. ArticlePubMedPMC
- 6. Malherbe K. Tumor microenvironment and the role of artificial intelligence in breast cancer detection and prognosis. Am J Pathol 2021; 191: 1364-73. ArticlePubMed
- 7. Kou M, Wang L. Surface Toll-like receptor 9 on immune cells and its immunomodulatory effect. Front Immunol 2023; 14: 1259989.ArticlePubMedPMC
- 8. Kano T, Suzuki H, Makita Y, et al. Lessons from IgA nephropathy models. Int J Mol Sci 2024; 25: 11484.ArticlePubMedPMC
- 9. Zhang H, Deng Z, Wang Y. Molecular insight in intrarenal inflammation affecting four main types of cells in nephrons in IgA nephropathy. Front Med (Lausanne) 2023; 10: 1128393.ArticlePubMedPMC
- 10. Lombardi VC, Khaiboullina SF. Plasmacytoid dendritic cells of the gut: relevance to immunity and pathology. Clin Immunol 2014; 153: 165-77. ArticlePubMedPMC
- 11. Kumagai Y, Takeuchi O, Akira S. TLR9 as a key receptor for the recognition of DNA. Adv Drug Deliv Rev 2008; 60: 795-804. ArticlePubMed
- 12. Roos A, Rastaldi MP, Calvaresi N, et al. Glomerular activation of the lectin pathway of complement in IgA nephropathy is associated with more severe renal disease. J Am Soc Nephrol 2006; 17: 1724-34. ArticlePubMedPMC
- 13. Bramlage CP, Wallbach M, Ellenberger D, et al. Variables to predict nephrological disease in general, and glomerulonephritis in particular, in patients with microhematuria. J Clin Med Res 2017; 9: 560-6. ArticlePubMedPMC
REFERENCES
Figure & Data
References
Citations

 PubReader
 ePub Link
-
 Cite this Article
- Cite this Article
-
- Close
- Download Citation
- Close
 XML Download
- Figure
-
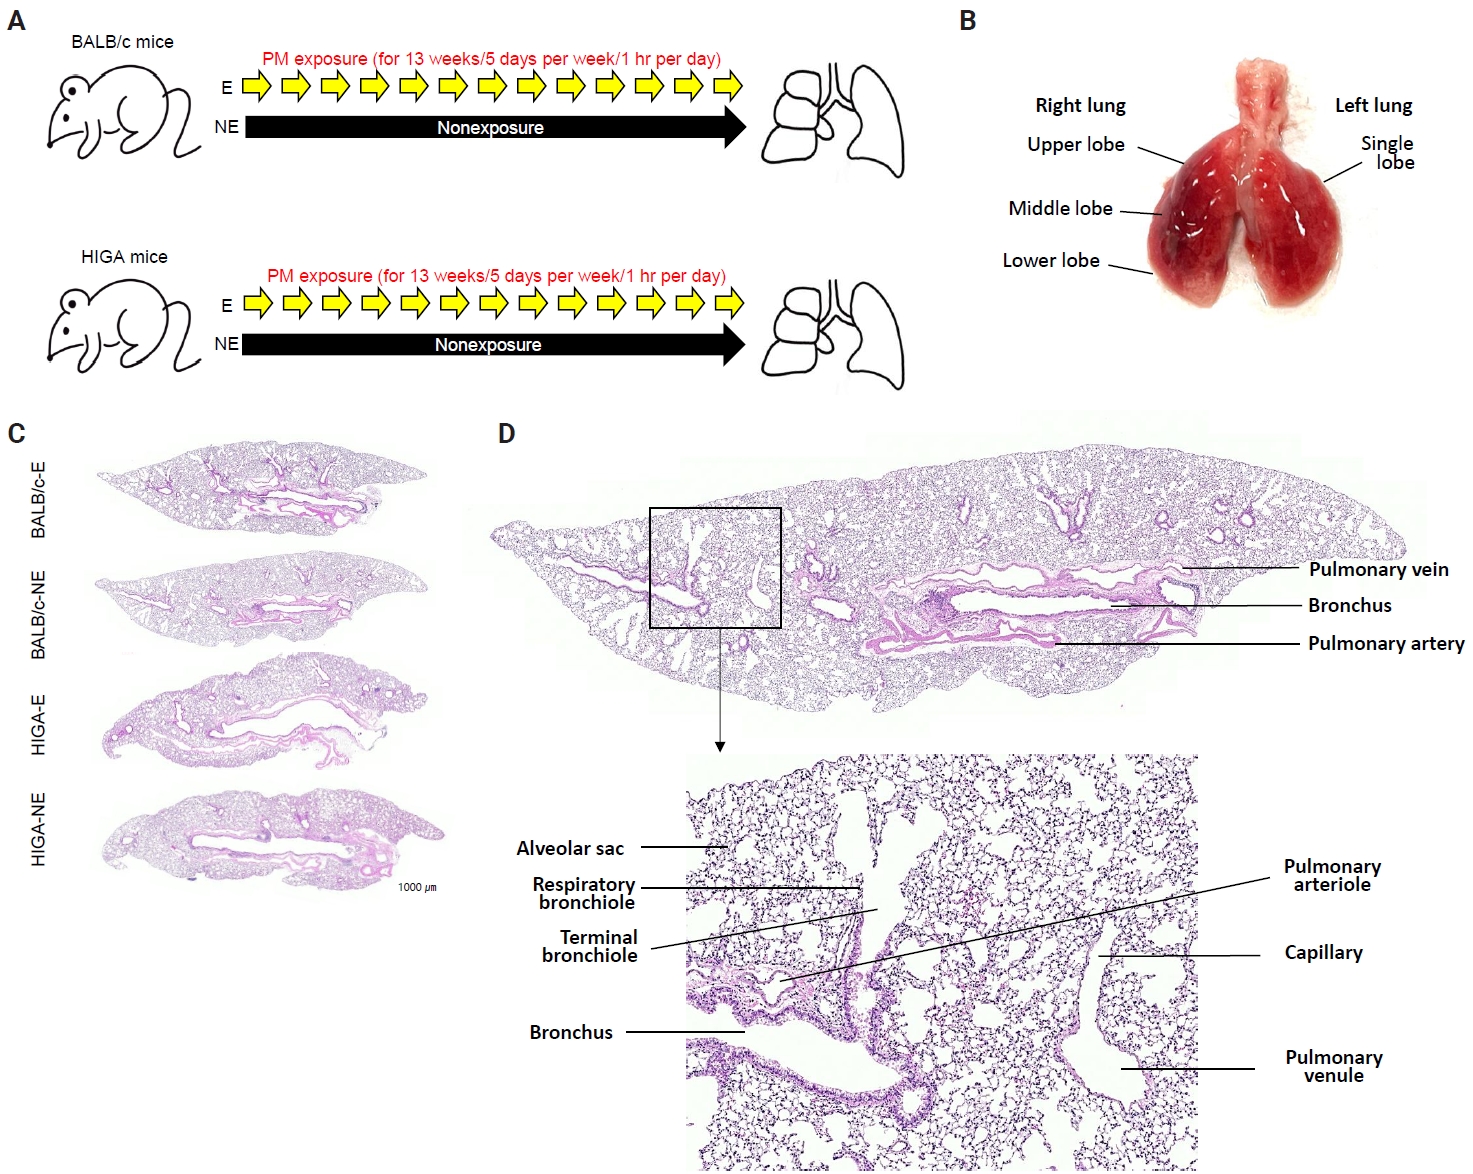
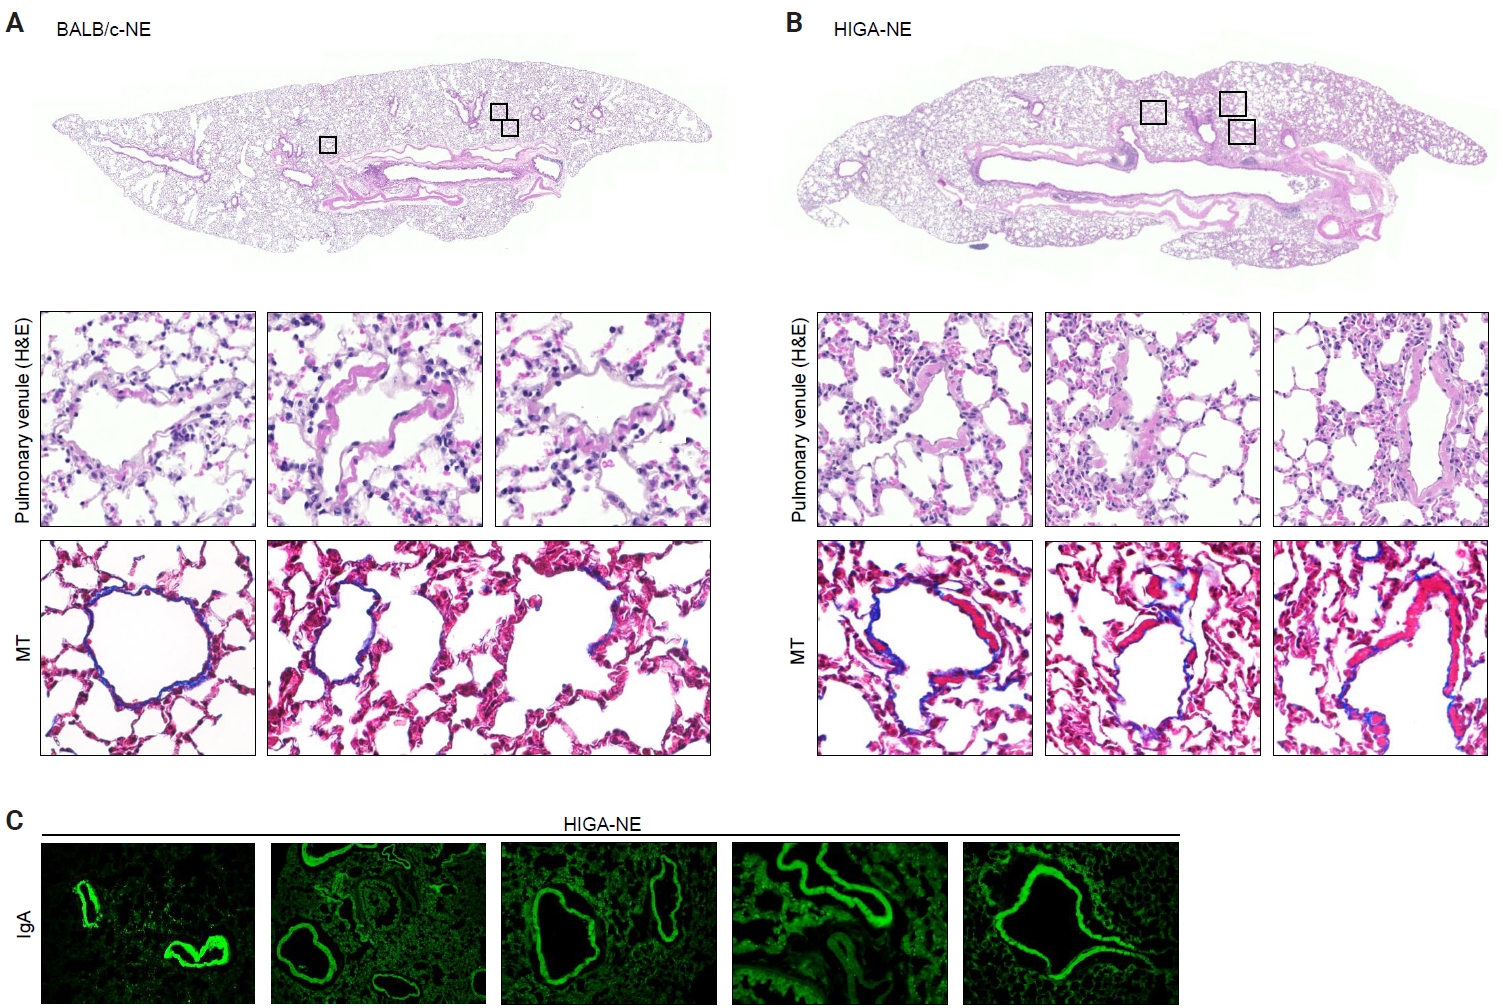
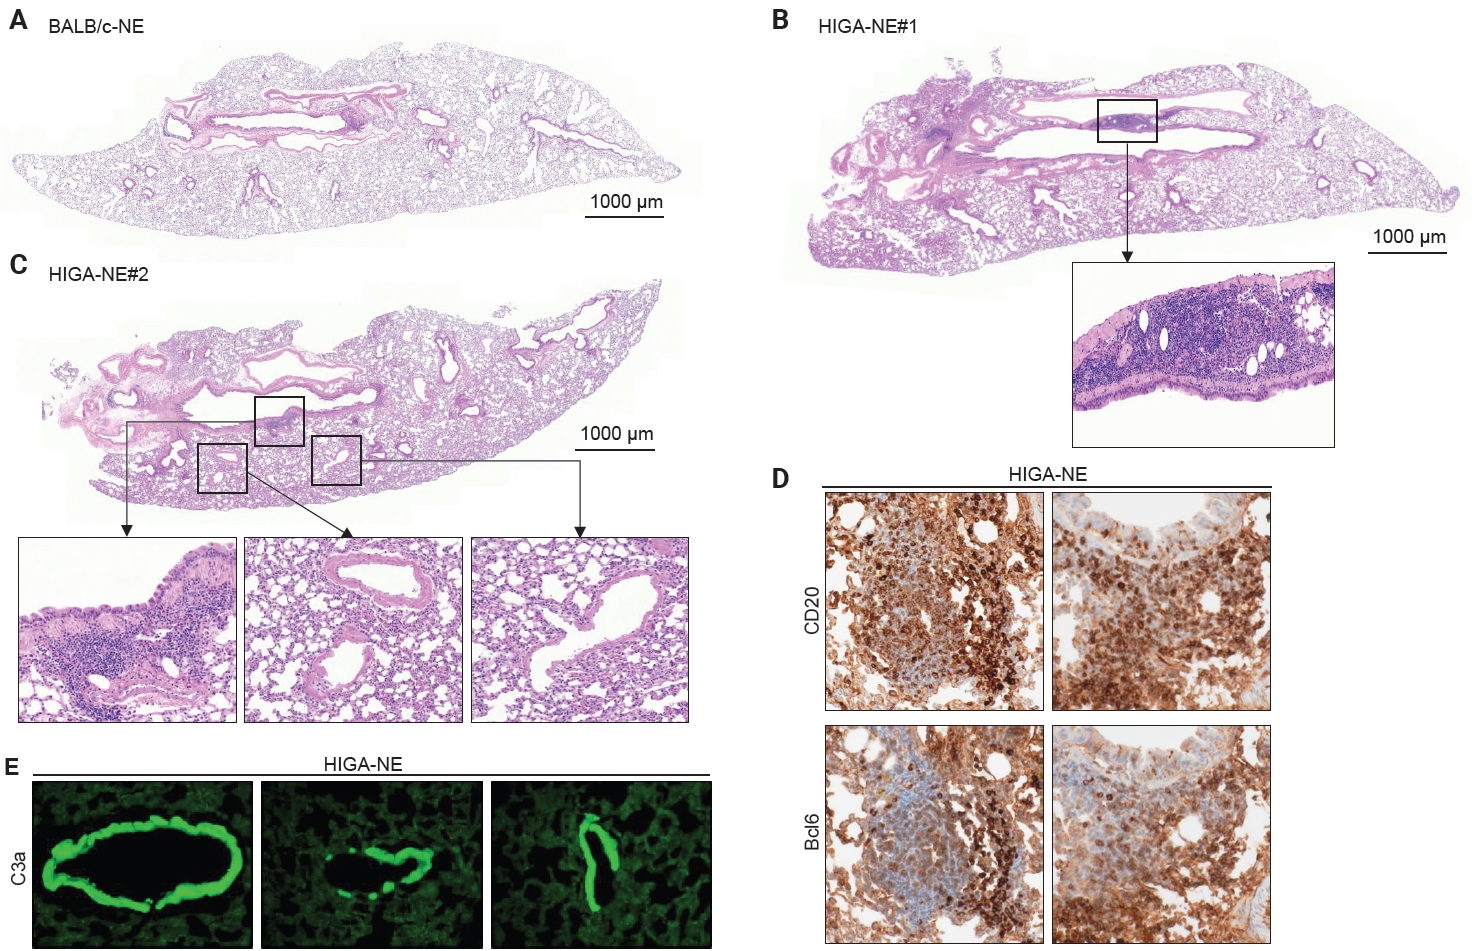
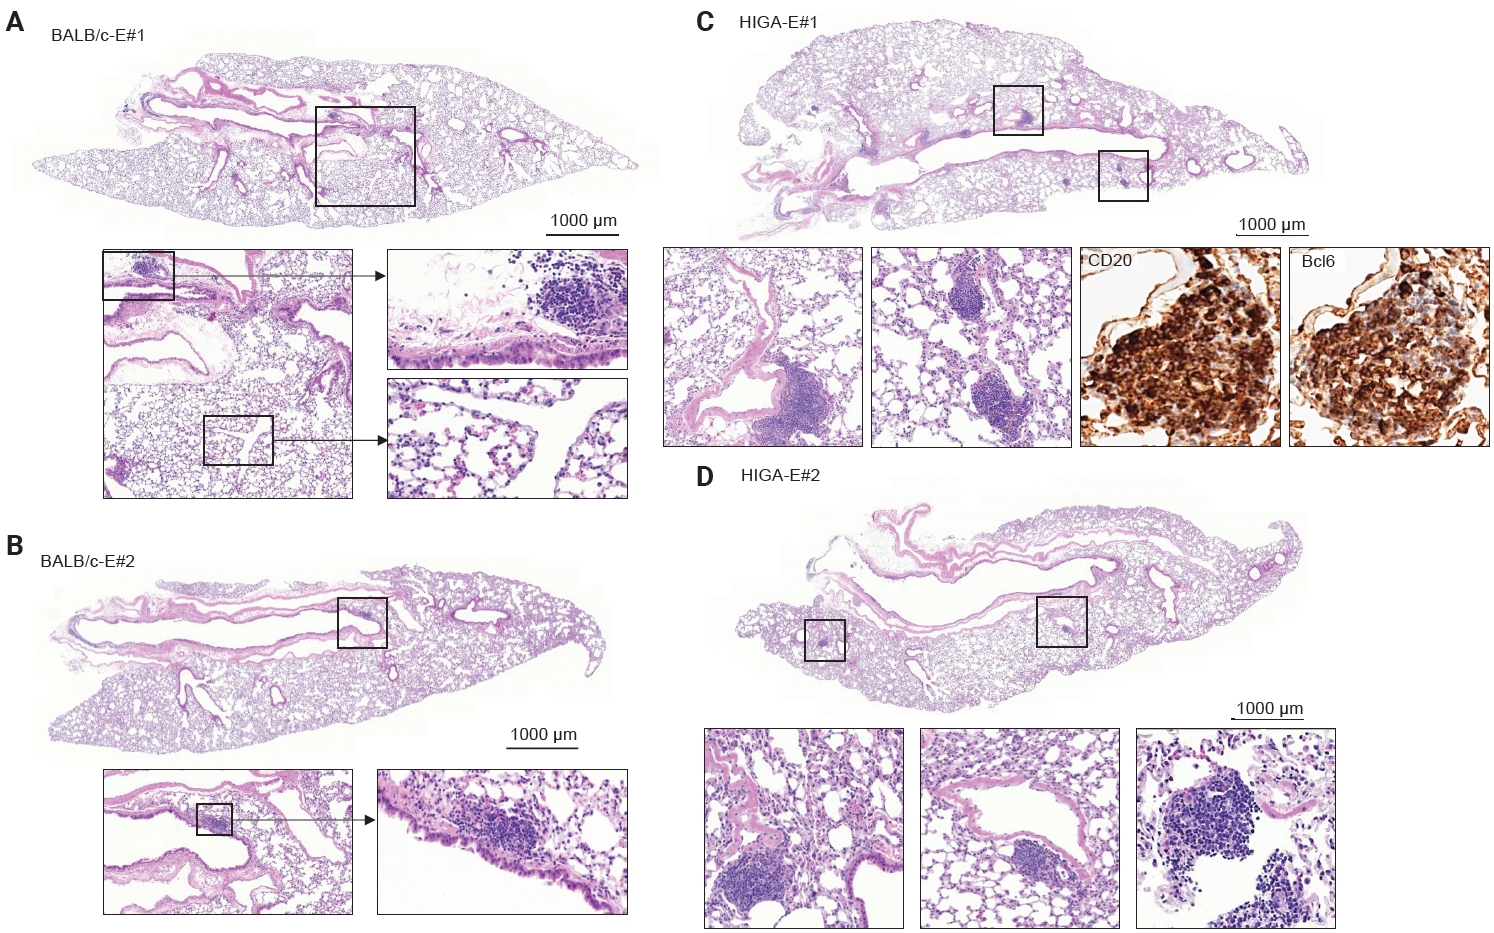
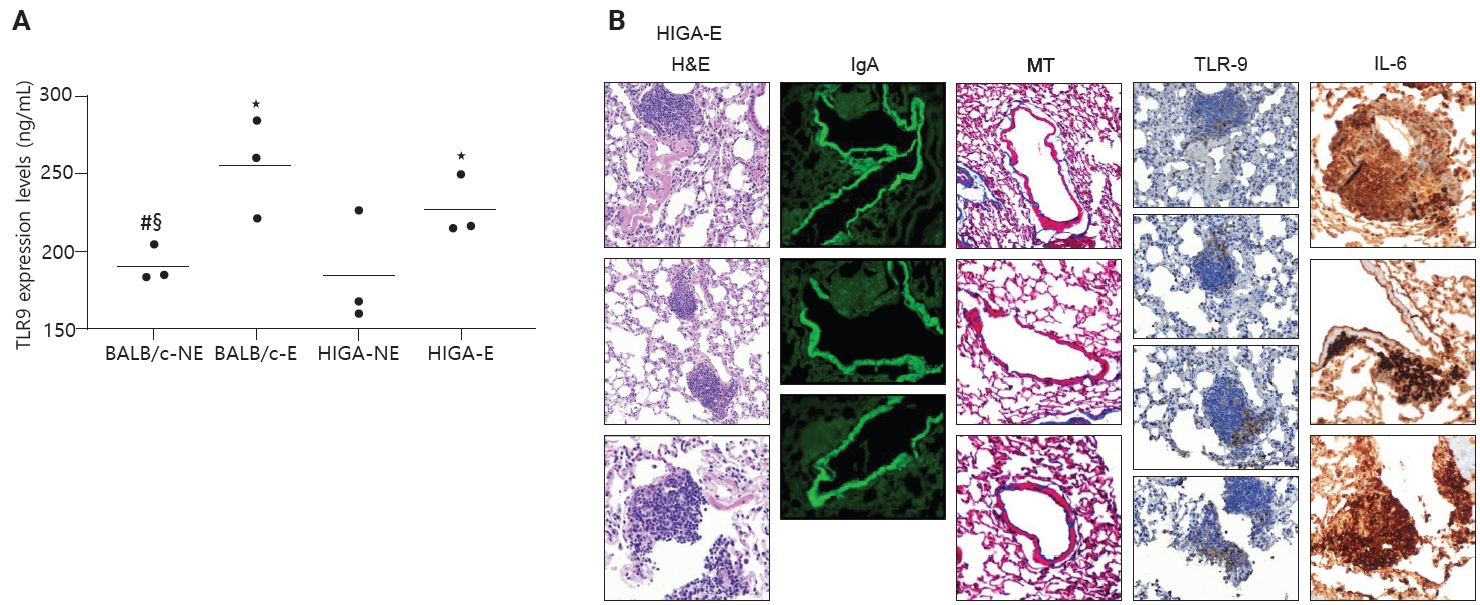
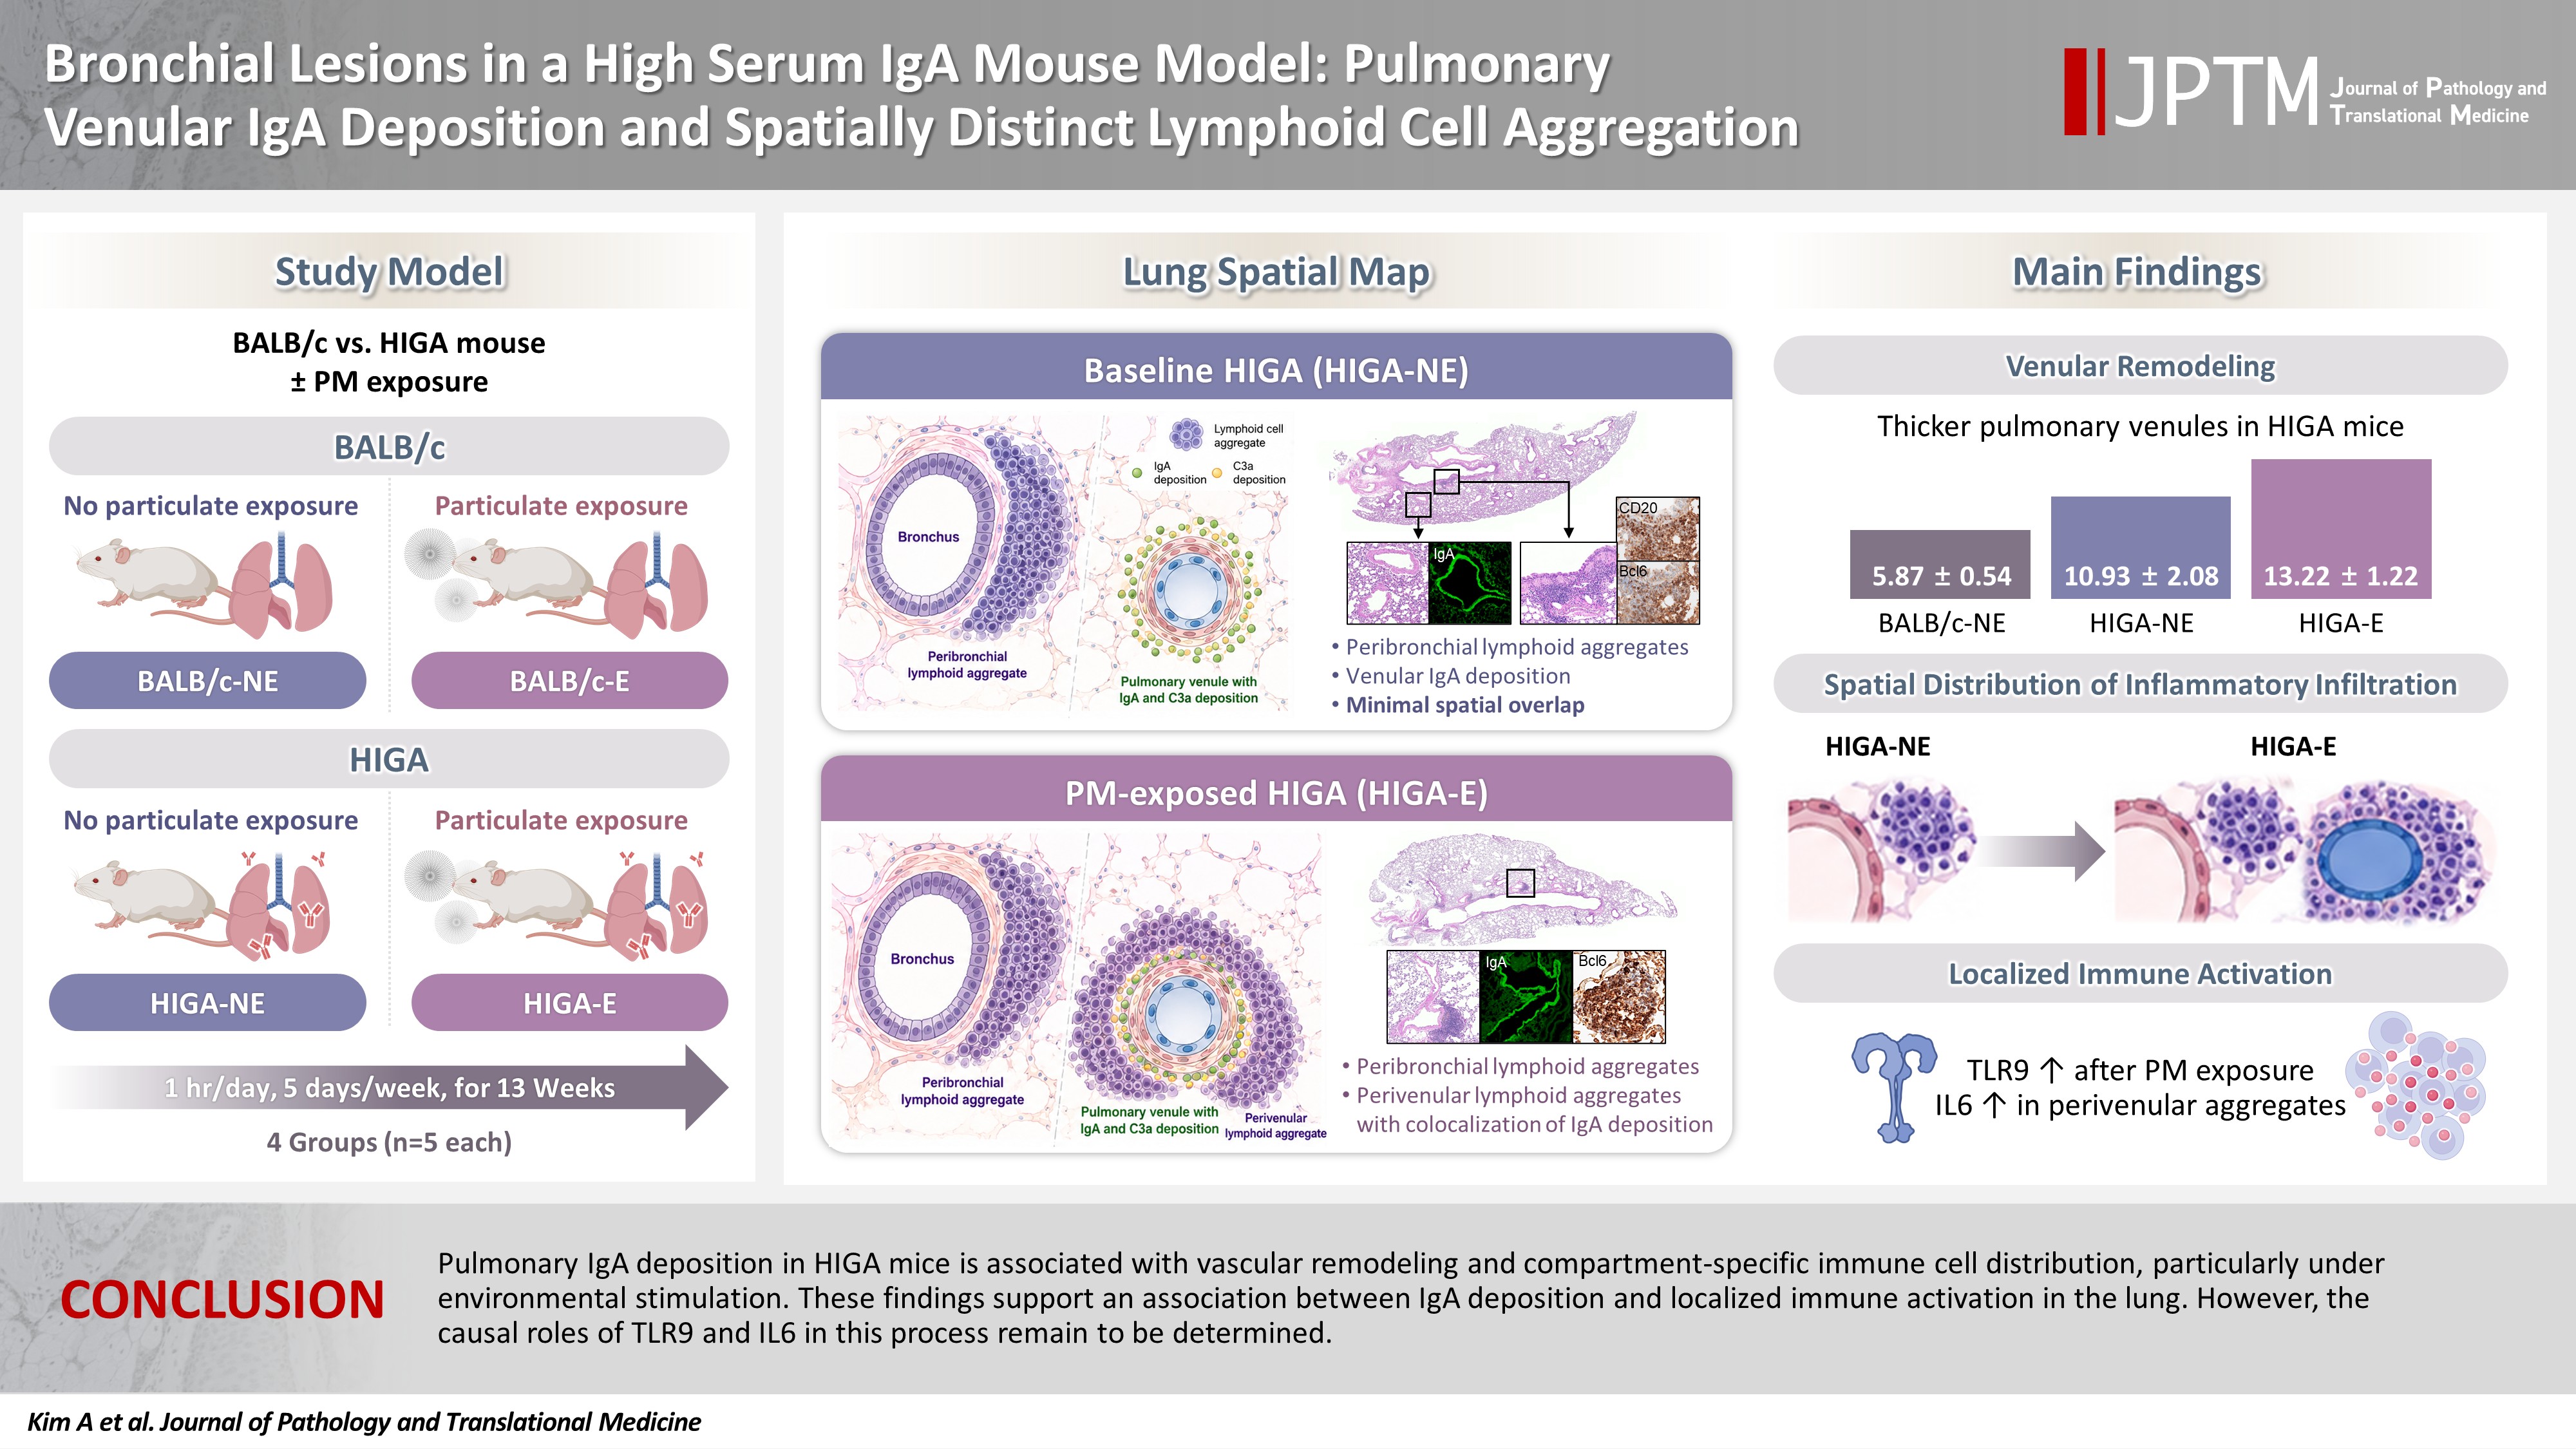
Fig. 1.
Fig. 2.
Fig. 3.
Fig. 4.
Fig. 5.
Graphical abstract
| Mean ± SD | Comparison group | p-value | |
|---|---|---|---|
| Thickness of venule (µm) | |||
| BALB/c-NE (A) | 5.87 ± 0.54 | A–B | .324 |
| BALB/c-E (B) | 5.64 ± 0.64 | A–C | .003 |
| HIGA-NE (C) | 10.93 ± 2.08 | A–D | <.001 |
| HIGA-E (D) | 13.22 ± 1.22 | B–C | <.001 |
| B–D | <.001 | ||
| C–D | .033 | ||
| Area of lymphoid cell aggregation (µm2) | |||
| BALB/c-NE (A) | 0 ± 0 | A–B | <.001 |
| BALB/c-E (B) | 10,468.3 ± 1,066.3 | A–C | <.001 |
| HIGA-NE (C) | 64,342.8 ± 7,590.2 | A–D | <.001 |
| HIGA-E (D) | 110,786.0 ± 13,543.0 | B–C | <.001 |
| B–D | <.001 | ||
| C–D | <.001 | ||
| Peribronchial region (pb) of HIGA-E | 10.78 ± 3.36 | .040 | |
| Perivenular region (pv) of HIGA-E | 9.60 ± 2.96 | ||
| TLR9 expressed cells (numbers) | |||
| BALB/c-NE (A) | 0 ± 0 | - | |
| BALB/c-E (B) | 10.2 ± 1.5 | - | |
| HIGA-NE (C) | 47.5 ± 10.5 | - | |
| HIGA-E (D) | 48.7 ± 24.7 | - | |
| Percentage of TLR9 expression (%) | |||
| BALB/c-NE (A) | 0 ± 0 | B–C | .307 |
| BALB/c-E (B) | 0.12 ± 0.07 | B–D | <.001 |
| HIGA-NE (C) | 0.10 ± 0.08 | C–D | .467 |
| HIGA-E (D) | 0.07 ± 0.05 | ||
| Peribronchial region (pb) of HIGA-E | 0.0008 ± 0.0006 | HIGA-E/pb - HIGA-NE | <.001 |
| Perivenular region (pv) of HIGA-E | 0.15 ± 0.02 | HIGA-E/pv - HIGA-NE | .045 |
SD, standard deviation; NE, PM nonexposure; E, PM exposure; HIGA, high-IgA; TLR9, Toll-like receptor 9; PM, particulate matter.


