
 E-submission

Articles
- Page Path
- HOME > J Pathol Transl Med > Volume 60(6); 2026 > Article
-
Original Article
Prognostic value of PD-L1 combined positive score in colorectal adenocarcinoma -
Thi Thanh Xuan Le1,2
 , Van Chu Nguyen1,3, Thi Minh Hanh Ngo2, Thi Hue Le2, Minh Son Le2, Huu Song Le4, Xuan Hoan Nghiem4,5
-
Journal of Pathology and Translational Medicine 2026;60(6):611-624.
DOI: https://doi.org/10.4132/jptm.2026.08.24
Published online: November 13, 2026
1Hanoi Medical University, Hanoi, Vietnam
2Department of Pathology, 108 Military Central Hospital, Hanoi, Vietnam
3K Hospital (Quan Su Campus), Hanoi, Vietnam
4Vietnamese-German Center for Medical Research, 108 Military Central Hospital, Hanoi, Vietnam
5Department of Military Science, 108 Military Central Hospital, Hanoi, Vietnam
- Corresponding Author: Xuan Hoan Nghiem, MD, PhD Vietnamese-German Center for Medical Research (VG-CARE), 108 Military Central Hospital, No. 1 Tran Hung Dao Street, Hai Ba Trung Ward, Hanoi 10000, Vietnam Tel: +84-69-698-720, Fax: +84-24-3821-3229, E-mail: nghiemxuanhoan@108-icid.com
© The Korean Society of Pathologists/The Korean Society for Cytopathology
This is an Open Access article distributed under the terms of the Creative Commons Attribution Non-Commercial License (https://creativecommons.org/licenses/by-nc/4.0) which permits unrestricted non-commercial use, distribution, and reproduction in any medium, provided the original work is properly cited.
- 65 Views
- 3 Download


Abstract
-
Background
- The prognostic significance of programmed cell death ligand 1 (PD-L1) in colorectal adenocarcinoma remains unclear. We evaluated the clinicopathological and prognostic relevance of the PD-L1 combined positive score (CPS).
-
Methods
- This single-center retrospective cohort included 124 patients with histopathologically confirmed colorectal adenocarcinoma; PD-L1 was assessed by CPS. Disease-free survival (DFS) and overall survival (OS) were evaluated using Kaplan-Meier methods and parsimonious Cox regression, and early recurrence within 12 months of curative-intent treatment with a truncated Cox model.
-
Results
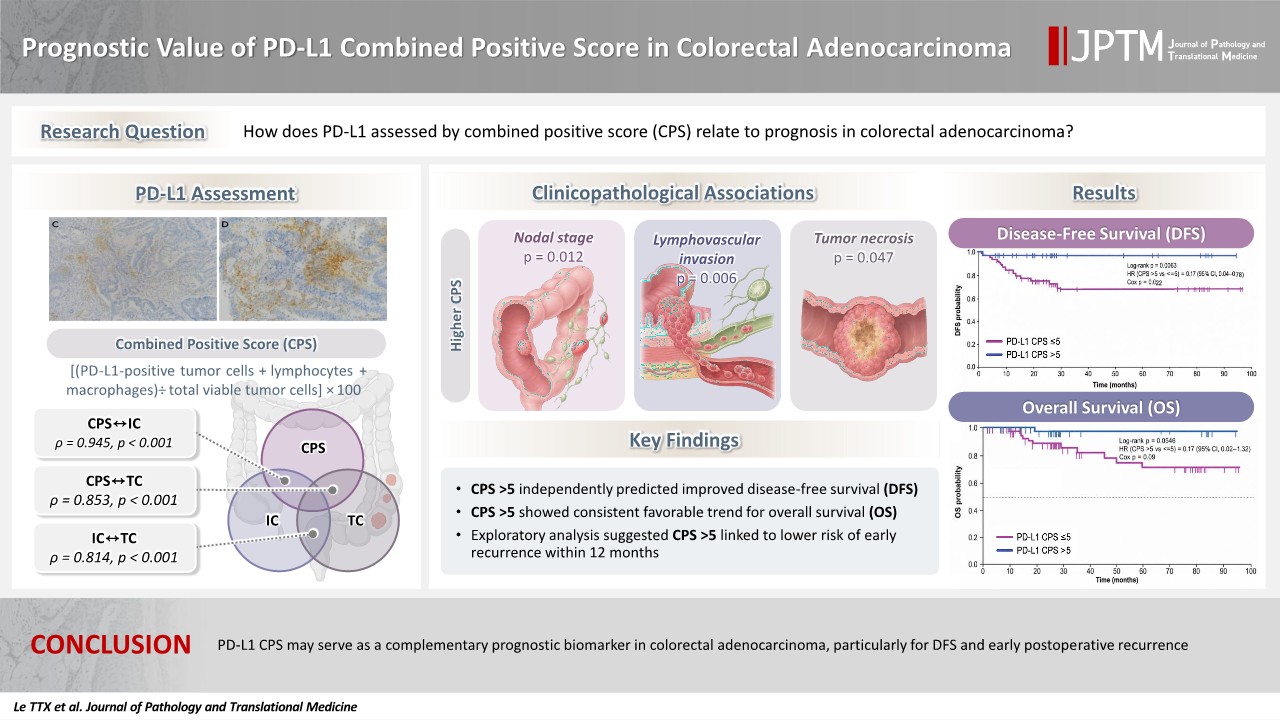
- Higher CPS was significantly associated with nodal stage (p = .012), lymphovascular invasion (p = .006), and tumor necrosis (p = .047). CPS correlated very strongly with immune-cell PD-L1 (rho = 0.945, p < .001) and strongly with tumor-cell PD-L1 (rho = 0.853, p < .001). CPS >5 remained associated with favorable DFS in a prespecified parsimonious multivariable model (adjusted hazard ratio [HR], 0.17; 95% confidence interval [CI], 0.04 to 0.75; p = .019). No PD-L1 metric was significantly associated with OS; however, CPS showed a numerically favorable but non-significant trend (adjusted HR, 0.17; 95% CI, 0.02 to 1.30; p = .088). In the exploratory early recurrence analysis, CPS >5 was associated with a lower risk of early recurrence in a model adjusted only for nodal stage (adjusted HR, 0.21; 95% CI, 0.05 to 0.94; p = .042).
-
Conclusions
- PD-L1 CPS may serve as a complementary, hypothesis-generating prognostic marker in colorectal adenocarcinoma, particularly for disease-free survival. However, the lack of mismatch repair (MMR)/microsatellite instability (MSI) data prevents definitive conclusions regarding an MMR/MSI-independent prognostic effect. Further validation in larger, prospectively collected, multicenter cohorts with comprehensive molecular annotation is required.
- Colorectal adenocarcinoma represents the predominant histological subtype of colorectal cancer (CRC) and remains a major global health burden. In 2020, CRC accounted for approximately 1.9 million new cases and 930,000 deaths worldwide, ranking as the third most commonly diagnosed cancer and one of the leading causes of cancer-related mortality [1,2]. The increasing global impact of CRC, together with the rising burden of early-onset CRC, including shifts in disease distribution and stage patterns, underscores the need for improved biological characterization and risk stratification of colorectal adenocarcinoma [3,4]. Immune checkpoint pathways have received increasing attention as potential biomarkers of tumor behavior and clinical outcome in CRC. Programmed cell death ligand 1 (PD-L1) exists as both a membrane-bound form (mPD-L1) expressed on tumor and immune cells and a soluble form (sPD-L1) detectable in peripheral blood, reflecting complementary aspects of tumor-host immune interactions [5]. In colorectal adenocarcinoma, tumor-cell mPD-L1 expression is relatively uncommon, reported in approximately 9%–16% of unselected cases, but is enriched in microsatellite instability–high (MSI-H) tumors, BRAF-mutant cancers, serrated or medullary histology, and tumors with dense CD8⁺ T-cell infiltration [6]. When immune cells are incorporated into composite scoring systems such as the combined positive score (CPS), the prevalence of PD-L1 positivity increases substantially; for example, Chung et al. [7] reported CPS ≥1 in 53% of high-risk early-stage CRC cases, despite tumor-cell PD-L1 (TC) positivity by tumor proportion score ≥1 in only 5% of tumors.
- The prognostic significance of PD-L1 in colorectal adenocarcinoma remains uncertain and appears to depend strongly on the cellular compartment assessed [6,8]. PD-L1 expression on immune cells has been associated with favorable outcomes, including improved recurrence-free survival (RFS; hazard ratio [HR], 0.35; 95% confidence interval [CI], 0.16 to 0.76; p = .008) and disease-specific survival (HR, 0.28; 95% CI, 0.10 to 0.77; p = .014) in one cohort [9], as well as favorable disease-free survival (DFS) in another cohort (adjusted HR, 0.75; 95% CI, 0.61 to 0.92; p = .006) [10]. In contrast, TC expression has shown inconsistent or inconclusive associations with survival, likely reflecting its low prevalence, heterogeneity in scoring criteria, and the complex balance between immune activation and immune evasion [6,8,11]. These findings suggest that PD-L1 in CRC should be interpreted as a compartment-dependent marker of the tumor immune microenvironment rather than as a single uniform prognostic biomarker.
- Despite increasing interest in PD-L1, several important gaps remain. Existing studies differ substantially in antibody clone, scoring system, cell compartment evaluation, and cutoff threshold, limiting cross-study comparability and hindering translation into routine practice. Moreover, relatively few studies have integrated CPS, immune-cell PD-L1 (IC), TC scoring, detailed histopathological variables, and survival outcomes within the same real-world patient cohort [9,10].
- Data from specific populations, including Vietnamese patients, also remain limited. In CRC, mismatch repair deficiency and MSI-H (dMMR/MSI-H) are already established molecular biomarkers for immune checkpoint inhibitor selection [12]. In this context, the present study was designed to evaluate PD-L1 protein–expression scoring as a pathology-based tissue biomarker, while recognizing that it does not replace molecular stratification. Specifically, we assessed PD-L1 expression using CPS, IC, and TC scoring; examined their correlations and clinicopathological associations; and evaluated their prognostic relevance for DFS, overall survival (OS), and, exploratorily, early recurrence in colorectal adenocarcinoma.
INTRODUCTION
- Study population and specimens
- This was a single-center retrospective cohort study using archival tumor specimens and longitudinal follow-up data from patients with histopathologically confirmed colorectal adenocarcinoma. The study was conducted at the Department of Pathology, 108 Military Central Hospital, Hanoi, Vietnam. A total of 124 patients with histopathologically confirmed colorectal adenocarcinoma were included. Eligible patients were identified from individuals who underwent diagnostic biopsy or surgical resection during the study period and had available formalin-fixed, paraffin-embedded tumor tissue for PD-L1 immunohistochemical assessment, complete clinicopathological records, and follow-up data for survival analysis. Patients with a history of other malignancies, prior neoadjuvant chemotherapy or radiotherapy, or insufficient tumor tissue were excluded.
- Patients with synchronous metastatic disease were eligible for inclusion if they were managed with curative intent after multidisciplinary evaluation. In these cases, curative-intent treatment included systemic therapy, radiotherapy, surgery, or multimodality treatment, as appropriate, followed by post-treatment reassessment using imaging and/or pathological evaluation to confirm eligibility for definitive curative treatment. Archived tumor specimens were used for PD-L1 scoring, and linked clinicopathological and longitudinal follow-up data were retrieved retrospectively from medical records. The study was designed to evaluate the associations of PD-L1–related metrics with clinicopathological characteristics and time-to-event outcomes, including DFS, OS, and early recurrence within 12 months.
- Data collection
- Demographic, clinicopathological, and laboratory data were collected from medical records using standardized data collection forms. Baseline variables were recorded at diagnosis, before initiation of oncologic treatment. Tumor location, tumor size, histological subtype, tumor differentiation, lymphovascular invasion, perineural invasion, tumor necrosis, and pathological stage were retrieved from pathology reports and histopathological review. Hematoxylin and eosin–stained sections and original pathology reports were reviewed by experienced pathologists to confirm the recorded pathological variables. Histological subtype and tumor differentiation were classified according to the 2019 World Health Organization classification of tumors of the digestive system [13], and pathological staging was assigned according to the American Joint Committee on Cancer cancer staging manual, 8th edition [14].
- DFS was defined as the time from completion of curative-intent primary treatment to recurrence or death from any cause. OS was defined as the time from histopathological diagnosis to death from any cause. Patients without an event were censored at the last follow-up. Early recurrence was defined as recurrence within 12 months after completion of curative-intent primary treatment and was evaluated only in patients who underwent surgical resection.
- Immunohistochemistry and PD-L1 scoring
- Formalin-fixed, paraffin-embedded tumor tissues were sectioned at 4–5 µm and evaluated after routine histopathological review. PD-L1 immunohistochemistry (IHC) was performed using the Dako PD-L1 IHC 22C3 pharmDx assay on an automated staining platform according to the manufacturer’s instructions [15]. Representative invasive tumor areas were selected, and necrotic, poorly preserved, or artifactual areas were excluded.
- Membranous PD-L1 staining was assessed in tumor cells and tumor-associated mononuclear inflammatory cells. Viable tumor cells with perceptible partial or complete membranous staining of any intensity were considered positive; cytoplasmic-only staining was excluded. PD-L1–positive lymphocytes and macrophages were counted in the CPS numerator according to assay principles, whereas neutrophils, plasma cells, necrotic cells, and nonspecific staining were excluded. All slides were reviewed independently by two pathologists blinded to survival outcomes, and discrepant cases were resolved by consensus.
- PD-L1 expression was evaluated using the CPS, IC expression, and TC expression. CPS was calculated as the number of PD-L1–positive tumor cells, lymphocytes, and macrophages divided by the total number of viable tumor cells, multiplied by 100 [15,16]. CPS was initially categorized as <1, 1–5, >5–10, and >10. For prognostic analyses, CPS was dichotomized as ≤5 versus >5 using a predefined, literature-supported threshold. This cutoff was not derived from the present cohort using receiver operating characteristic analysis, X-tile, or maximally selected statistics. Rather, it was selected based on prior CRC literature, particularly Chung et al. [7], who applied a CPS threshold of 5 and reported its association with longer RFS in high-risk early-stage CRC. Because no standardized or consensus CPS threshold has been established for colorectal adenocarcinoma, this cutoff was considered exploratory. IC and TC were categorized as <1%, 1%–5%, and >5% according to the predefined scoring scheme used in this study.
- Baseline neutrophil-to-lymphocyte ratio (NLR), platelet-to-lymphocyte ratio (PLR), and monocyte-to-lymphocyte ratio (MLR) were calculated from routine laboratory data and dichotomized at the cohort median (2.70, 156.1, and 0.27, respectively) for subgroup analyses [17-21].
- Statistical analysis
- Statistical analyses were conducted using R version 4.3.2 (R Foundation for Statistical Computing, Vienna, Austria). Categorical variables were compared using the chi-square test or Fisher’s exact test, and continuous variables using Student’s t-test, Mann-Whitney U test, or Kruskal-Wallis test, as appropriate. Correlations among CPS, IC, and TC scores were assessed using Spearman’s rank correlation coefficients.
- Survival curves for DFS and OS were estimated by the Kaplan-Meier method and compared using the log-rank test. Univariable Cox proportional hazards regression was performed first, followed by separate parsimonious multivariable Cox models for CPS, IC, and TC to reduce collinearity. Results are presented as HRs with 95% CIs.
- Exploratory analyses of early recurrence within 12 months after completion of curative-intent primary treatment were restricted to patients who underwent surgical resection. Early recurrence frequencies were compared using Fisher’s exact test, and logistic regression was used to estimate odds ratios (ORs). A truncated Cox proportional hazards model was additionally used to analyze recurrence within 12 months while preserving the time-to-event structure. All tests were two-sided, and p < .05 was considered statistically significant.
MATERIALS AND METHODS
- Baseline characteristics of patients with colorectal adenocarcinoma
- Baseline characteristics of 124 patients with colorectal adenocarcinoma are summarized in Table 1. The median age was 67.5 years (interquartile range [IQR], 57 to 73). Males accounted for 66.1% of the cohort. Tumors were most commonly located in the rectum (41.1%), followed by the left colon (37.1%) and right colon (21.8%). Tumor size ≥5 cm was observed in 42.7% of patients. Most tumors were at advanced local stage, with T3 (41.9%) and T4 (34.7%) predominating. Lymph node metastasis was present in 44.3% of cases (N1–N2), while distant metastasis (M1) was identified in 8.9%. The majority of patients were classified as TNM stage III (54.0%). Most tumors were moderately differentiated (85.5%), with lymphovascular invasion in 24.2%, perineural invasion in 34.7%, and tumor necrosis in 51.6% of cases. The median values of inflammatory indices were 2.70 (IQR, 2.00 to 4.29) for NLR, 156.1 (IQR, 117.0 to 215.5) for PLR, and 0.27 (IQR, 0.20 to 0.40) for MLR.
- Clinicopathological characteristics and association with PD-L1 expression
- Fig. 1 illustrates representative PD-L1 immunohistochemical staining patterns in colorectal adenocarcinoma according to CPS category and by cellular compartment. Across the CPS categories, membranous PD-L1 staining increased from absent or barely detectable expression in CPS <1 tumors to progressively more evident staining in the CPS 1–5 and CPS >5–10 groups, becoming most extensive in tumors with CPS >10. The figure also demonstrates marked compartmental heterogeneity. Low-IC cases showed only scattered PD-L1–positive immune cells, whereas high-IC cases displayed dense stromal and peri-tumoral immune-cell staining. Likewise, low-TC cases showed minimal membranous staining in neoplastic cells, while high-TC cases exhibited more prominent tumor-cell membrane positivity. Taken together, these images visually support the heterogeneity of PD-L1 expression in colorectal adenocarcinoma and illustrate the distinct contributions of immune-cell and tumor-cell staining to the overall CPS assessment.
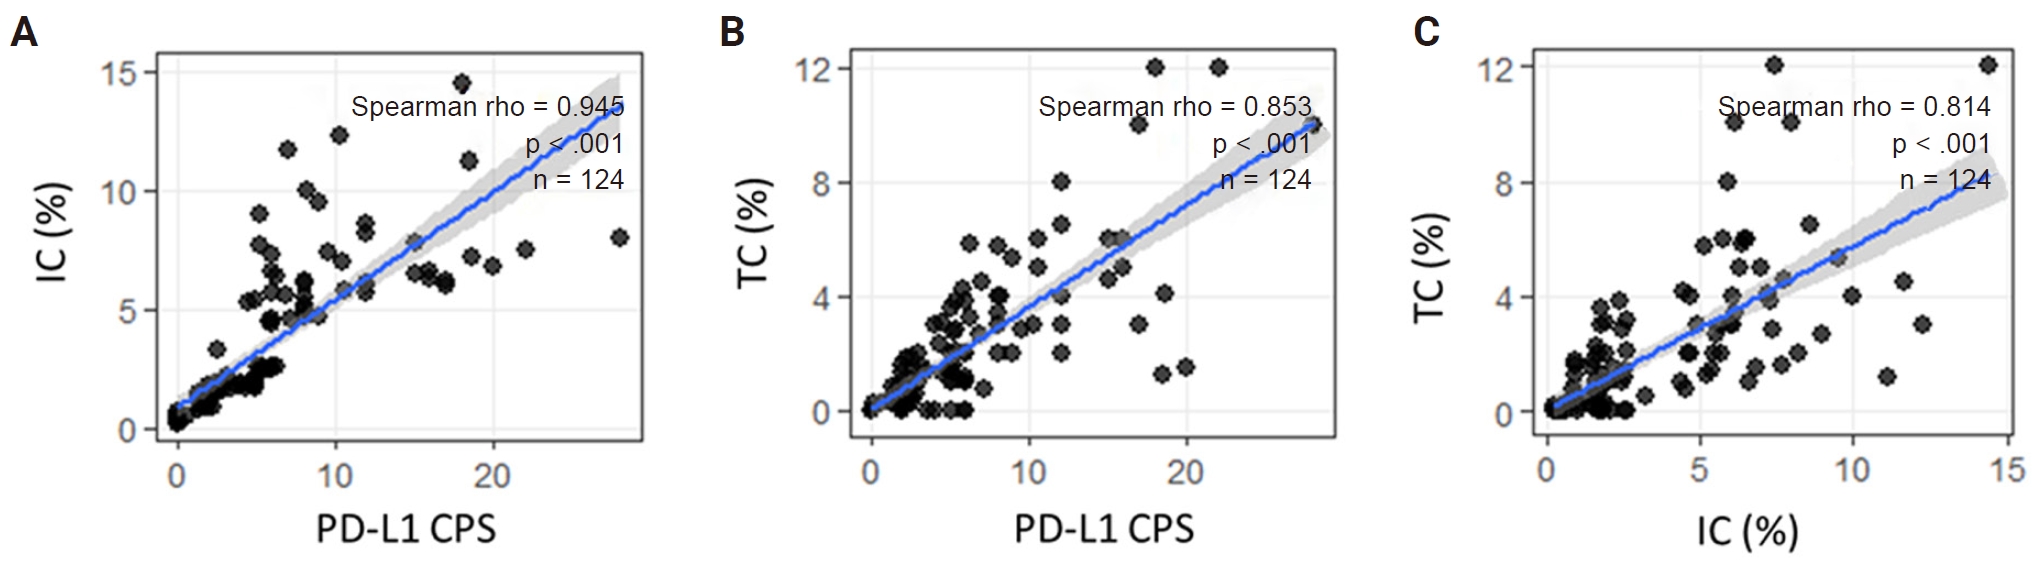
- Fig. 2 demonstrates strong positive correlations among all PD-L1 scoring parameters. CPS was very strongly correlated with IC (rho = 0.945, p < .001) and strongly correlated with TC (rho = 0.853, p < .001), while IC and TC were also strongly correlated (rho = 0.814, p < .001), indicating a high degree of concordance among these metrics and suggesting that CPS more closely reflects the immune-cell component. As shown in Table 2, CPS was significantly associated with nodal stage (p = .012), lymphovascular invasion (p = .006), and tumor necrosis (p = .047), whereas no significant associations were observed for T category, M category, TNM stage, differentiation, or perineural invasion. Significantly increasing trends across CPS categories were observed for lymphovascular invasion (p-trend = .028) and tumor necrosis (p-trend = .009). In Supplementary Table S1, higher IC expression was significantly associated with lymphovascular invasion (p = .028), perineural invasion (p = .039), and tumor necrosis (p = .048), with significant positive trends across IC categories. By contrast, TC expression was significantly associated only with tumor necrosis (p = .039; p-trend = .011), while no significant associations were observed for the remaining clinicopathological variables.
- Association between PD-L1 expression and systemic inflammatory markers
- The median values of NLR, PLR, and MLR were comparable across all PD-L1 expression groups defined by CPS, IC, and TC. For CPS categories, median NLR ranged from 2.48 to 3.72, PLR from 132.71 to 165.20, and MLR from 0.23 to 0.29, with no significant differences between groups (all p > .05) and no significant trends observed. Similarly, across IC expression groups, median NLR ranged from 2.55 to 3.03, PLR from 150.56 to 164.81, and MLR from 0.25 to 0.28, with no statistically significant differences or trends. For TC expression, median NLR ranged from 2.67 to 3.11, PLR from 147.71 to 158.08, and MLR from 0.24 to 0.28, also without significant differences or trends across groups (all p > .05). Overall, no significant associations were observed between PD-L1 expression levels and systemic inflammatory markers (Supplementary Table S2).
- DFS and OS rates at 12, 36, and 60 months
- All 124 patients were included in the DFS and OS analyses because all had completed curative-intent primary treatment, including selected patients with synchronous metastatic disease who were managed with curative intent after post-treatment reassessment. By contrast, the exploratory analysis of early recurrence was restricted to 121 patients who underwent surgical resection.
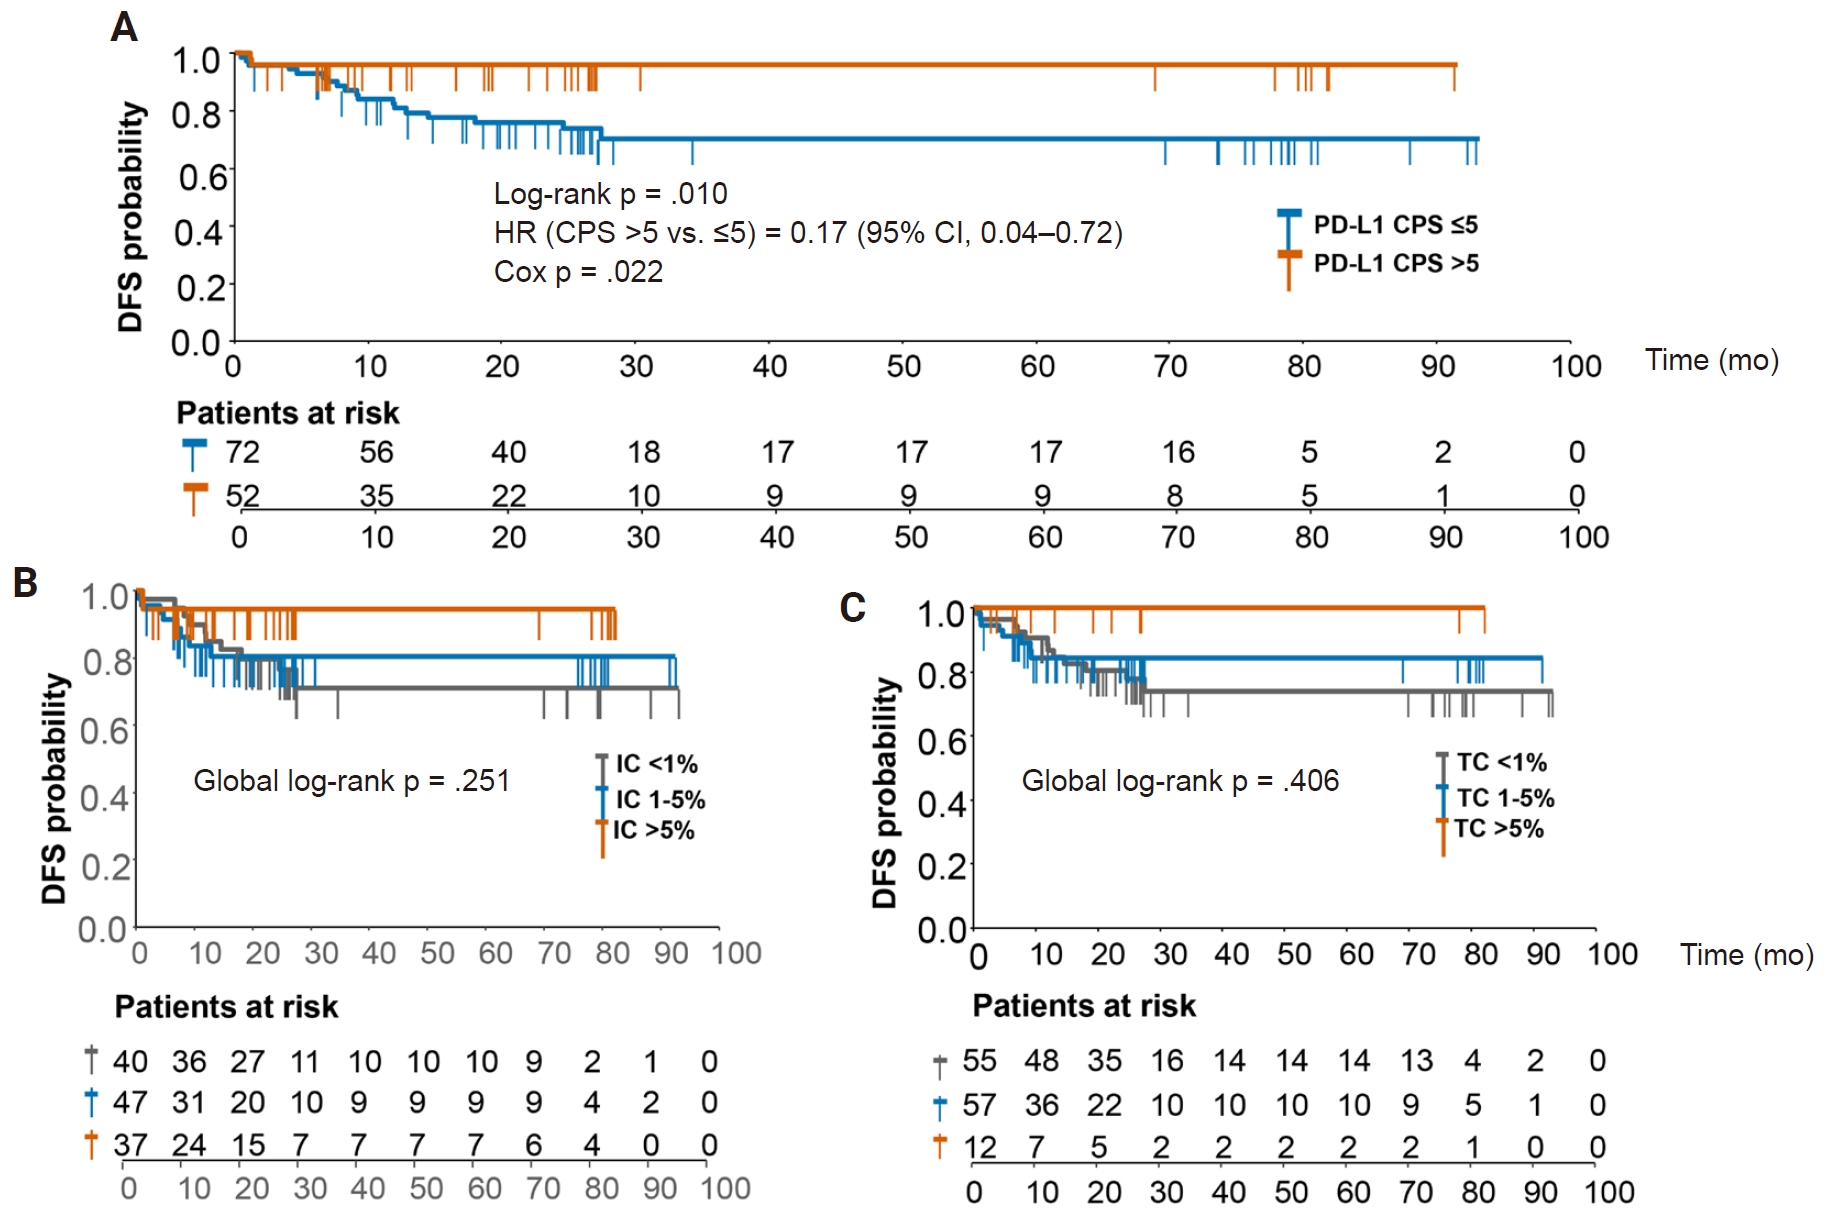
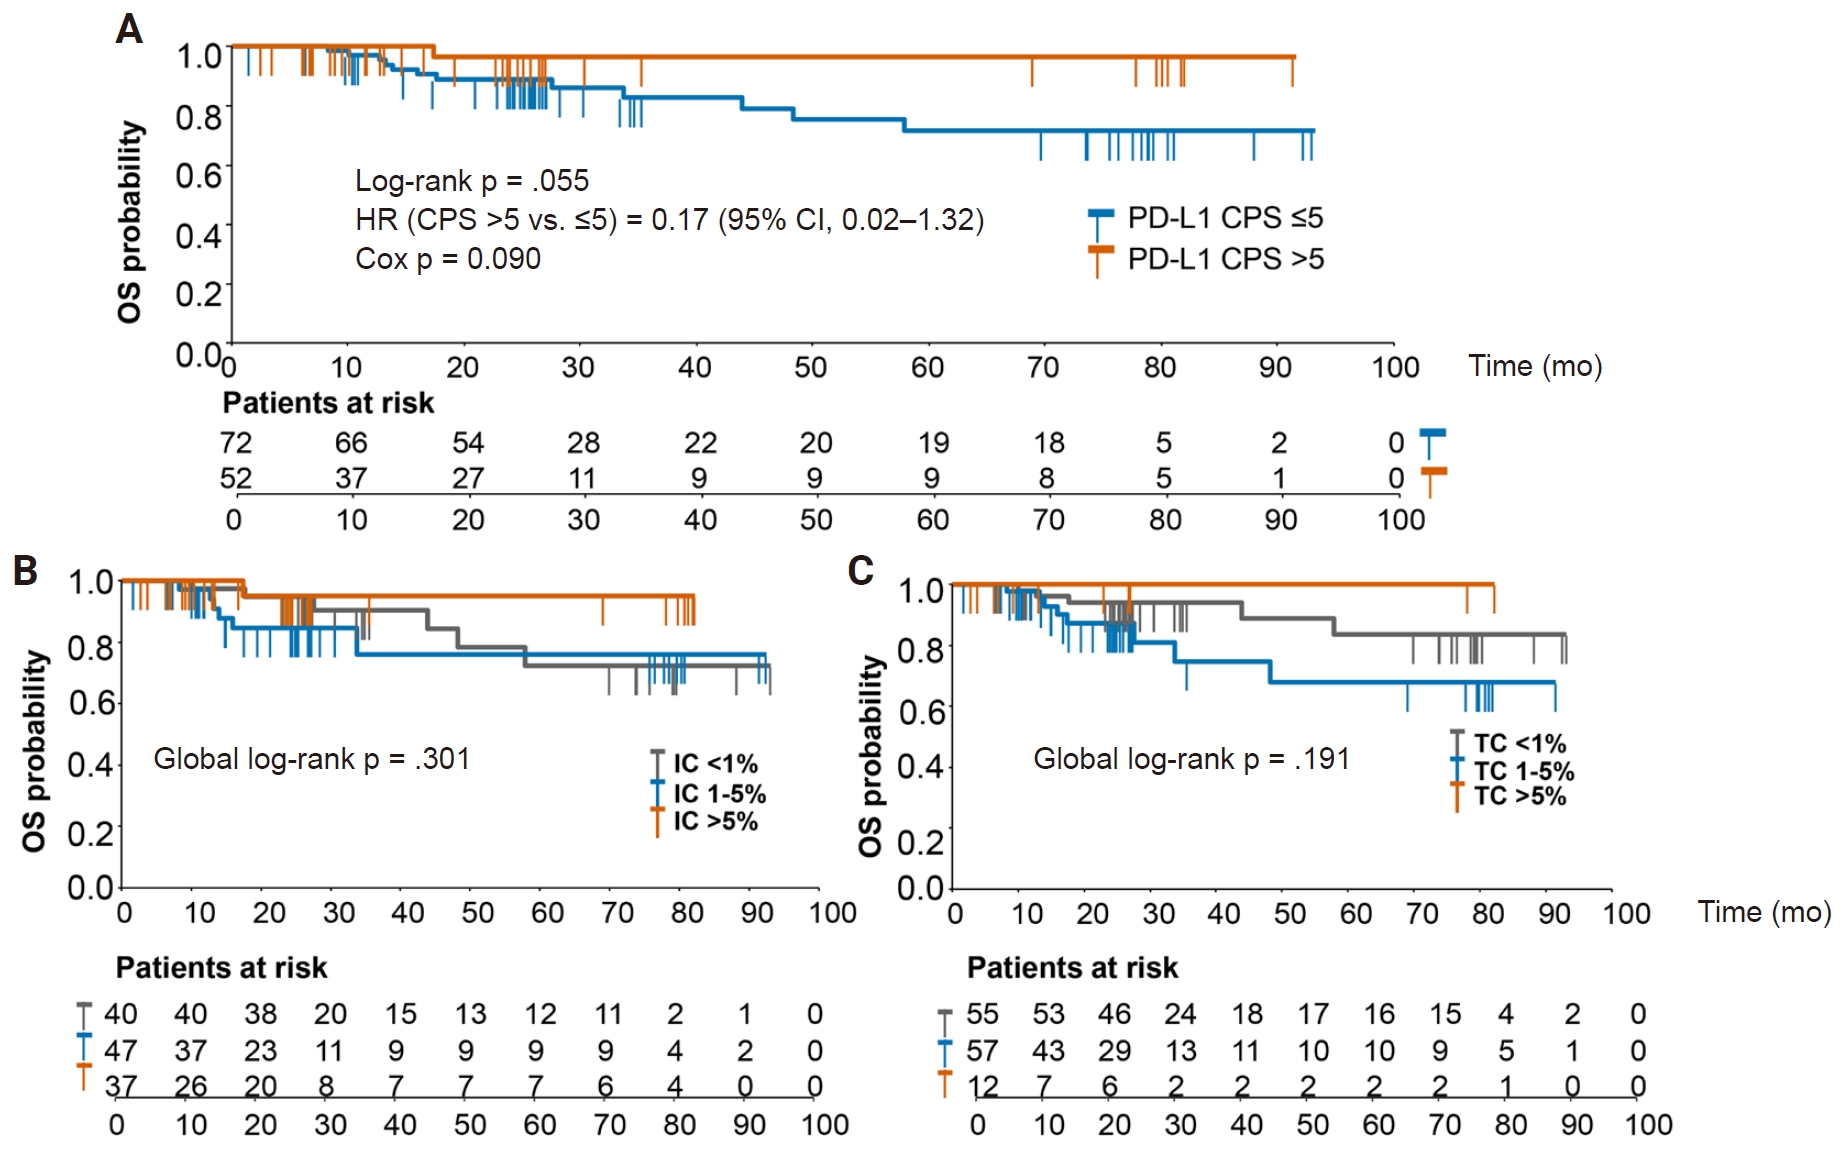
- As shown in Table 3, the Kaplan-Meier–estimated DFS rates for the overall cohort were 87.5% at 12 months and 81.5% at both 36 and 60 months. Patients with CPS >5 had consistently more favorable DFS than those with CPS ≤5, with rates of 96.2% versus 81.8% at 12 months and 96.2% versus 73.2% at both 36 and 60 months (p = .010). In contrast, no statistically significant differences in DFS were observed across IC or TC categories, although numerically higher survival estimates were seen in the highest IC and TC subgroups. Table 3 also summarizes OS according to PD-L1 expression metrics. In the overall cohort, OS rates were 98.1% at 12 months, 87.0% at 36 months, and 78.6% at 60 months. Patients with CPS >5 likewise showed consistently higher OS than those with CPS ≤5 at all evaluated time points (100.0% vs. 97.0% at 12 months, 96.6% vs. 82.9% at 36 months, and 96.6% vs. 71.6% at 60 months), although this difference did not reach conventional statistical significance (p = .055). No significant differences in OS were observed across IC or TC categories.
- Univariate and multivariable Cox regression analysis for DFS and OS
- The prognostic associations of PD-L1 expression metrics with DFS and OS are summarized in Table 4 and Supplementary Table S3, and the corresponding Kaplan-Meier curves are shown in Figs. 3 and 4. In univariable Cox analysis (Supplementary Table S3), CPS >5 was the only variable significantly associated with DFS, corresponding to a markedly reduced hazard of recurrence or death (HR, 0.18; 95% CI, 0.04 to 0.78; p = .022). This finding was consistent with the clear separation of DFS curves by CPS in Fig. 3. By contrast, neither IC nor TC categories were significantly associated with DFS, and no other clinicopathological variable—including lymphovascular invasion (LVI), perineural invasion (PNI), TNM stage, sex, age, tumor location, differentiation, or distant metastasis—reached statistical significance. For OS, no variable was statistically significant in univariable analysis; however, CPS >5 showed a numerically consistent protective trend (HR, 0.17; 95% CI, 0.02 to 1.32; p = .090), in keeping with the more favorable but less clearly separated OS curves in Fig. 4A. IC and TC were not associated with OS in univariable models.
- To reduce collinearity among PD-L1–related variables, three separate parsimonious multivariable Cox models were constructed for each endpoint (Table 4), each including a single PD-L1 metric along with prespecified clinicopathological covariates. For DFS, CPS >5 remained associated with a lower hazard of recurrence or death after adjustment in the prespecified parsimonious model 1 (adjusted HR, 0.17; 95% CI, 0.04 to 0.75; p = .019) (Table 4), consistent with the univariable finding and the survival difference observed in Fig. 3A. In contrast, IC and TC were not significantly associated with DFS after adjustment in models 2 and 3, respectively, despite a numerically favorable estimate for the highest IC category. For OS, no PD-L1 metric was statistically significant in the multivariable analyses. CPS >5 showed a numerically favorable but statistically non-significant trend in model 1 (adjusted HR, 0.17; 95% CI, 0.02 to 1.30; p = .088), mirroring the direction of effect observed in both the univariable model and the Kaplan-Meier curves in Fig. 4A. This OS finding should therefore be interpreted descriptively because the number of OS events was limited. In these parsimonious models, neither collapsed TNM stage, LVI, nor PNI was significantly associated with DFS or OS.
- Taken together, these findings indicate that, among the PD-L1–related biomarkers evaluated, CPS was the only marker significantly associated with DFS in the prespecified parsimonious models, while also showing a consistent favorable trend for OS. By comparison, IC and TC were not significantly associated with survival outcomes in this cohort.
- Time-to-event analysis of early recurrence according to CPS
- To further examine the postoperative relevance of CPS, we performed an exploratory analysis of early recurrence, defined as recurrence within 12 months after completion of curative-intent primary treatment. Of the 124 patients in the original cohort, three who did not undergo surgery were excluded, leaving 121 evaluable patients. Early recurrence occurred in 14 patients, late recurrence in four, and 103 remained recurrence-free during follow-up. Early recurrence was more frequent in patients with CPS ≤5 than in those with CPS >5 (17.4% [12/69] vs. 3.8% [2/52]; Fisher’s exact p = .023) (Table 5), corresponding to an OR of 5.26 (95% CI, 1.12 to 24.66).
- In univariable logistic regression, CPS >5 was associated with lower odds of early recurrence (OR, 0.19; 95% CI, 0.04 to 0.89; p = .035), and this association remained significant after adjustment for nodal stage (adjusted OR, 0.17; 95% CI, 0.04 to 0.83; p = .028). To preserve the time-to-event structure, we additionally performed a 12-month truncated Cox analysis, in which follow-up was defined as the minimum of DFS time and 12 months, with events restricted to recurrences within that interval. In this exploratory model, CPS >5 showed a lower hazard of early recurrence in univariable analysis (HR, 0.23; 95% CI, 0.05 to 1.02; p = .053) (Table 5) and was associated with a lower hazard of early recurrence after adjustment only for nodal stage (adjusted HR, 0.21; 95% CI, 0.05 to 0.94; p = .042). The estimated 12-month RFS was 81.8% for CPS ≤5 and 96.2% for CPS >5.
- Because only 14 early recurrence events were observed, adjustment was restricted to the nodal stage to reduce overfitting. Overall, these findings suggest that lower CPS may be associated with a higher risk of recurrence during the first postoperative year; however, this exploratory result should be interpreted as hypothesis-generating rather than confirmatory.
RESULTS
- The present study suggests that, among three complementary PD-L1 scoring approaches evaluated in a real-world cohort of colorectal adenocarcinoma, CPS was the PD-L1–related biomarker most consistently associated with DFS and early recurrence. This association was observed in the context of a predominant immune-cell contribution to CPS, no clear association between tissue PD-L1 expression and systemic inflammatory indices, and important limitations, including missing mismatch repair (MMR)/microsatellite instability (MSI) status, limited outcome events, and assay standardization. Therefore, the findings should be interpreted as hypothesis-generating rather than confirmatory.
- The predominance of the immune-cell component in CPS is biologically plausible in CRC. Tumor-cell PD-L1 expression is relatively uncommon in unselected colorectal adenocarcinoma, whereas PD-L1 expression on tumor-associated immune cells may be induced through adaptive immune resistance driven by CD8⁺ T-cell activation and interferon-γ/JAK/STAT signaling [6,22,23]. Multiplex immunofluorescence studies further support that PD-L1 in CRC is frequently expressed in stromal or immune-cell compartments, including macrophage-rich areas at the invasive margin [24]. Thus, CPS may capture a broader immune-reactive phenotype than TC alone.
- The different clinicopathological associations of CPS, IC, and TC also suggest that these metrics reflect partially distinct biological dimensions of colorectal adenocarcinoma. In our cohort, CPS and IC were more closely linked to features of the tumor-host interface, whereas TC expression appeared less consistently associated with clinicopathological variables. This interpretation is consistent with prior studies showing that compartment-based PD-L1 scoring in CRC captures information not fully represented by tumor-cell-only assessment [7,25]. Although tumor necrosis was associated with PD-L1 expression across metrics, detailed mechanistic interpretation should be cautious, as standard CPS-based IHC cannot resolve the specific cellular sources and spatial organization of PD-L1–positive immune cells [24,26,27].
- The favorable DFS association observed for CPS >5 contrasts with earlier meta-analytic evidence, largely based on TC assessment, in which high TC expression was associated with poorer OS in CRC [28]. This discrepancy may be explained by differences in compartmentalization. In the present cohort, CPS was predominantly immune-cell driven; therefore, higher CPS may reflect an immune-inflamed tumor microenvironment rather than simple immune evasion. This interpretation is supported by Chung et al. [7], who used a CPS threshold of 5 in high-risk early-stage CRC and reported that CPS ≥5 was associated with enriched CD8⁺ tumor-infiltrating lymphocyte density, elevated C-X-C motif chemokine ligand 9 expression, and longer RFS. Similarly, Watson et al. [9] and Kuo et al. [10] reported favorable prognostic associations for PD-L1–positive immune-cell compartments in nonmetastatic CRC.
- In contrast, IC and TC did not show the same prognostic consistency in our cohort. This may reflect the statistical behavior of composite versus component scores in a modest-sized dataset, as CPS integrates both TC and IC signals into a single metric. Nobin et al. [29] also demonstrated that the prognostic value of PD-L1 in resected CRC varies by antibody clone, cellular compartment, and cohort characteristics. Therefore, the apparent advantage of CPS should not be overinterpreted as definitive biological superiority, but rather as a potentially useful composite signal requiring validation.
- The divergence in prognostic value between DFS and OS in our study is also clinically coherent. DFS directly reflects recurrence biology and the suppression of residual micrometastatic disease by an active immune microenvironment. Conversely, OS is heavily influenced by downstream variables, including post-recurrence systemic therapies and competing mortality. In our cohort, while CPS >5 showed a numerically favorable OS trend, this did not reach statistical significance and remains purely descriptive due to the sparse number of OS events. Similarly, the association between CPS and early recurrence is clinically interesting but exploratory. Although CPS >5 was associated with lower early recurrence risk in a model adjusted only for nodal stage, only 14 early recurrence events were observed. This result should therefore be considered hypothesis-generating rather than confirmatory.
- Crucially, complete MMR and MSI data were unavailable in this retrospective cohort, and this is the most important constraint on interpretation. CRCs with dMMR/MSI-H status harbor high frameshift-derived neoantigen load, dense tumor-infiltrating lymphocytes, and active CD8⁺ T-cell responses [6,11]. These features provide the same immunological substrate that may drive IC upregulation through adaptive immune resistance [8,11]. Accordingly, the favorable CPS-DFS association observed in this cohort may partly reflect enrichment of dMMR/MSI-H tumors in the CPS >5 group, rather than an MMR/MSI-independent effect of PD-L1 expression.
- The magnitude of that potential confounding is nonetheless bounded by the available colorectal data, which are not uniform. CPS ≥5 was associated with dMMR/MSI-H in the cohort of Chung et al. [7] (p = .024), and CPS positivity was higher in dMMR than proficient mismatch repair (pMMR) tumors in one series (100% vs. 37%) [30], whereas two other colorectal series using CPS found no association with MMR protein status [25,31]. More directly, in pT3 and pT4 colon cancer, CPS ≥1 remained independently associated with longer OS within the pMMR subgroup (adjusted HR, 0.24; 95% CI, 0.06 to 0.99) [32], indicating that a CPS-associated prognostic signal can persist where dMMR has been excluded. These data make complete confounding unlikely but cannot exclude partial confounding here. Concurrent MMR/MSI testing, the established molecular biomarker for immune checkpoint inhibitor selection in CRC [12], is the single most informative addition to any validation study.
- Beyond biological confounders, the translational implementation of PD-L1 CPS in CRC faces significant technical hurdles regarding assay standardization. Manual CPS scoring is vulnerable to pre-analytical, analytical, and interobserver variability. Flanders et al. [33] demonstrated substantial differences in CPS ≥5 detection between routine clinical care and a clinical-trial dataset in gastroesophageal adenocarcinoma, illustrating the broader vulnerability of CPS-based assessment to technical and scoring variation. More directly in CRC, Nobin et al. [29] showed that the prognostic performance of PD-L1 varies according to antibody clone and cellular compartment. In the present study, PD-L1 assessment was performed using the Dako 22C3 pharmDx assay on an automated platform with independent dual-pathologist review and consensus resolution. This approach may reduce but cannot eliminate scoring variability, particularly because PD-L1 results may vary by antibody clone, scoring method, and cellular compartment assessed [27,29]. Furthermore, standard CPS-based IHC does not distinguish PD-L1–positive lymphocytes from PD-L1–positive macrophages, which may have different biological and prognostic implications [24]. Future studies should therefore incorporate standardized analytical conditions, formal interobserver reproducibility assessment, digital or multiplex-assisted quantification, and concurrent molecular annotation, including MMR/MSI status, to establish the clinical robustness of CPS in colorectal adenocarcinoma.
- Several limitations should be considered when interpreting these findings. First, the retrospective, single-center design and absence of external validation limit causal inference and generalizability. Second, the modest cohort size and limited number of outcome events, with 18 recurrences overall, including 14 within the first 12 months, reduced statistical power and produced wide CIs and potentially unstable adjusted estimates. Although deliberately parsimonious models were used to mitigate overfitting, they cannot fully compensate for sparse events; therefore, the OS findings should be regarded as descriptive, and the early recurrence analysis as exploratory and hypothesis-generating. Third, the absence of MMR/MSI status, CD8⁺ tumor-infiltrating lymphocyte density, and consensus molecular subtype prevented comprehensive molecular adjustment and limits mechanistic interpretation of the CPS-outcome association. Finally, interobserver reproducibility was not formally quantified, and variability related to antibody clones, scoring procedures, and positivity thresholds may restrict cross-study comparability. These findings therefore require validation in larger, prospective, multicenter cohorts incorporating standardized PD-L1 assessment, formal reproducibility analysis, and comprehensive molecular profiling.
- In colorectal adenocarcinoma, a PD-L1 CPS driven predominantly by the immune-cell compartment identified patients with more favorable DFS and a lower risk of recurrence within the first postoperative year. Because the effect estimates are imprecise and unadjusted for MMR/MSI status, CPS should be regarded at present as a complementary, hypothesis-generating prognostic marker. Validation will require larger, prospectively assembled, multicenter cohorts with concurrent MMR/MSI testing, CD8⁺ tumor-infiltrating lymphocyte quantification, consensus molecular subtyping, and formal assessment of scoring reproducibility.
DISCUSSION
Supplementary Information
Ethics Statement
This study was conducted in accordance with the ethical principles for biomedical research involving human subjects. The research protocol was reviewed and approved by the Scientific and Ethics Committees of 108 Military Central Hospital and the Institutional Review Board of Hanoi Medical University (IRB-VN01.001/IRB00003121/FWA 00004148). Written informed consent was obtained from all participants prior to enrollment. Patient confidentiality was strictly maintained throughout the study.
Availability of Data and Material
The data presented in this study are included in the article and its supplementary materials. Further inquiries can be directed to the corresponding author.
Code Availability
Not applicable.
Author Contributions
Conceptualization: XHN, TTXL. Data curation: TTXL, MSL. Formal analysis: XHN, TTXL. Investigation: TTXL, TMHN, MSL, THL. Methodology: TTXL, TMHN, MSL. Supervision: XHN, HSL. Writing—original draft: TTXL, XHN. Writing—review and editing: HSL, VCN. Approval of final manuscript: all authors.
Conflicts of Interest
The authors declare that they have no potential conflicts of interest.
Funding Statement
No funding to declare.
Acknowledgments
The authors would like to thank all study participants for their participation.

Values are presented as number (%). p-values were derived from comparisons across CPS categories using the chi-square test or Fisher’s exact test, as appropriate. p for trend was calculated across ordered CPS categories when applicable. CPS was categorized as <1, 1–5, >5–10, and >10. All tests were two-sided.
CPS, combined positive score.
Three separate parsimonious models were constructed for each endpoint to avoid collinearity among CPS, IC, and TC. Each model included one PD-L1 metric and a limited set of prespecified clinicopathological covariates: collapsed TNM stage (I–II vs. III–IV), lymphovascular invasion, and perineural invasion. All p-values are two-sided.
HR, hazard ratio; CI, confidence interval; CPS, combined positive score; LVI, lymphovascular invasion; PNI, perineural invasion; IC, immune-cell PD-L1; TC, tumor-cell PD-L1; PD-L1, programmed cell death ligand 1.
| Analysis | Result | Effect estimate (95% CI) | p-value |
|---|---|---|---|
| Study population for early recurrence analysis | |||
| Total evaluable patients | 121 | - | - |
| Early recurrence (≤12 mo) | 14 | - | - |
| Late recurrence (>12 mo) | 4 | - | - |
| No recurrence during follow-up | 103 | - | - |
| Early recurrence frequency by CPS | |||
| CPS ≤5 | 12/69 (17.4%) | Reference | - |
| CPS >5 | 2/52 (3.8%) | - | - |
| Binary comparison | |||
| CPS ≤5 vs. CPS >5 | - | OR 5.26 (1.12–24.66) | .023a |
| Logistic regression | |||
| CPS >5 vs. ≤5 (univariate) | - | OR 0.19 (0.04–0.89) | .035 |
| CPS >5 vs. ≤5 (adjusted for N category) | - | aOR 0.17 (0.04–0.83) | .028 |
| 12-Month truncated Cox model | |||
| CPS >5 vs. ≤5 (univariate) | - | HR 0.23 (0.05–1.02) | .053 |
| CPS >5 vs. ≤5 (adjusted for N category) | - | aHR 0.21 (0.05–0.94) | .042 |
| Estimated 12-month recurrence-free survival | |||
| CPS ≤5 | 81.8% | - | - |
| CPS >5 | 96.2% | - | - |
Early recurrence was defined as recurrence within 12 months after completion of curative-intent primary treatment. Comparator group for binary early recurrence analysis included patients with late recurrence (>12 months) or no recurrence during follow-up.
CPS, combined positive score; CI, confidence interval; OR, odds ratio; aOR, adjusted odds ratio; HR, hazard ratio; aHR, adjusted hazard ratio.
aFisher’s exact test.
- 1. Morgan E, Arnold M, Gini A, et al. Global burden of colorectal cancer in 2020 and 2040: incidence and mortality estimates from GLOBOCAN. Gut 2023; 72: 338-44. ArticlePubMed
- 2. Nejadghaderi SA, Roshani S, Mohammadi E, et al. The global, regional, and national burden and quality of care index (QCI) of colorectal cancer: a global burden of disease systematic analysis 1990-2019. PLoS One 2022; 17: e0263403. ArticlePubMedPMC
- 3. Meng Y, Tan Z, Zhen J, et al. Global, regional, and national burden of early-onset colorectal cancer from 1990 to 2021: a systematic analysis based on the global burden of disease study 2021. BMC Med 2025; 23: 34.ArticlePubMedPMCPDF
- 4. Zhang J, Ou D, Xie A, Chen D, Li X. Global burden and cross-country health inequalities of early-onset colorectal cancer and its risk factors from 1990 to 2021 and its projection until 2036. BMC Public Health 2024; 24: 3124.ArticlePubMedPMCPDF
- 5. Lin X, Kang K, Chen P, et al. Regulatory mechanisms of PD-1/PD-L1 in cancers. Mol Cancer 2024; 23: 108.ArticlePubMedPMCPDF
- 6. Rosenbaum MW, Bledsoe JR, Morales-Oyarvide V, Huynh TG, Mino-Kenudson M. PD-L1 expression in colorectal cancer is associated with microsatellite instability, BRAF mutation, medullary morphology and cytotoxic tumor-infiltrating lymphocytes. Mod Pathol 2016; 29: 1104-12. ArticlePubMedPDF
- 7. Chung BS, Liao IC, Lin PC, et al. PD-L1 expression in high-risk early-stage colorectal cancer: its clinical and biological significance in immune microenvironment. Int J Mol Sci 2022; 23: 13277.ArticlePubMedPMC
- 8. Lee LH, Cavalcanti MS, Segal NH, et al. Patterns and prognostic relevance of PD-1 and PD-L1 expression in colorectal carcinoma. Mod Pathol 2016; 29: 1433-42. ArticlePubMedPMCPDF
- 9. Watson MM, Lea D, Gudlaugsson E, Skaland I, Hagland HR, Soreide K. Prevalence of PD-L1 expression is associated with EMAST, density of peritumoral T-cells and recurrence-free survival in operable non-metastatic colorectal cancer. Cancer Immunol Immunother 2020; 69: 1627-37. ArticlePubMedPMCPDF
- 10. Kuo YT, Liao CK, Chen TC, Lai CC, Chiang SF, Chiang JM. A high density of PD-L1-expressing immune cells is significantly correlated with favorable disease free survival in nonmetastatic colorectal cancer. Medicine (Baltimore) 2022; 101: e28573. ArticlePubMedPMC
- 11. Kim JH, Park HE, Cho NY, Lee HS, Kang GH. Characterisation of PD-L1-positive subsets of microsatellite-unstable colorectal cancers. Br J Cancer 2016; 115: 490-6. ArticlePubMedPMCPDF
- 12. Bartley AN, Mills AM, Konnick E, et al. Mismatch repair and microsatellite instability testing for immune checkpoint inhibitor therapy: guideline from the College of American Pathologists in collaboration with the Association for Molecular Pathology and Fight Colorectal Cancer. Arch Pathol Lab Med 2022; 146: 1194-210. ArticlePubMedPDF
- 13. Nagtegaal ID, Odze RD, Klimstra D, et al. The 2019 WHO classification of tumours of the digestive system. Histopathology 2020; 76: 182-8. ArticlePubMedPMCPDF
- 14. Amin MB, Greene FL, Edge SB, et al. The eighth edition AJCC cancer staging manual: continuing to build a bridge from a population-based to a more "personalized" approach to cancer staging. CA Cancer J Clin 2017; 67: 93-9. ArticlePubMed
- 15. Agilent Technologies (Dako). PD-L1 IHC 22C3 pharmDx: instructions for use. Code SK006. Santa Clara: Agilent Technologies, 2021.
- 16. Kulangara K, Zhang N, Corigliano E, et al. Clinical utility of the combined positive score for programmed death ligand-1 expression and the approval of pembrolizumab for treatment of gastric cancer. Arch Pathol Lab Med 2019; 143: 330-7. ArticlePubMedPDF
- 17. Naszai M, Kurjan A, Maughan TS. The prognostic utility of pre-treatment neutrophil-to-lymphocyte-ratio (NLR) in colorectal cancer: a systematic review and meta-analysis. Cancer Med 2021; 10: 5983-97. ArticlePubMedPMCPDF
- 18. Kim JH, Lee JY, Kim HK, et al. Prognostic significance of the neutrophil-to-lymphocyte ratio and platelet-to-lymphocyte ratio in patients with stage III and IV colorectal cancer. World J Gastroenterol 2017; 23: 505-15. ArticlePubMedPMC
- 19. Wang H, Ding Y, Li N, et al. Prognostic value of neutrophil-lymphocyte ratio, platelet-lymphocyte ratio, and combined neutrophil-lymphocyte ratio and platelet-lymphocyte ratio in stage IV advanced gastric cancer. Front Oncol 2020; 10: 841.ArticlePubMedPMC
- 20. Basile D, Garattini SK, Corvaja C, et al. The MIMIC study: prognostic role and cutoff definition of monocyte-to-lymphocyte ratio and lactate dehydrogenase levels in metastatic colorectal cancer. Oncologist 2020; 25: 661-8. ArticlePubMedPMCPDF
- 21. Lisanti C, Basile D, Garattini SK, et al. The SAFFO study: sex-related prognostic role and cut-off definition of monocyte-to-lymphocyte ratio (MLR) in metastatic colorectal cancer. Cancers (Basel) 2023; 15: 175.ArticlePubMedPMC
- 22. Zhao T, Li Y, Zhang J, Zhang B. PD-L1 expression increased by IFN-gamma via JAK2-STAT1 signaling and predicts a poor survival in colorectal cancer. Oncol Lett 2020; 20: 1127-34. ArticlePubMedPMC
- 23. Sudoyo AW, Kurniawan AN, Kusumo GD, et al. Increased CD8 tumor infiltrating lymphocytes in colorectal cancer microenvironment supports an adaptive immune resistance mechanism of PD-L1 expression. Asian Pac J Cancer Prev 2019; 20: 3421-7. ArticlePubMedPMC
- 24. Wu Q, Tissot S, Peddle A, et al. Myeloid-derived PD-L1 characterizes spatially organized immune architecture in colorectal cancer. Front Immunol 2026; 17: 1763068.ArticlePubMedPMC
- 25. Awad HA, Sughayer MA, Obeid JM, et al. PD-L1 expression in colorectal carcinoma: a comparison of 3 scoring methods in a cohort of Jordanian patients. Appl Immunohistochem Mol Morphol 2023; 31: 379-89. ArticlePubMed
- 26. Kastinen M, Sirnio P, Elomaa H, et al. Immunological and prognostic significance of tumour necrosis in colorectal cancer. Br J Cancer 2023; 128: 2218-26. ArticlePubMedPMCPDF
- 27. Francina M, Mikus M, Mamic M, et al. Evaluation of PD-L1 expression in colorectal carcinomas by comparing scoring methods and their significance in relation to clinicopathologic parameters. Diagnostics (Basel) 2024; 14: 1007.ArticlePubMedPMC
- 28. Li Y, He M, Zhou Y, et al. The prognostic and clinicopathological roles of PD-L1 expression in colorectal cancer: a systematic review and meta-analysis. Front Pharmacol 2019; 10: 139.ArticlePubMedPMC
- 29. Nobin H, Garvin S, Hagman H, Nodin B, Jirstrom K, Brunnstrom H. The prognostic value of programmed death-ligand 1 (PD-L1) expression in resected colorectal cancer without neoadjuvant therapy: differences between antibody clones and cell types. BMC Cancer 2024; 24: 1051.ArticlePubMedPMCPDF
- 30. Al-Jussani GN, Alsughayer A, Yousuf MS, Mullahuwash Y, Dabbagh T, Sughayer MA. The clinicopathological features of programmed death ligand-1 expression in colorectal carcinoma. Int J Biol Markers 2022; 37: 322-7. ArticlePubMedPDF
- 31. Gao Y, Sun Z, Gu J, et al. Cancer-associated fibroblasts promote the upregulation of PD-L1 expression through Akt phosphorylation in colorectal cancer. Front Oncol 2021; 11: 748465.ArticlePubMedPMC
- 32. Jepsen DN, Jensen MB, Bennedsen AL, et al. Prognostic value of manual and digital PD-L1 expression in pT3 and pT4 colon cancer. Diagn Pathol 2025; 20: 135.ArticlePubMedPMCPDF
- 33. Flanders L, Savy T, Ficial M, et al. PD-L1 CPS in gastroesophageal cancer: differences in routine care versus Checkmate 649 and implications for biopsy-site choice and assay standardisation. Br J Cancer 2026; 135: 232-9. ArticlePubMedPMCPDF
REFERENCES
Figure & Data
References
Citations

 PubReader
 ePub Link
-
 Cite this Article
- Cite this Article
-
- Close
- Download Citation
- Close
 XML Download
- Figure
-

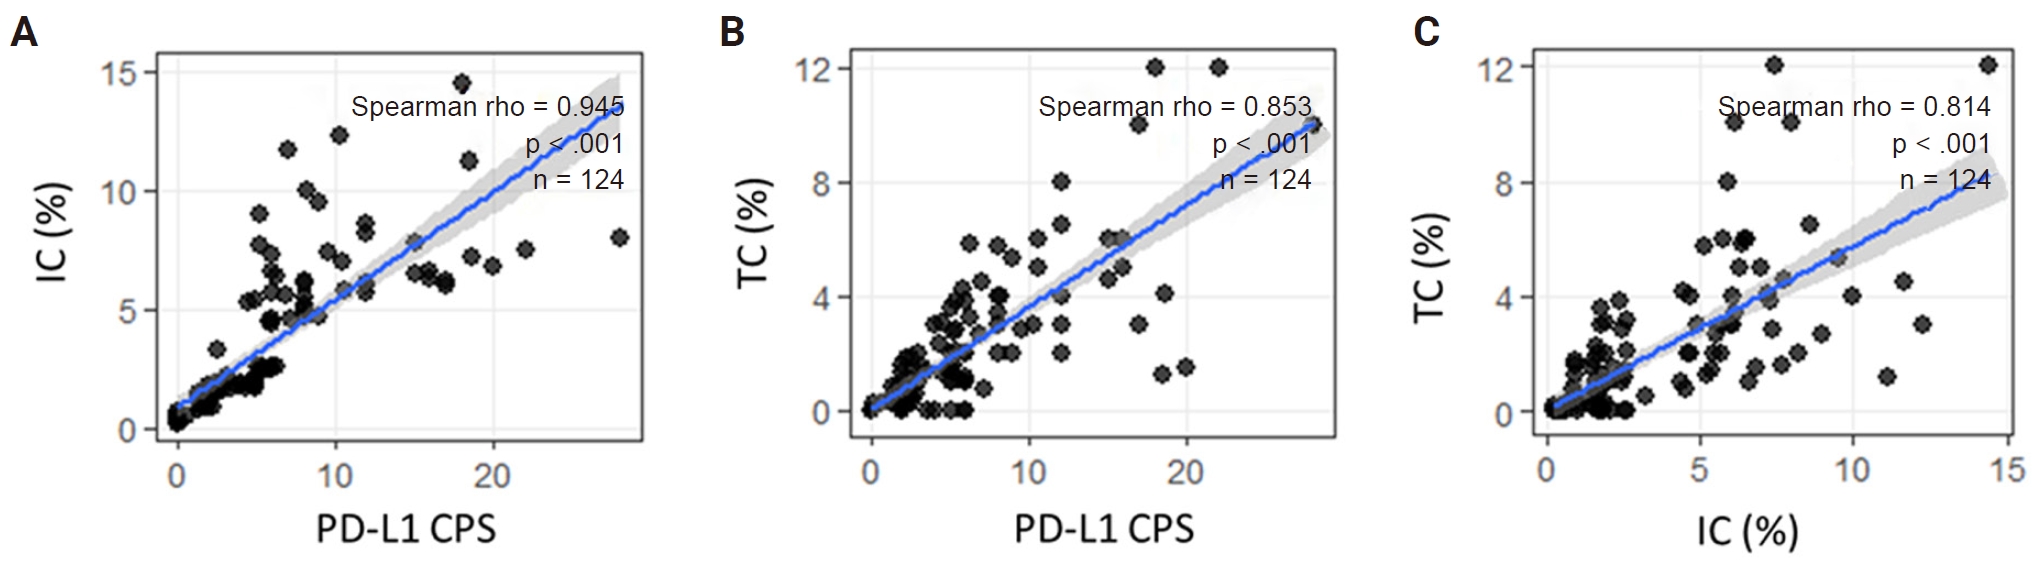
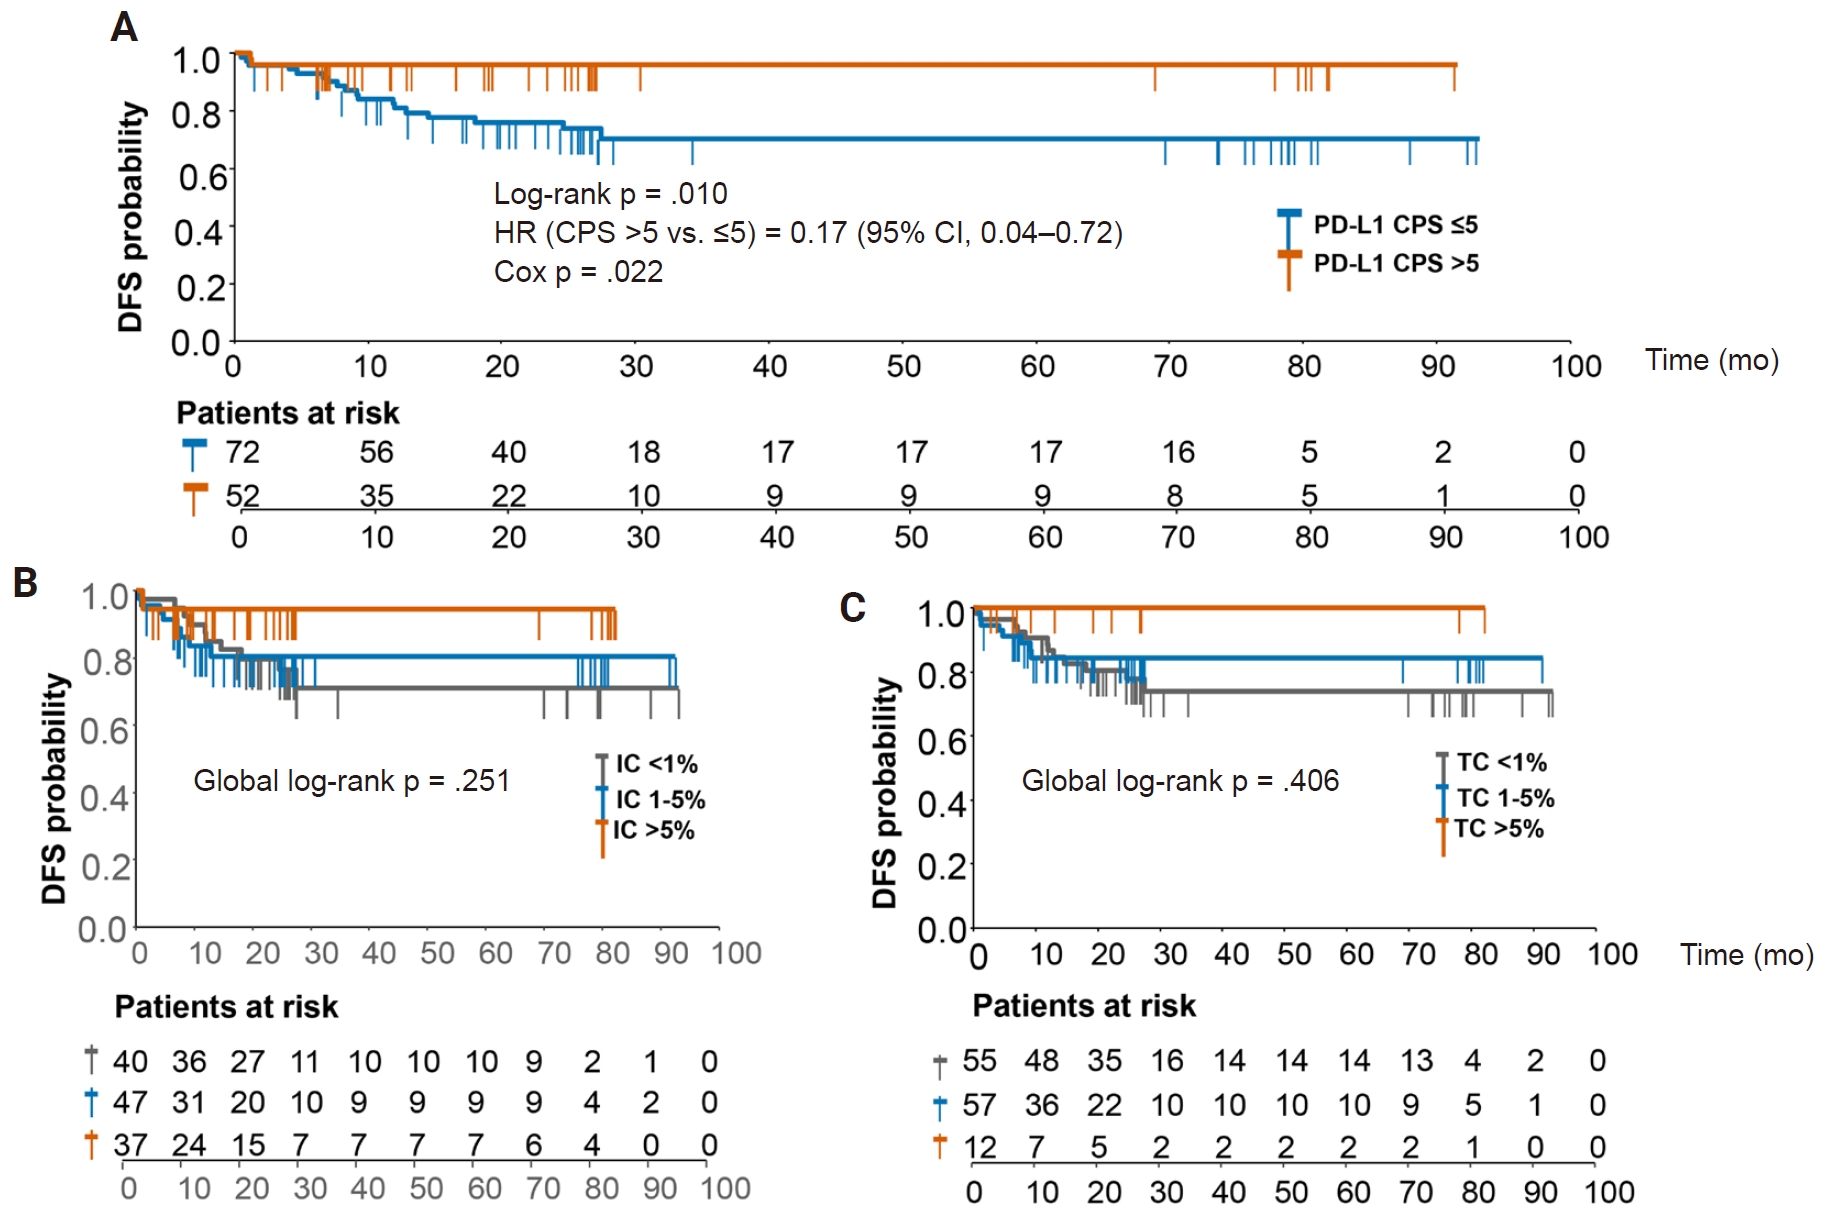
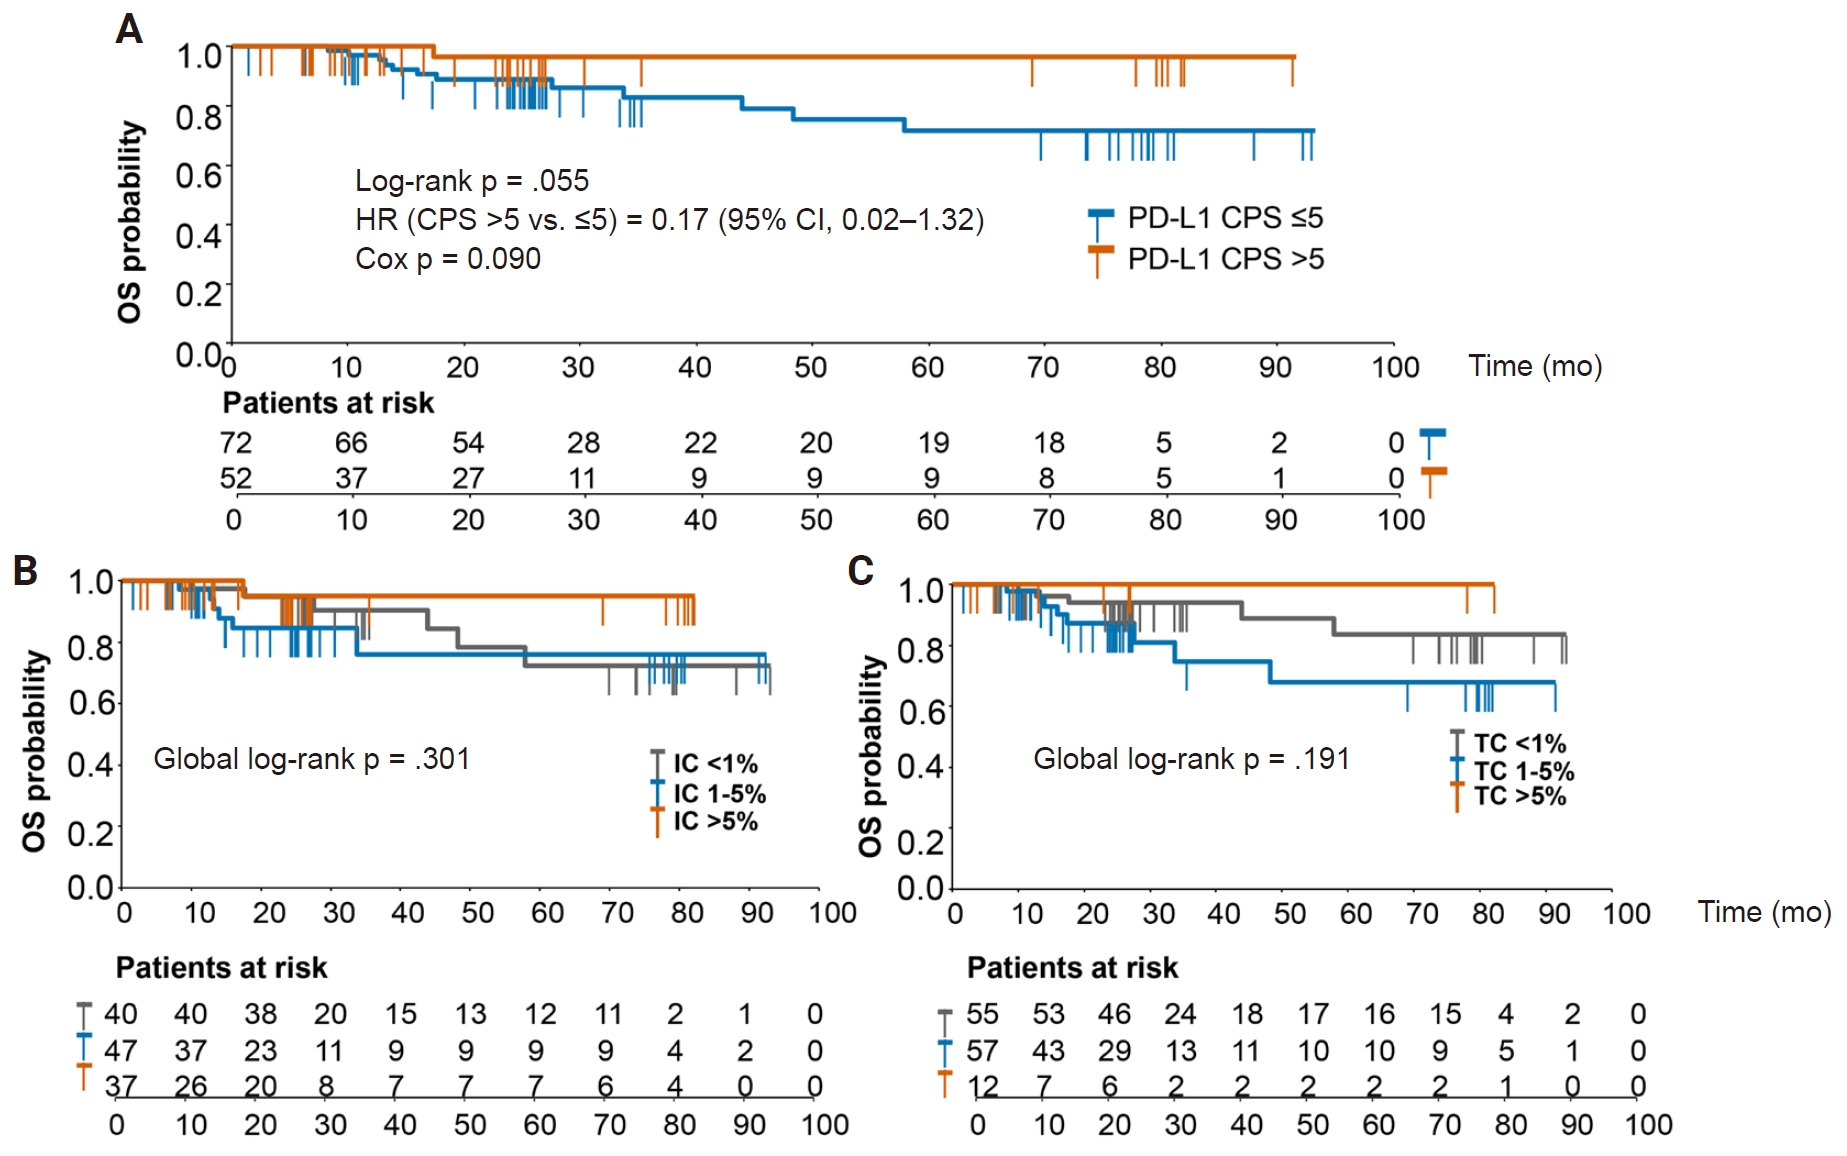
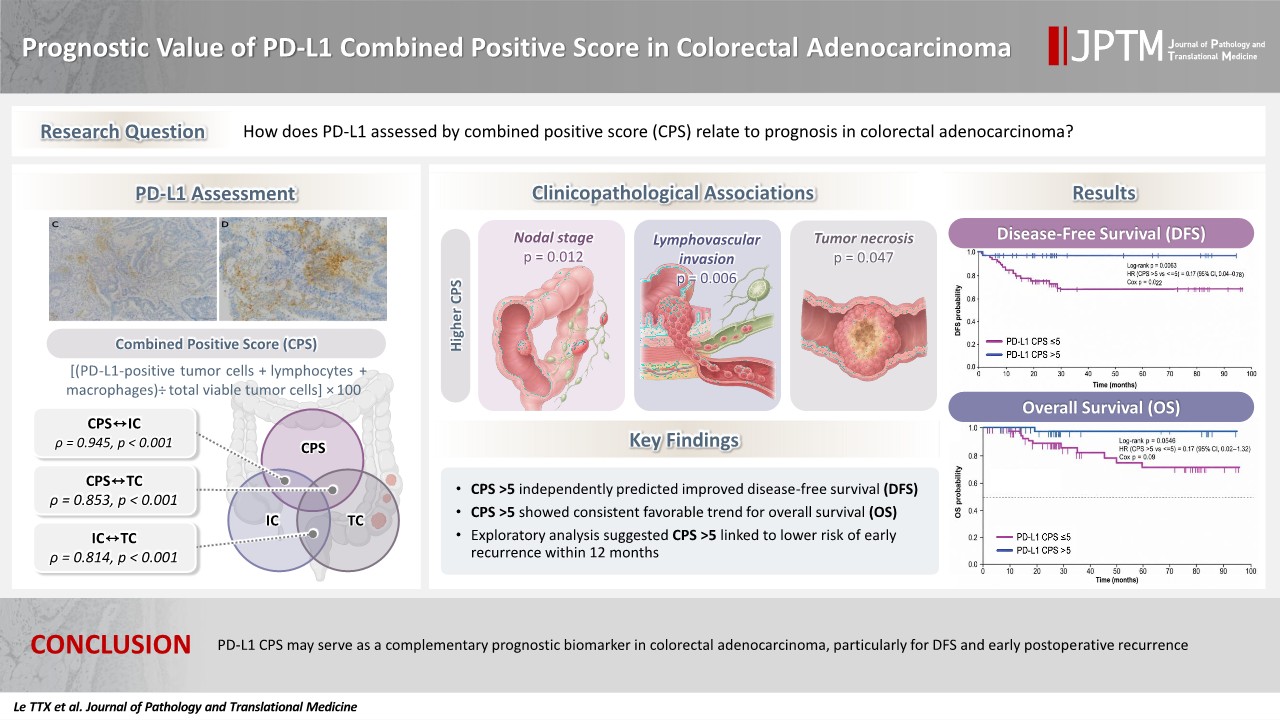

Fig. 1.
Fig. 2.
Fig. 3.
Fig. 4.
Graphical abstract
| Variable | Value |
|---|---|
| Age (yr) | 67.5 (57–73) |
| Age group (yr) | |
| ≤60 | 40 (32.3) |
| >60 | 84 (67.7) |
| Sex | |
| Male | 82 (66.1) |
| Female | 42 (33.9) |
| Tumor location | |
| Left colon | 46 (37.1) |
| Right colon | 27 (21.8) |
| Rectum | 51 (41.1) |
| Tumor size (cm) | |
| ≥5 | 53 (42.7) |
| <5 | 71 (57.3) |
| T category | |
| T1 | 12 (9.7) |
| T2 | 17 (13.7) |
| T3 | 52 (41.9) |
| T4 | 43 (34.7) |
| N category | |
| N0 | 69 (55.7) |
| N1 | 32 (25.8) |
| N2 | 23 (18.5) |
| M category | |
| M0 | 113 (91.1) |
| M1 | 11 (8.9) |
| TNM stage | |
| I | 22 (17.7) |
| II | 24 (19.4) |
| III | 67 (54.0) |
| IV | 11 (8.9) |
| Tumor differentiation | |
| Well differentiated | 9 (7.3) |
| Moderately differentiated | 106 (85.5) |
| Poorly differentiated | 9 (7.3) |
| Lymphovascular invasion | |
| Present | 30 (24.2) |
| Absent | 94 (75.8) |
| Perineural invasion | |
| Present | 43 (34.7) |
| Absent | 81 (65.3) |
| Tumor necrosis | |
| Present | 64 (51.6) |
| Absent | 60 (48.4) |
| NLR | 2.70 (2.00–4.29) |
| PLR | 156.1 (117.0–215.5) |
| MLR | 0.27 (0.20–0.40) |
| Variable | CPS < 1 (n = 29) | CPS 1–5 (n = 43) | CPS > 5–10 (n = 32) | CPS > 10 (n = 20) | p-value | p-trend |
|---|---|---|---|---|---|---|
| T category | ||||||
| 1–2 | 4 (13.8) | 11 (25.6) | 8 (25.0) | 6 (30.0) | .586 | .374 |
| 3–4 | 25 (86.2) | 32 (74.4) | 24 (75.0) | 14 (70.0) | ||
| N category | ||||||
| 0 | 16 (55.2) | 22 (51.2) | 17 (53.1) | 14 (70.0) | .012 | .862 |
| 1–2 | 13 (44.8) | 21 (48.8) | 15 (46.9) | 6 (30.0) | ||
| M category | ||||||
| M0 | 26 (89.7) | 39 (90.7) | 29 (90.6) | 19 (95.0) | .926 | - |
| M1 | 3 (10.3) | 4 (9.3) | 3 (9.4) | 1 (5.0) | ||
| TNM stage | ||||||
| I–II | 9 (31.0) | 14 (32.6) | 12 (37.5) | 11 (55.0) | .310 | .098 |
| III–IV | 20 (69.0) | 29 (67.4) | 20 (62.5) | 9 (45.0) | ||
| Differentiation | ||||||
| Well/moderate | 28 (96.6) | 41 (95.3) | 28 (87.5) | 18 (90.0) | .521 | .642 |
| Poor | 1 (3.4) | 2 (4.7) | 4 (12.5) | 2 (10.0) | ||
| Lymphovascular invasion | ||||||
| Yes | 0 | 15 (34.9) | 9 (28.1) | 6 (30.0) | .006 | .028 |
| No | 29 (100) | 28 (65.1) | 23 (71.9) | 14 (70.0) | ||
| Perineural invasion | ||||||
| Yes | 6 (20.7) | 14 (32.6) | 12 (37.5) | 11 (55.0) | .096 | - |
| No | 23 (79.3) | 29 (67.4) | 20 (62.5) | 9 (45.0) | ||
| Tumor necrosis | ||||||
| Yes | 9 (31.0) | 23 (53.5) | 18 (56.3) | 14 (70.0) | .047 | .009 |
| No | 20 (69.0) | 20 (46.5) | 14 (43.7) | 6 (30.0) |
| Variable | Disease-free survival | Overall survival | ||||||
|---|---|---|---|---|---|---|---|---|
| 12 months | 36 months | 60 months | p-value | 12 months | 36 months | 60 months | p-value | |
| Total | 87.5 | 81.5 | 81.5 | - | 98.1 | 87.0 | 78.6 | - |
| CPS | ||||||||
| ≤5 | 81.8 | 73.2 | 73.2 | .010 | 97.0 | 82.9 | 71.6 | .055 |
| >5 | 96.2 | 96.2 | 96.2 | 100.0 | 96.6 | 96.6 | ||
| IC (%) | ||||||||
| <1 | 86.8 | 75.6 | 75.6 | .251 | 97.5 | 90.5 | 72.4 | .301 |
| 1–5 | 83.4 | 80.2 | 80.2 | 97.4 | 76.1 | 76.1 | ||
| >5 | 94.6 | 94.6 | 94.6 | 100.0 | 95.2 | 95.2 | ||
| TC (%) | ||||||||
| <1 | 88.3 | 77.6 | 77.6 | .406 | 98.1 | 94.0 | 83.6 | .191 |
| 1–5 | 84.3 | 84.3 | 84.3 | 97.9 | 74.8 | 68.0 | ||
| >5 | 100.0 | 100.0 | 100.0 | 100.0 | 100.0 | 100.0 | ||
| Model | Disease-free survival | Overall survival | ||
|---|---|---|---|---|
| Adjusted HR (95% CI) | p-value | Adjusted HR (95% CI) | p-value | |
| Model 1 | ||||
| CPS (>5 vs. ≤5) | 0.17 (0.04–0.75) | .019 | 0.17 (0.02–1.30) | .088 |
| TNM stage (III–IV vs. I–II) | 0.69 (0.25–1.95) | .489 | 0.77 (0.24–2.51) | .664 |
| LVI (yes vs. no) | 1.87 (0.56–6.23) | .311 | 1.18 (0.31–4.54) | .809 |
| PNI (yes vs. no) | 0.73 (0.22–2.41) | .610 | 1.03 (0.23–4.04) | .958 |
| Model 2 | ||||
| IC (1%–5% vs. <1%) | 0.92 (0.34–2.53) | .873 | 1.41 (0.43–4.60) | .567 |
| IC (>5% vs. <1%) | 0.28 (0.06–1.37) | .115 | 0.30 (0.03–2.69) | .280 |
| TNM stage (III–IV vs. I–II) | 0.79 (0.29–2.19) | .653 | 0.82 (0.26–2.58) | .730 |
| LVI (yes vs. no) | 1.89 (0.59–6.05) | .286 | 1.22 (0.30–4.88) | .781 |
| PNI (yes vs. no) | 0.74 (0.24–2.29) | .603 | 0.95 (0.27–3.38) | .938 |
| Model 3 | ||||
| TC (1%–5% vs. <1%) | 0.90 (0.34–2.29) | .826 | 2.34 (0.78–7.63) | .131 |
| TC (>5% vs. <1%) | 0.24 (0.00–1.90) | .218 | 0.81 (0.01–7.33) | .881 |
| TNM stage (III–IV vs. I–II) | 0.81 (0.30–2.27) | .680 | 0.82 (0.27–2.70) | .733 |
| LVI (yes vs. no) | 1.83 (0.56–5.41) | .304 | 0.86 (0.20–3.06) | .827 |
| PNI (yes vs. no) | 0.67 (0.21–1.96) | .475 | 0.65 (0.18–2.11) | .478 |
| Analysis | Result | Effect estimate (95% CI) | p-value |
|---|---|---|---|
| Study population for early recurrence analysis | |||
| Total evaluable patients | 121 | - | - |
| Early recurrence (≤12 mo) | 14 | - | - |
| Late recurrence (>12 mo) | 4 | - | - |
| No recurrence during follow-up | 103 | - | - |
| Early recurrence frequency by CPS | |||
| CPS ≤5 | 12/69 (17.4%) | Reference | - |
| CPS >5 | 2/52 (3.8%) | - | - |
| Binary comparison | |||
| CPS ≤5 vs. CPS >5 | - | OR 5.26 (1.12–24.66) | .023 |
| Logistic regression | |||
| CPS >5 vs. ≤5 (univariate) | - | OR 0.19 (0.04–0.89) | .035 |
| CPS >5 vs. ≤5 (adjusted for N category) | - | aOR 0.17 (0.04–0.83) | .028 |
| 12-Month truncated Cox model | |||
| CPS >5 vs. ≤5 (univariate) | - | HR 0.23 (0.05–1.02) | .053 |
| CPS >5 vs. ≤5 (adjusted for N category) | - | aHR 0.21 (0.05–0.94) | .042 |
| Estimated 12-month recurrence-free survival | |||
| CPS ≤5 | 81.8% | - | - |
| CPS >5 | 96.2% | - | - |
Values are presented as median (IQR) or number (%). NLR, neutrophil-to-lymphocyte ratio; PLR, platelet-to-lymphocyte ratio; MLR, monocyte-to-lymphocyte ratio; IQR, interquartile range.
Values are presented as number (%). p-values were derived from comparisons across CPS categories using the chi-square test or Fisher’s exact test, as appropriate. p for trend was calculated across ordered CPS categories when applicable. CPS was categorized as <1, 1–5, >5–10, and >10. All tests were two-sided. CPS, combined positive score.
Survival rates were estimated using the Kaplan-Meier method. p-values refer to log-rank tests comparing survival distributions between subgroups. CPS, combined positive score; IC, immune-cell PD-L1 expression; TC, tumor-cell PD-L1 expression; PD-L1, programmed cell death ligand 1.
Three separate parsimonious models were constructed for each endpoint to avoid collinearity among CPS, IC, and TC. Each model included one PD-L1 metric and a limited set of prespecified clinicopathological covariates: collapsed TNM stage (I–II vs. III–IV), lymphovascular invasion, and perineural invasion. All p-values are two-sided. HR, hazard ratio; CI, confidence interval; CPS, combined positive score; LVI, lymphovascular invasion; PNI, perineural invasion; IC, immune-cell PD-L1; TC, tumor-cell PD-L1; PD-L1, programmed cell death ligand 1.
Early recurrence was defined as recurrence within 12 months after completion of curative-intent primary treatment. Comparator group for binary early recurrence analysis included patients with late recurrence (>12 months) or no recurrence during follow-up. CPS, combined positive score; CI, confidence interval; OR, odds ratio; aOR, adjusted odds ratio; HR, hazard ratio; aHR, adjusted hazard ratio. Fisher’s exact test.


