
 E-submission

Articles
- Page Path
- HOME > J Pathol Transl Med > Volume 60(6); 2026 > Article
-
Original Article
Clinicopathological associations and prognostic significance of EZH2, H3K27me3, pRB, p53, and p16 expression in diffuse large B-cell lymphoma -
Ishan Gupta1
 , Surabhi Jain2, Moien Rasheed Lone3, Ajay Gogia4, Chandan Krushna Das5, Mehar Chand Sharma2, Ashish Datt Upadhyay6, Saumyaranjan Mallick2
-
Journal of Pathology and Translational Medicine 2026;60(6):635-645.
DOI: https://doi.org/10.4132/jptm.2026.09.14
Published online: November 13, 2026
1All India Institute of Medical Sciences, New Delhi, India
2Department of Pathology, All India Institute of Medical Sciences, New Delhi, India
3David Geffen School of Medicine, University of California, Los Angeles, Los Angeles, CA, USA
4Department of Medical Oncology, Dr. B.R. Ambedkar Institute Rotary Cancer Hospital (BRAIRCH), All India Institute of Medical Sciences, New Delhi, India
5Department of Internal Medicine, Boston Medical Center, Boston University, Boston, MA, USA
6Clinical Research Unit, All India Institute of Medical Sciences, New Delhi, India
- Corresponding Author: Saumyaranjan Mallick, MD Department of Pathology, All India Institute of Medical Sciences, Ansari Nagar, New Delhi 110029, India Tel: +91-9013957818, Fax: +91-11-2658-8663, E-mail: drsmallickaiims@gmail.com
© The Korean Society of Pathologists/The Korean Society for Cytopathology
This is an Open Access article distributed under the terms of the Creative Commons Attribution Non-Commercial License (https://creativecommons.org/licenses/by-nc/4.0) which permits unrestricted non-commercial use, distribution, and reproduction in any medium, provided the original work is properly cited.
- 34 Views
- 1 Download


Abstract
-
Background
- Diffuse large B-cell lymphoma (DLBCL) is characterized by pronounced heterogeneity in its morphological and biological attributes, with emerging evidence highlighting the pivotal role of epigenomic alterations in its pathogenesis. This study aimed to investigate the relationship between EZH2 expression and cell-cycle regulatory proteins, focusing on their prognostic implications.
-
Methods
- This retrospective study included 131 patients with nodal primary DLBCL, who were categorized according to the Hans algorithm and additional immunohistochemistry was performed for selected epigenetic (EZH2 and H3K27me3) and cell-cycle regulatory markers (phosphorylated retinoblastoma [pRB], p16 and p53). Receiver operating characteristic (ROC) curve analysis and Cox regression models were applied to assess prognostic utility. Appropriate statistical analysis was performed.
-
Results
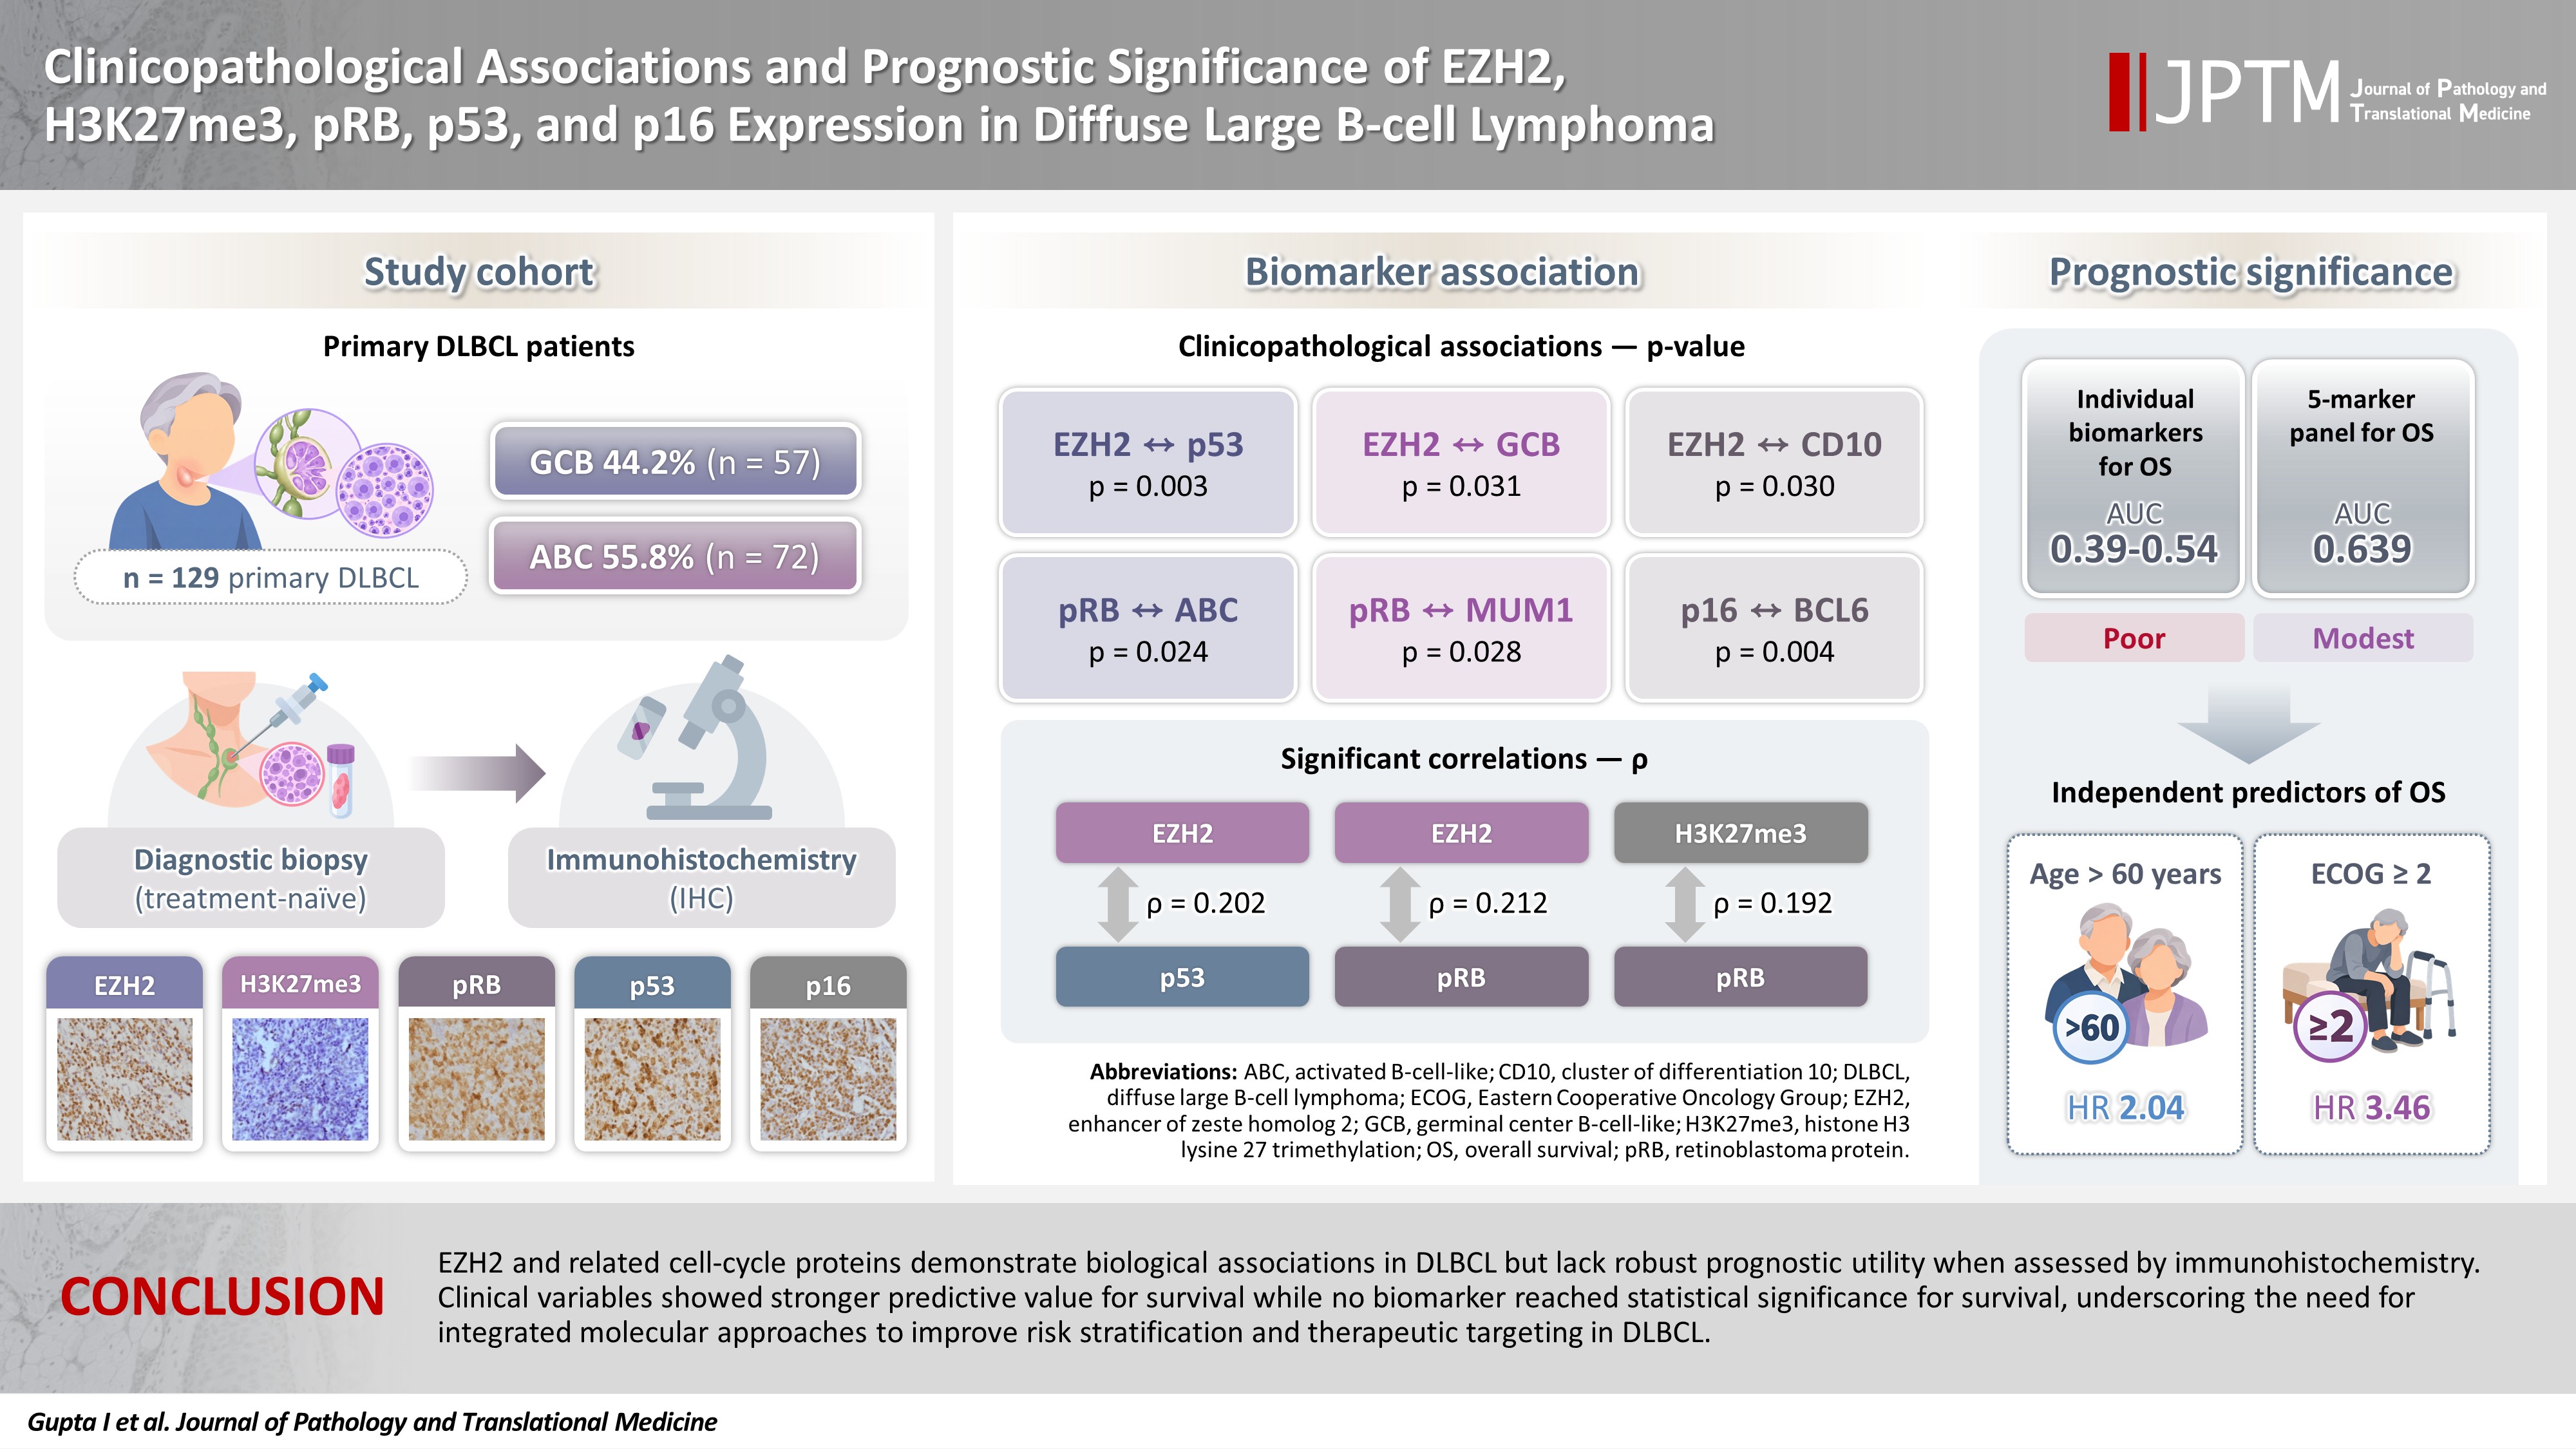
- EZH2 was expressed in 59.5% of cases and significantly associated with p53 (p = .003), germinal center B-cell-like (GCB) subtype (p = .031), and CD10 positivity (p = .030). pRB positivity was more frequent in the activated B-cell-like subtype (82.5% vs. 64.3%, p = .024) and was associated with MUM1 (p = .028), while p16 expression was linked to BCL6 (p = .004). ROC analyses demonstrated poor discriminatory ability for overall survival (area under the curve, 0.39 to 0.54), with no clinically actionable cutoffs identified. Stepwise Cox regression identified age >60 years (hazard ratio [HR], 2.04; p = .042) and Eastern Cooperative Oncology Group ≥ 2 (HR, 3.46; p = .001) as independent predictors of overall survival. For progression-free survival, no biomarker reached statistical significance.
-
Conclusions
- EZH2 and related cell-cycle proteins demonstrate biological associations in DLBCL but lack robust prognostic utility when assessed by immunohistochemistry. Clinical variables showed stronger predictive value for survival, while no biomarker reached statistical significance for survival, underscoring the need for integrated molecular approaches to improve risk stratification and therapeutic targeting in DLBCL.
- Among non-Hodgkin lymphoma subtypes, diffuse large B-cell lymphoma (DLBCL), not otherwise specified (NOS) is the most common worldwide, comprising approximately one-third of all cases [1]. It exhibits marked heterogeneity in its morphological and biological features, which complicates its classification and prognostication [2]. Although immunohistochemical profiling has advanced considerably, a substantial proportion of cases remain unclassifiable, and morphological features alone have shown limited predictive value for clinical outcomes. Gene expression profiles have shown numerous markers of prognostic significance in DLBCL [3]. These results are, however, not translatable into clinical practice due to technical difficulties and higher costs. Current chemotherapeutic regimens yield an overall survival (OS) rate of roughly 50%, underscoring the urgent need for novel prognostic indicators and targeted therapeutic strategies, particularly for patients in high-risk categories [4].
- Fundamentally, malignancies such as DLBCL arise from dysregulated cellular proliferation and impaired apoptotic mechanisms. The cell cycle is orchestrated by a framework of regulatory proteins, including cyclins (D, A, E), cyclin-dependent kinases, and their inhibitors, which operate in a tightly controlled, phase-specific manner. Epigenetic machinery encompassing modifications, DNA methylation, and non-coding RNAs plays a crucial role in modulating these cell cycle regulators. Enhancer of zeste homolog 2 (EZH2), a central histone methyltransferase, is instrumental in epigenetic silencing and has been implicated in the downregulation of tumor suppressor proteins such as p16 [5]. EZH2 catalyzes the trimethylation of histone H3 at lysine 27 (H3K27me3). Aberrant EZH2 expression has been documented across various malignancies, including lymphomas, suggesting its potential role in oncogenesis and disease progression [6].
- In primary DLBCL, this work investigates the relationship between EZH2 expression and cell cycle regulatory proteins, with a focus on their prognostic implications. Based on prior literature, we hypothesized a priori that EZH2 overexpression might contribute to epigenetic silencing of p16, a key cell cycle inhibitor, and that this axis might in turn be associated with adverse clinical outcomes. We tested this hypothesis empirically in the present cohort, recognizing that a protein-level immunohistochemical association does not, by itself, establish the underlying mechanism.
INTRODUCTION
- This retrospective study was performed by reviewing the archives of the Department of Pathology over a period of 3.5 years (2015 to 2018).
- A total of 131 cases of de novo DLBCL, NOS with primary nodal presentation were included; cases with secondary extranodal spread from nodal disease were retained, whereas primary extranodal DLBCL was excluded.
- Initially, 225 DLBCL cases were screened during the study period. Of these, 36 were excluded for insufficient tissue for immunohistochemistry (IHC) and 58 for incomplete clinical data. Baseline demographic and clinical characteristics of excluded cases did not differ meaningfully from those included. Clinical details including age, sex, sites of involvement, treatment received, response to therapy, and follow-up information were recorded for all selected cases. Cases with insufficient tissue for IHC or incomplete clinical data were excluded from the study. The included cases comprised non–double-hit and non–triple-hit lymphomas, without evidence of transformation or other special aggressive subtypes of DLBCL. Subtyping into germinal center B-cell-like (GCB) and activated B-cell-like (ABC) variants was performed using the Hans algorithm. Double-hit and triple-hit lymphomas were excluded by fluorescence in situ hybridization testing in clinically/morphologically suspected cases; special aggressive subtypes were excluded on the basis of histomorphology and immunophenotype alone.
- IHC analysis was performed on treatment-naïve biopsy specimens to evaluate the expression of selected epigenetic and cell cycle regulatory markers. The cell cycle proteins assessed included p53 (1:500, nuclear staining, Santa Cruz Biotechnology, Dallas, TX, USA), p16 (1:200, nuclear and cytoplasmic staining, Bio SB, Santa Barbara, CA, USA), and phosphorylated retinoblastoma protein (pRB; 1:500, nuclear staining, Cell Signaling Technology, Danvers, MA, USA). Epigenetic markers included EZH2 (1:100, nuclear staining, Cell Signaling Technology) and H3K27me3 (1:200, nuclear staining, Cell Signaling Technology). Sections measuring 4–5 µm in thickness were cut on poly-L-lysine–coated slides. IHC was performed manually using the UltraVision Quanto HRP detection kit (TL 125 QHL, Thermo Fisher Scientific, Waltham, MA, USA). Slides underwent baking, deparaffinization, and heat-induced antigen retrieval with appropriate buffers, followed by blocking, primary antibody incubation, and HRP DAB detection. Finally, slides were counterstained with Harris hematoxylin, dehydrated, cleared, and mounted for evaluation. Each antibody was validated against appropriate positive controls—cervical carcinoma for p16 and EZH2, ovarian carcinoma for p53, colon carcinoma for pRB, and lymphoma for H3K27me3—to ensure staining specificity and reproducibility. IHC was attempted on tissue microarray 2 mm blocks for smaller tissues (n = 50).
- Staining intensity and percentage positivity were quantified by two independent pathologists (blinded to treatment), the agreement of which was analyzed using the intraclass correlation coefficient (ICC). The percentage positivity was defined as the proportion of tumor cells exhibiting positivity, expressed as a continuous variable. For prognostic evaluation, percent values were analyzed against OS outcomes using receiver operating characteristic (ROC) curve analysis. The area under the curve (AUC) with 95% confidence intervals (CIs) was calculated to assess discriminatory performance, and optimal cutoff thresholds were determined by maximizing Youden’s Index (sensitivity + specificity – 1). Because ROC-derived cutoffs did not identify clinically actionable thresholds for any individual marker (AUC, 0.39 to 0.54; see “Results”), the thresholds ultimately applied were selected to approximate values reported in prior literature rather than to define new clinical cutoffs, and should be regarded as exploratory rather than validated diagnostic thresholds.
- To assess the combined prognostic utility of multiple immunohistochemical markers (EZH2, p16, H3K27me3, p53, and pRB), a composite molecular panel score was generated using multivariable Cox proportional hazards regression. For the remaining markers, standard cutoffs were applied: 40% for c-MYC and 50% for BCL2, BCL6, CD10, and MUM1. Scoring methodology: For each marker, positivity was assessed by counting across multiple representative fields at ×400 magnification. Heterogeneous staining was resolved by averaging across fields. For p16, both nuclear and cytoplasmic staining were considered positive. The two pathologists scored independently and were blinded to treatment and outcome; discordant cases were resolved by joint review. Marker-specific interpretable case numbers were lower than the full cohort for several markers (p16, n = 119; pRB, n = 121; p53, n = 125), reflecting tissue exhaustion and loss of the relevant core/section. These cases were excluded only from analyses involving the corresponding marker and were retained in analyses of the other markers and clinical variables.
- All statistical analyses were performed using Stata ver. 12 (StataCorp LLC, College Station, TX, USA). Marker expression was correlated with clinical parameters, treatment response, and survival outcomes. Associations between categorical variables were evaluated using chi-square tests, with a p-value of less than .05 considered statistically significant.
- Survival analysis was performed using the Cox proportional hazards regression model. Progression-free survival (PFS) and OS were defined as the time from diagnosis to disease progression or death, respectively. Patients without an event at last follow-up were censored at that time point. A stepwise Cox regression approach was applied to identify independent prognostic biomarkers. Initially, all candidate variables (EZH2, p16, H3K27me3, p53, pRB, and clinicopathological variables) were entered into the model. Variables were retained or excluded based on statistical significance thresholds (entry p < .05, removal p > .10). Hazard ratios (HRs) with 95% CIs were calculated to quantify the strength of association between biomarker expression and survival outcomes.
- Candidate clinicopathologic variables entered into the initial Cox model included age, sex, Ann Arbor stage, Eastern Cooperative Oncology Group (ECOG) performance status, International Prognostic Index (IPI) score, lactate dehydrogenase (LDH) level, B symptoms, and molecular subtype (GCB vs. ABC), together with the five IHC markers (excluded treatment regimen due to low sample size). IHC markers were entered as dichotomized variables using the standardized cutoffs described above rather than as continuous variables. Cases with marker-specific missing data were excluded from the model in a marker-wise (pairwise) manner; no imputation was performed. The proportional hazards assumption was not formally tested in this exploratory analysis, and is a limitation of the statistical approach. Given the modest sample size relative to the number of candidate variables, no correction for multiple testing was applied; hence, all model outputs should accordingly be interpreted as exploratory.
MATERIALS AND METHODS
- A total of 131 patients diagnosed with primary nodal DLBCL, NOS were included in the study. The age of patients ranged from 22 to 86 years, with a mean of 51.3 years. The majority (64.1%, n = 84) were under 60 years of age, and the cohort exhibited a male predominance (male-to-female ratio, 1.73:1). Based on immunohistochemical classification using the Hans algorithm, 57 cases (44.2%) were categorized as GCB subtype and 72 cases (55.8%) as ABC subtype; two cases were excluded due to inconclusive IHC results.
- At presentation, 53.4% (n = 70) of patients reported B-symptoms, 52.7% (n = 69) had Ann Arbor stage III/IV disease, and 54.2% (n = 71) showed secondary extranodal involvement (extranodal spread of nodal disease). Elevated LDH levels were observed in 71.1% of cases, and 41.2% had an IPI score of >2. Treatment regimens included CHOP (cyclophosphamide, doxorubicin, vincristine, and prednisone) (n = 62, 47.3%) or R-CHOP (rituximab with CHOP combination) (n = 69, 52.7%). Treatment regimen was not included as a covariate due to low sample size.
- ROC curve analysis
- ROC curve analyses of EZH2, p16, p53, H3K27me3, and pRB showed poor prognostic utility for OS and only modest subtype discrimination. For OS, EZH2 had an AUC of 0.44 (95% CI, 0.37 to 0.60; optimal cutoff 80%–100%, negligible value), p16 an AUC of 0.49 (95% CI, 0.37 to 0.58; no meaningful threshold across 20%–100%), p53 an AUC of 0.39 (95% CI, 0.31 to 0.53; cutoffs 50%–70% with sensitivity 35%–50%, specificity 37%–52%), H3K27me3 an AUC of 0.54 (95% CI, 0.41 to 0.62; cutoffs 50%–70% with sensitivity 66%–89%, specificity 19%–44%), and pRB an AUC of 0.50 (95% CI, 0.38 to 0.61; cutoffs 40%–60% with sensitivity 64%–82%, specificity 26%–43%). For subtype classification, EZH2 achieved an AUC of 0.59 (95% CI, 0.49 to 0.69; cutoffs 70%–90% with sensitivity 56%–77%, specificity 43%–64%, Youden’s Index ≈0.20). Collectively, none identified clinically actionable cutoffs. For consistency, thresholds were standardized to 80% for EZH2, 50% for p53, 50% for H3K27me3, 40% for pRB, and 50% for p16 (Supplementary Fig. S1). For p16, a 50% exploratory threshold was used for consistency in categorical analyses; this threshold was not externally validated and should not be interpreted as clinically actionable.
- Interobserver agreement was consistently high across all biomarkers. EZH2, H3K27me3, and p53 showed excellent reproducibility with ICC values of 0.96, 0.95, and 0.94, respectively, while p16 and pRB demonstrated very strong agreement with ICC values of 0.93 and 0.92. All results were statistically significant (p < .001), confirming reliable scoring between observers.
- EZH2 expression
- EZH2 immunopositivity was observed in 59.5% (n = 78 of 131). Significant associations were noted with p53 expression (53/74, 71.6%; p = .003), GCB subtype (40/57, 70.2%; p = .031), and CD10 positivity (28/38, 73.7%; p = .030). No significant correlations were found with pRB, p16, H3K27me3, BCL6, MUM1, or clinical variables including age, sex, stage, ECOG, IPI, LDH, and B symptoms. Patient outcomes (relapse and OS status) also showed no significant differences between EZH2-positive and negative groups (p > .05) (Tables 1–3).
- H3K27me3 expression
- H3K27me3 immunopositivity was interpretable in 131 cases, with positivity in 109 of 131 cases (83.2%; GCB, 78.9%; ABC, 86.1%). No significant associations were observed with primary IHC markers, demographic variables, or clinical features. Pathological markers showed no consistent correlations, though high expression was common across CD10, BCL6, and MUM1 positive cases without statistical significance. Importantly, patient outcomes did not differ meaningfully between H3K27me3 positive and negative groups (Tables 1–3).
- pRB expression
- pRB immunoexpression was interpretable in 121 cases, with positivity observed in approximately 74%–76% across the cohort. pRB positivity was significantly more frequent in the ABC subtype than in the GCB subtype (52/63, 82.5% vs. 36/56, 64.3%; p = .024) and was associated with MUM1 expression (62/78, 79.5%; p = .028). Patient outcomes did not differ significantly between pRB positive and negative groups (Tables 1–3).
- p53 expression
- p53 immunopositivity was interpretable in 125 cases, with positivity in 74 cases (59.2%). Significant associations were observed with EZH2 expression (53/76, 69.7%; p = .003) (Tables 1–3).
- p16 expression
- p16 expression was interpretable in 119 cases, with positivity observed in 29 cases (24.4%). Significant association was noted with BCL6 (21/63, 33.3%; p = .004) (Tables 1–3).
- Correlation analysis of immunohistochemical markers
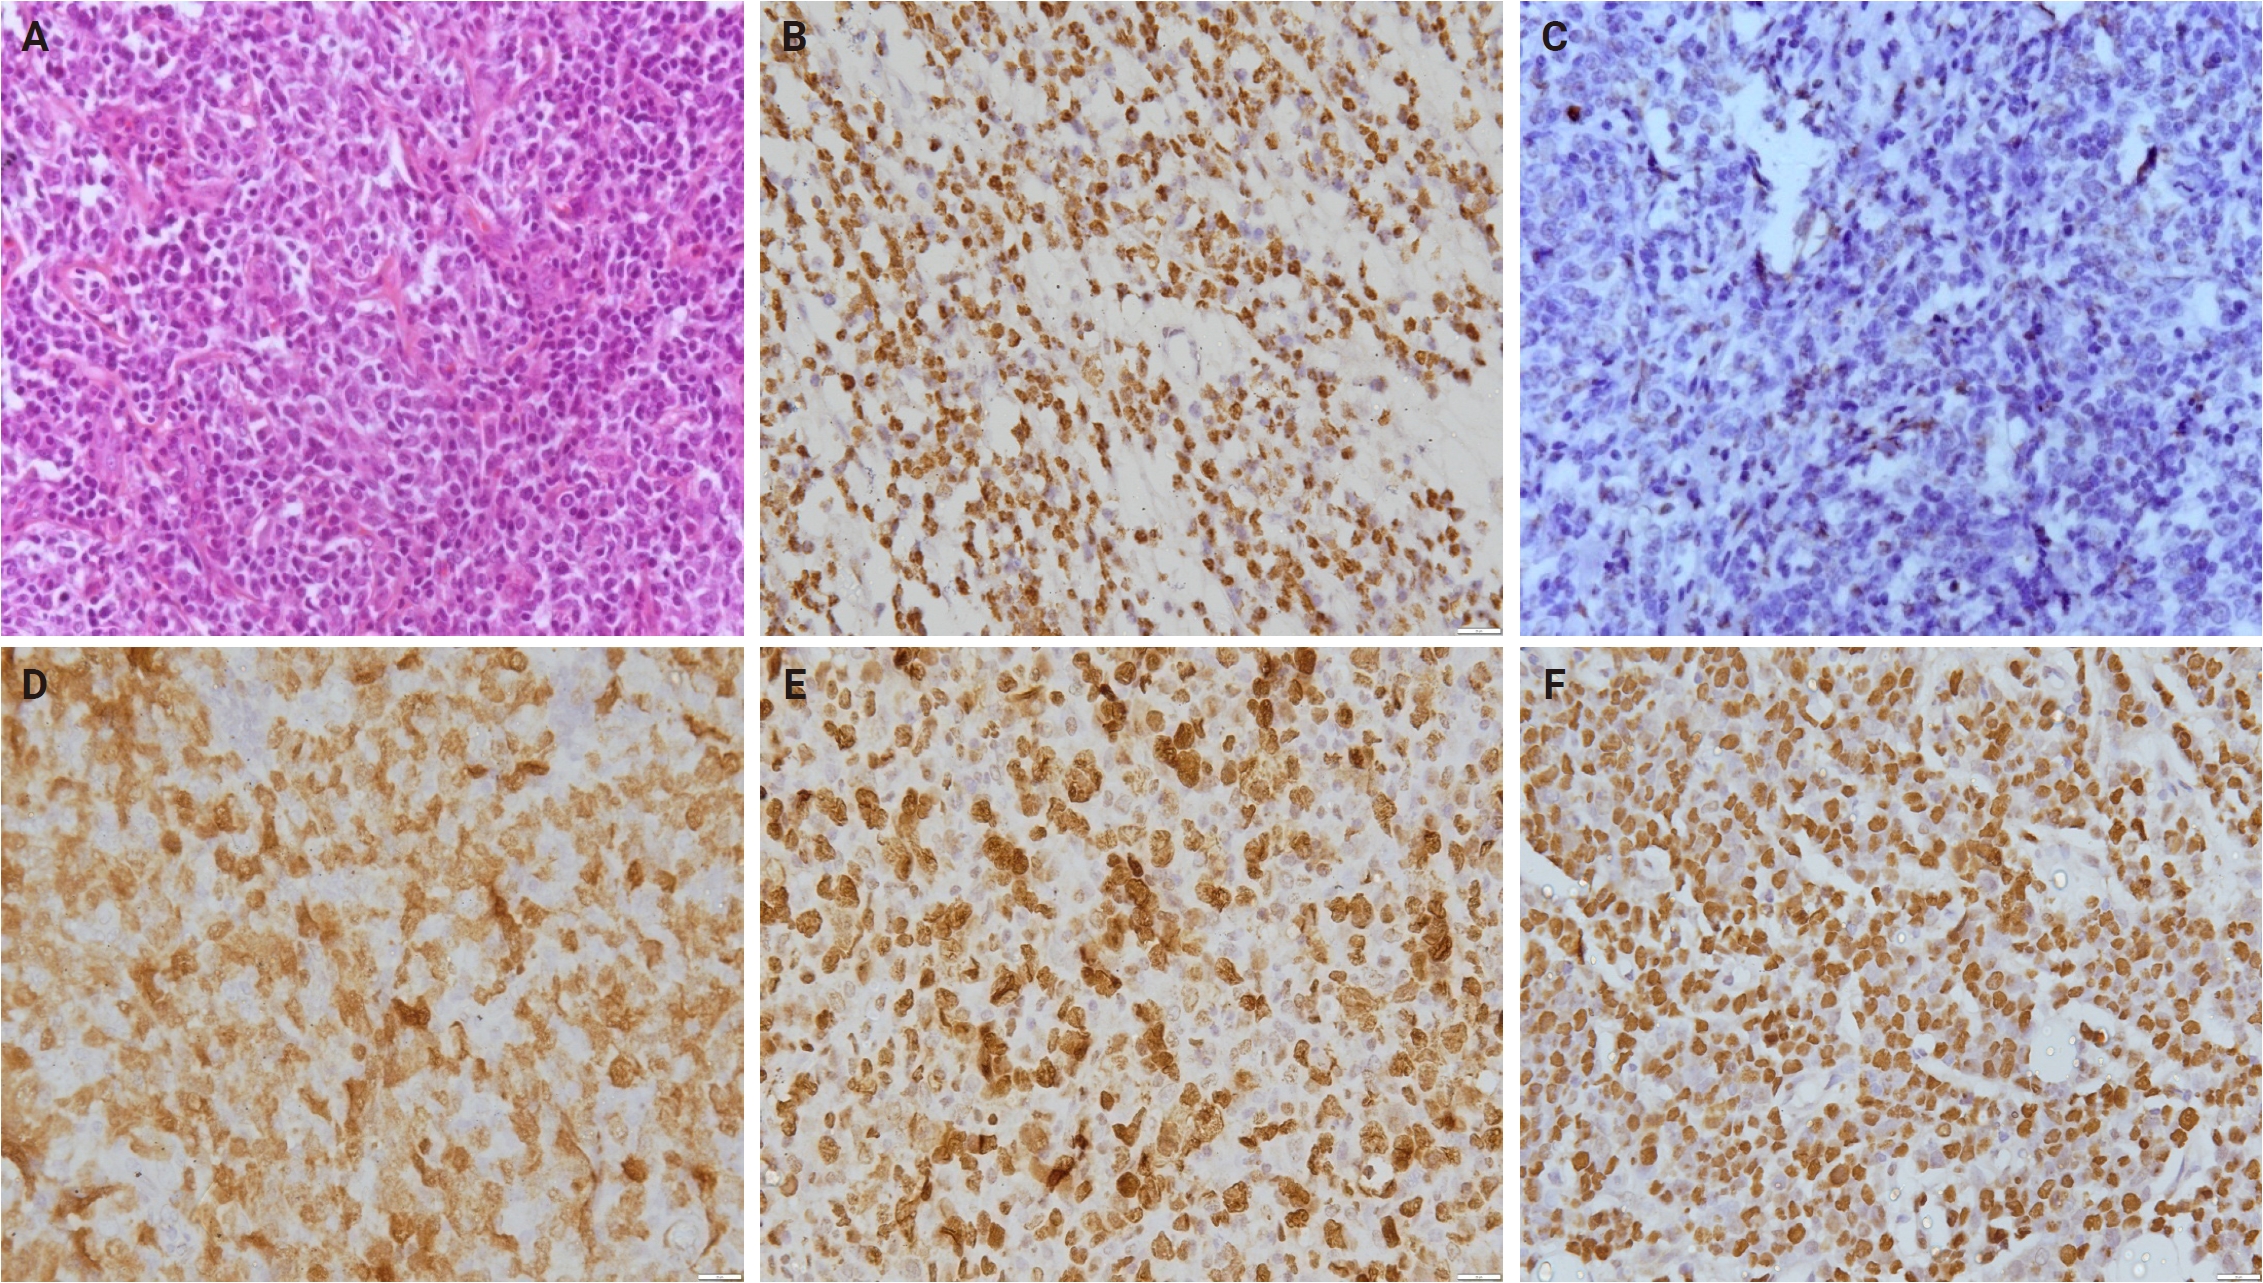
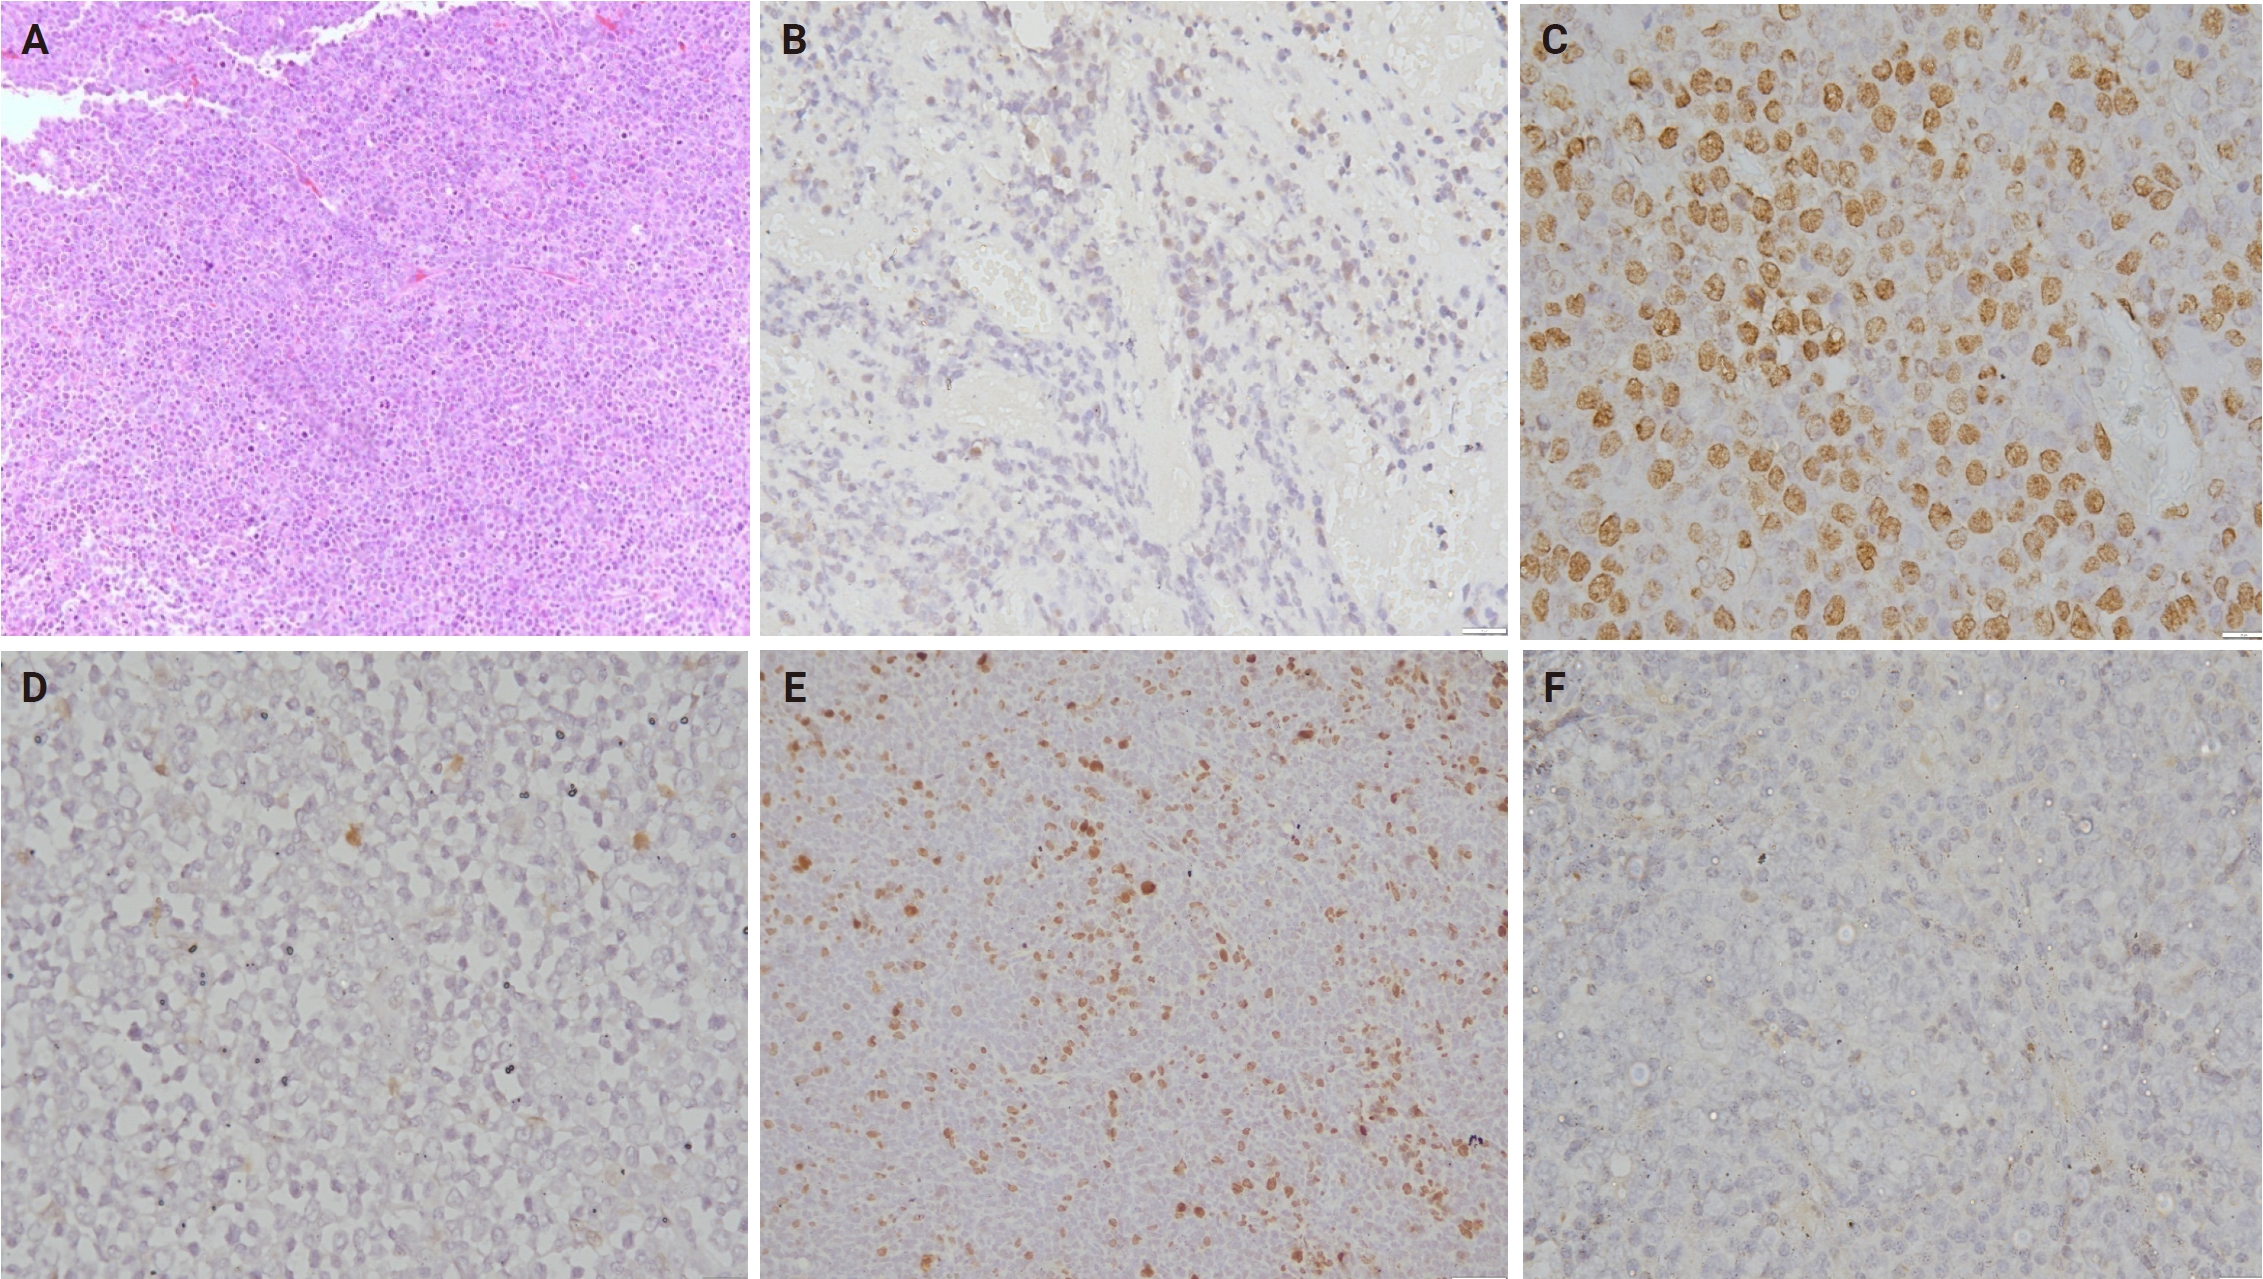
- Spearman’s correlation analysis among the five biomarkers revealed selective significant associations. EZH2 showed a positive correlation with p53 (ρ = 0.202, p < .05) and pRB (ρ = 0.212, p < .05), while H3K27me3 was significantly correlated with pRB (ρ = 0.192, p < .05) (Table 4, Figs. 1, 2). All other pairwise correlations among the five markers were not statistically significant.
- Combined ROC analysis
- Combined ROC analyses showed that multi-marker panels performed better than single biomarkers, but discrimination remained modest. The best combinations (e.g., EZH2 + p16 + H3K27me3 + p53) achieved AUCs of 0.62–0.65, while the composite five-marker panel reached 0.64 (95% CI, 0.52 to 0.76). In contrast, individual markers alone yielded AUCs of 0.39–0.54, essentially chance level. Even the strongest panels fell below thresholds typically considered clinically useful (AUC ≥ 0.7–0.75).
- Survival analysis
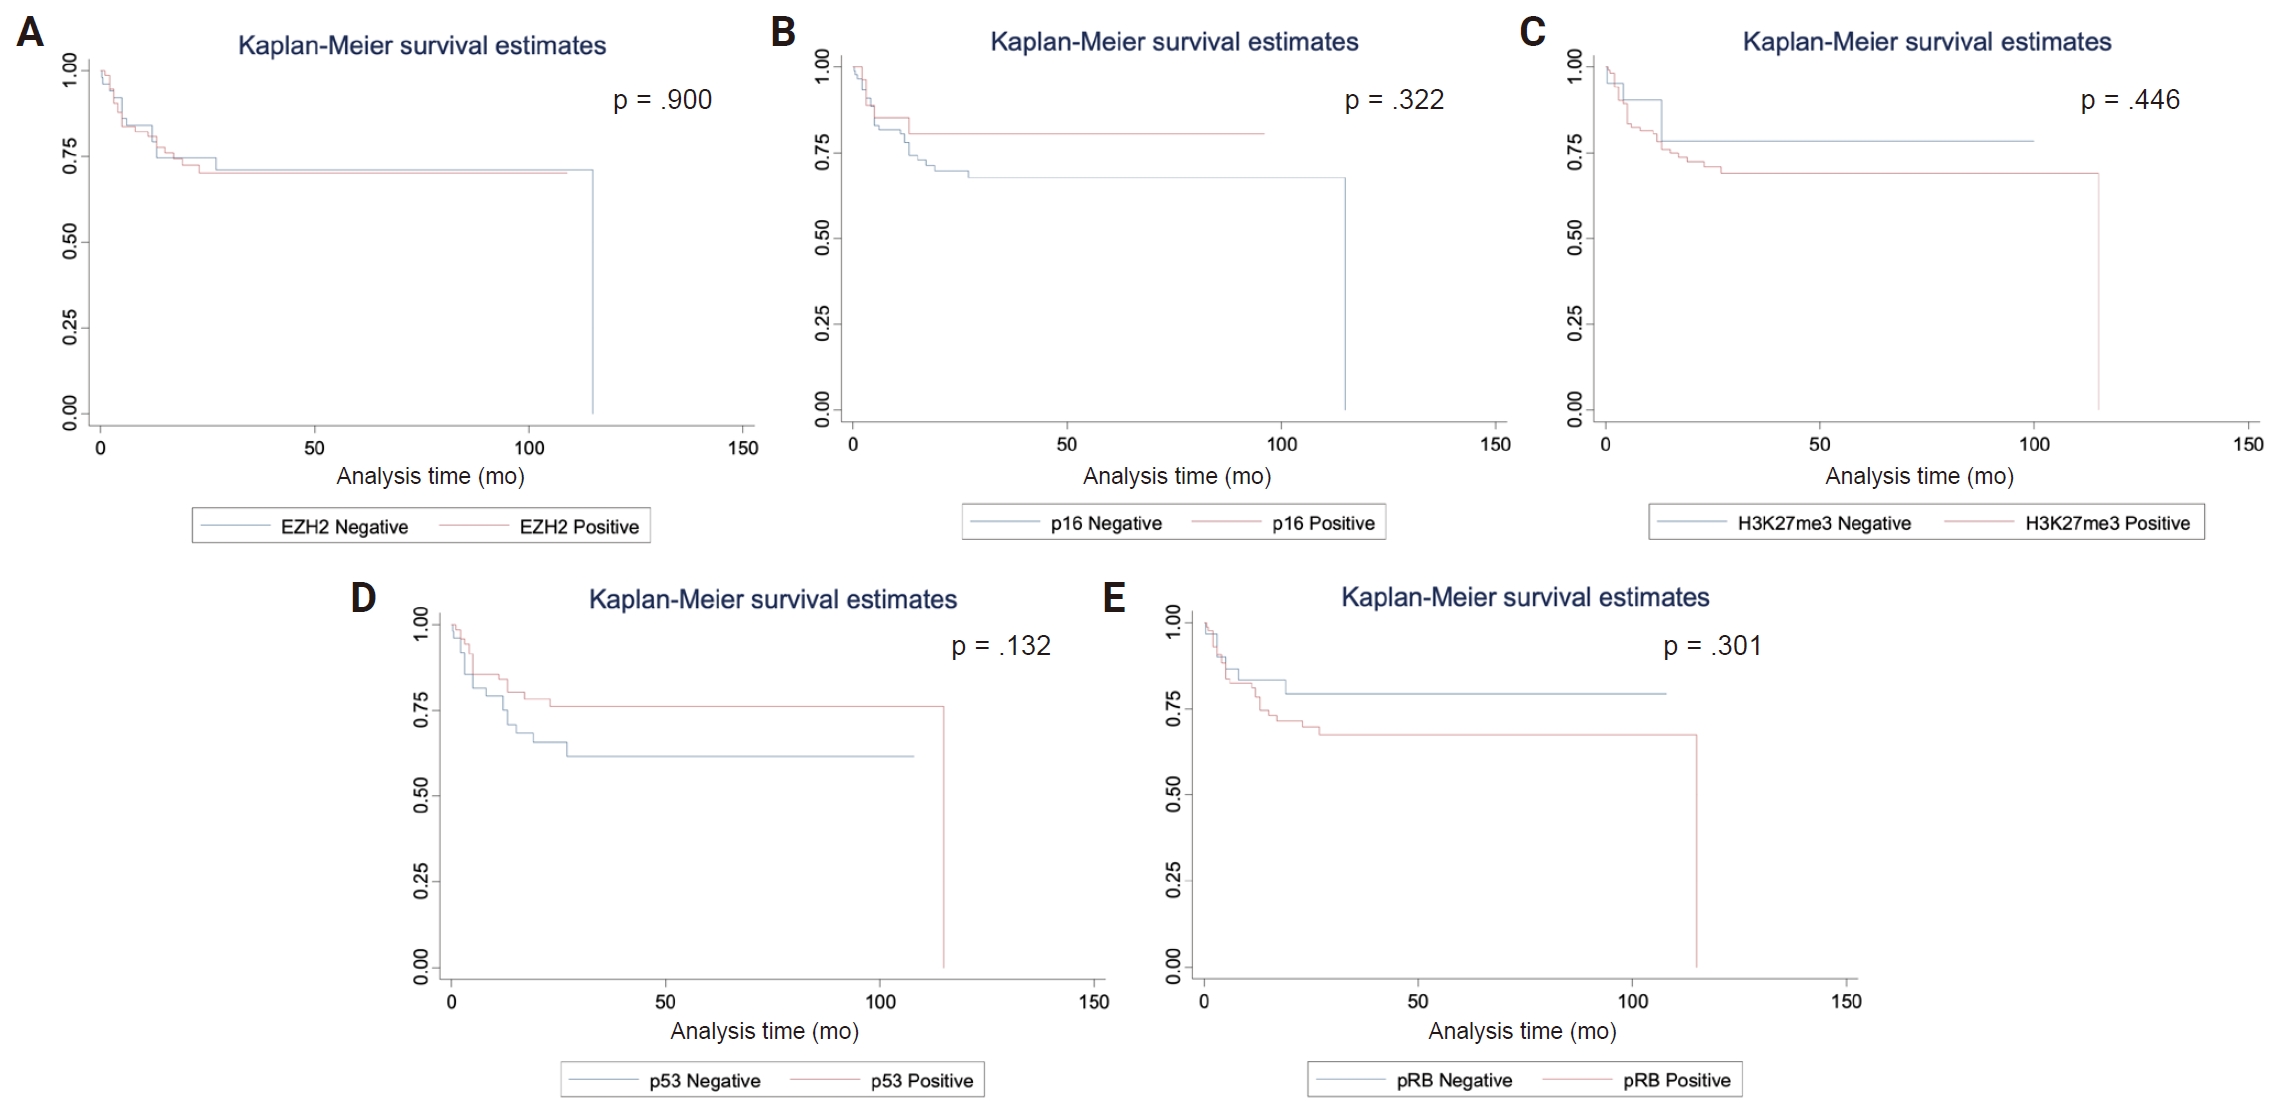
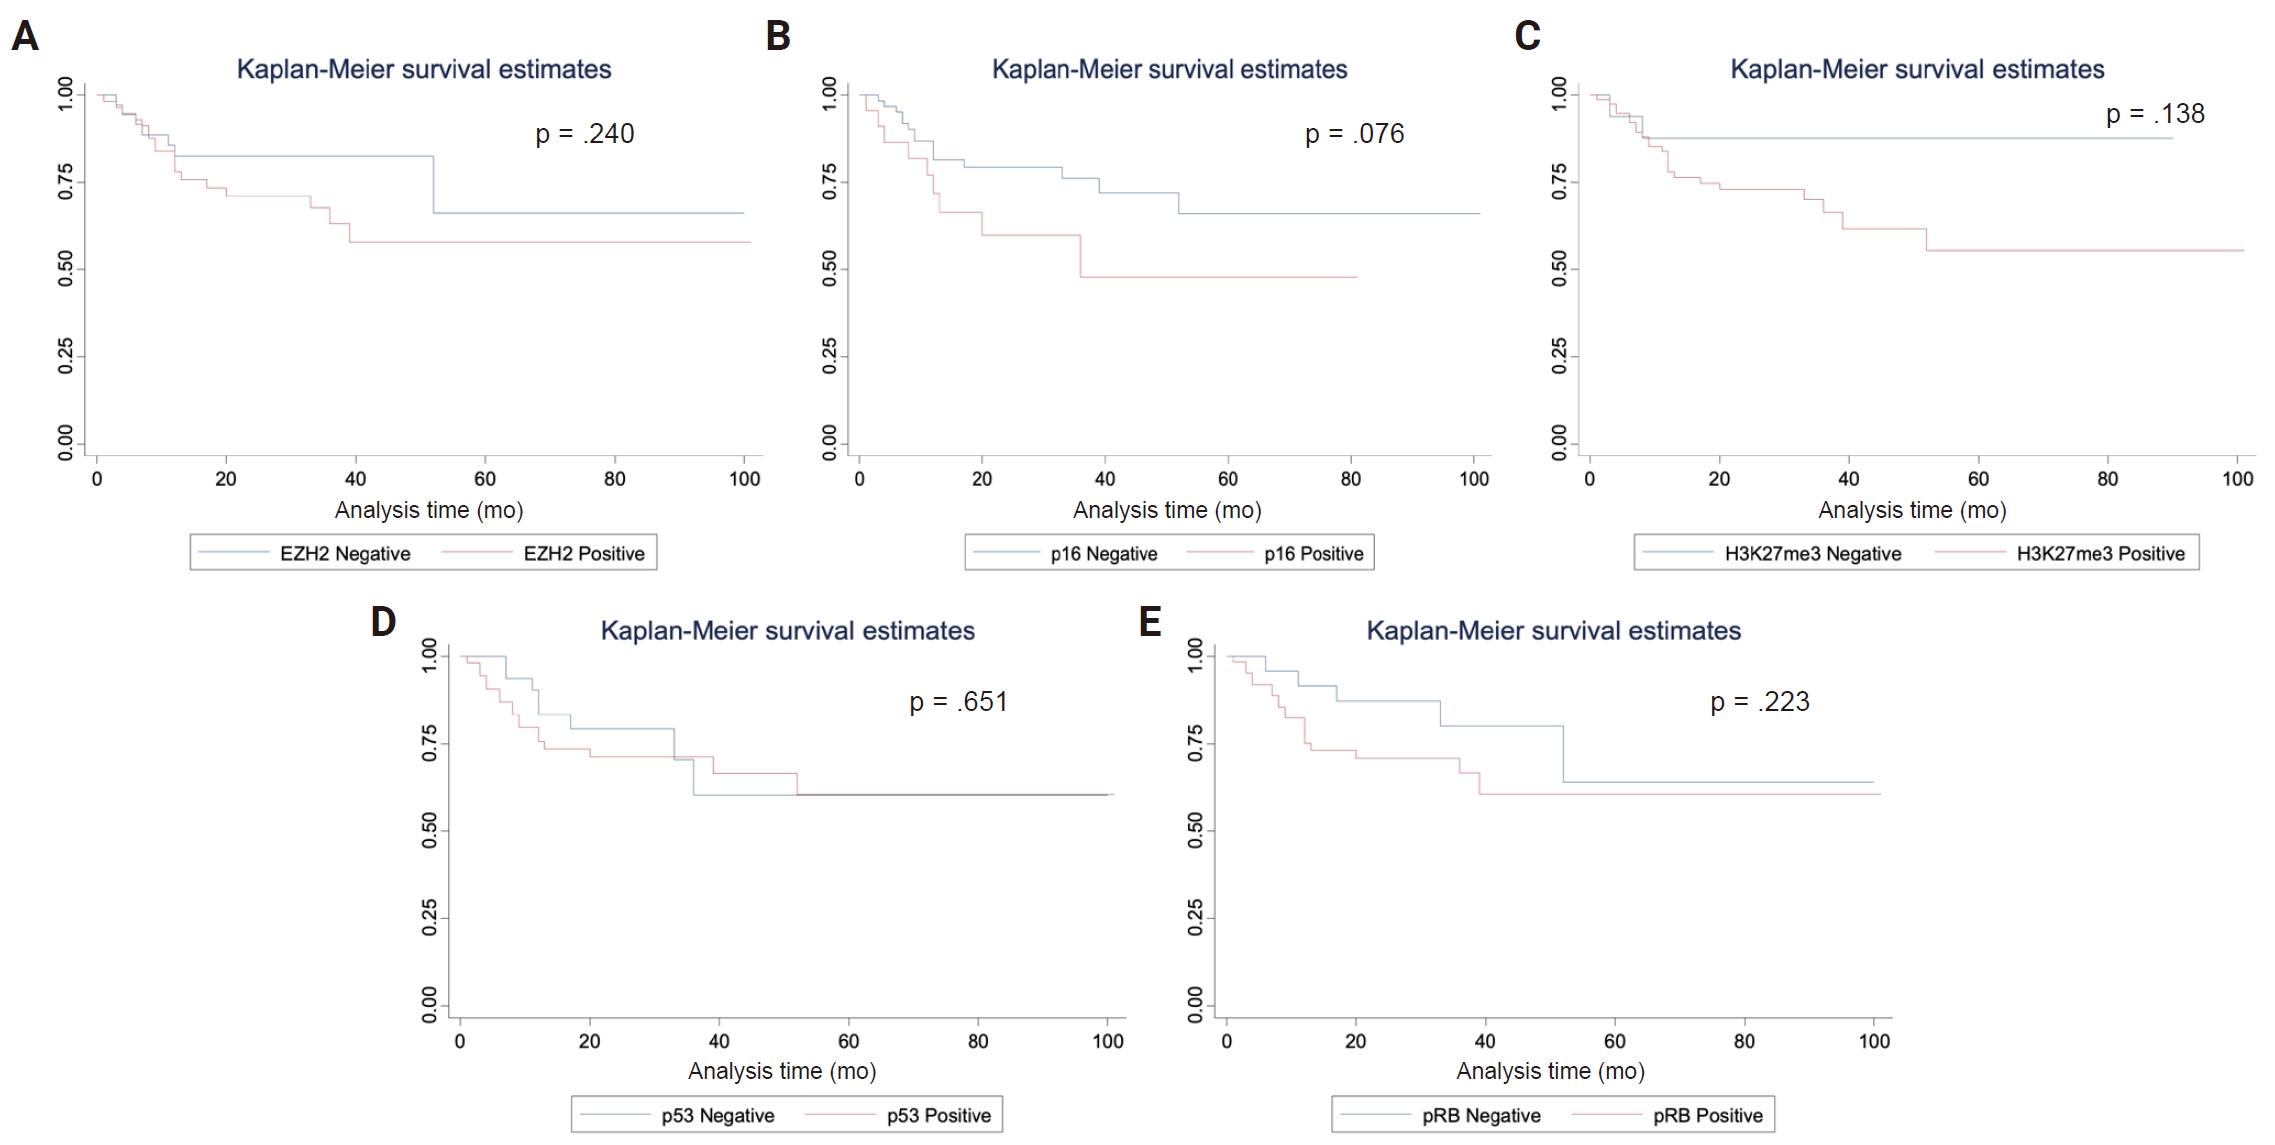
- The median follow-up was 20 months (range, 0 to 101; interquartile range [IQR], 7 to 35) for PFS and 19 months (range, 0.3 to 115; IQR, 8 to 35) for OS. Death occurred in 35 patients and relapse was observed in 41 patients. Two patients were lost to follow-up. Stepwise Cox regression identified age > 60 years and ECOG ≥ 2 status as independent predictors of OS. In the final model (likelihood ratio χ² = 16.7, p < .001), age was associated with a 2.04-fold increased hazard (2.04; 95% CI, 1.03 to 4.04; p = .042), while ECOG conferred a 3.46-fold increased hazard (3.46; 95% CI, 1.67 to 7.16; p = .001). All other variables (IHC markers) were excluded during stepwise selection due to lack of statistical significance. In stepwise Cox regression for PFS, none of the biomarkers showed significant associations (Figs. 3, 4). Lack of treatment stratification between CHOP and R-CHOP is a key limitation, as rituximab use may confound survival analyses.
RESULTS
- DLBCL is characterized by profound molecular heterogeneity. While various epigenetic and cell cycle regulators are implicated in its pathogenesis, their clinical utility as IHC-based biomarkers remains debated. Our study evaluated EZH2, H3K27me3, p53, p16, and pRB, revealing that these markers show selected biological associations, whereas clinical parameters remain the main predictors of survival in our cohort.
- We observed 59.5% EZH2 expression, which was significantly associated with p53 (p = .003), GCB subtype (p = .031), and CD10 (p = .030); aligning with previous studies that implicate EZH2 in lymphomagenesis through epigenetic silencing of tumor suppressor genes [7]. As the catalytic subunit of the polycomb repressive complex 2, EZH2 promotes tumorigenesis via its histone methyltransferase activity, specifically H3K27me3. Functionally, EZH2 acts as a master regulator of cellular homeostasis by driving cell cycle progression, enhancing DNA repair, suppressing autophagy and apoptosis, and inhibiting cellular senescence [8]. Previous studies have examined EZH2 upregulation in lymphomas and myeloid neoplasms, which has often been associated with worse prognosis [9]. Particularly, in DLBCL, they have been linked to downregulation of runt-related transcription factor 3, a transforming growth factor β pathway downstream effector [10]. While some studies in low-grade non-Hodgkin lymphomas have reported prognostic relevance using a 30% cutoff for EZH2 immunopositivity, others have employed higher thresholds (e.g., 70%), potentially contributing to inconsistent findings across cohorts [10,11]. In contrast, our ROC analysis suggested an even higher cutoff, reflecting the diffuse staining pattern observed and underscoring its negligible impact on survival outcomes. EZH2 plays a canonical role in germinal center dynamics, and its mutations are predominantly confined to the GCB subtype of DLBCL, as seen here [9,12]. Earlier research suggests aggressive characteristics in DLBCL are linked to elevated EZH2 expression regardless of mutational status [13]. Interestingly, some reports have associated high EZH2 expression with favorable prognosis, further underscoring the context-dependent nature of its oncogenic role [14]. Additionally, our study found no association between BCL co-expression and survival, which is in contrast to previous findings, supporting the hypothesis that EZH2-driven oncogenesis may be influenced by additional molecular interactions beyond its canonical targets [12,15].
- However, despite these strong biological associations, EZH2 protein expression failed to predict OS. This suggests that in DLBCL, the presence of the EZH2 protein, as detected by IHC, does not necessarily equate to the aggressive phenotype typically associated with EZH2 Y641 mutations [16]. The positive but weak correlation between EZH2 and p53 protein expression (Spearman's ρ = 0.202) indicates only a modest co-occurrence at the protein level. This IHC-based association cannot, on its own, establish a synergistic mechanism such as epigenetic silencing of p53-target genes or stabilized mutant p53 accumulation; confirming any such interaction would require TP53 mutation/sequencing data and functional studies that were not performed here, and this possibility should be regarded as speculative rather than demonstrated [17].
- Likewise, aberrant H3K27me3 has been reported as a hallmark of EZH2-driven oncogenesis, and RB pathway disruption has been implicated in lymphoma biology. H3K27me3 and pRB showed high prevalence (83.2% and 74.4%, respectively). The significant correlation between H3K27me3 and pRB (ρ = 0.192) suggests a possible link between histone methylation and cell cycle exit points, though this did not translate to clinical outcomes [18,19]. There is a known mechanism of RB gene suppression by microRNA-155–mediated signaling in DLBCL, which in future may act as a prognostic biomarker [20,21]. Studies have indicated that a worse prognosis is often associated with strong p53 expression in DLBCL [22,23]. It is important to recognize the importance of p53 mutations, rather than protein expression alone since a mutated genotype may express as null or wild phenotype [24]. p16–CDK4/6–RB axis is known to be involved in DLBCL [25]. Although no direct link was observed between EZH2 and p16, p16 has shown varied results, including overexpression patterns in the GCB subtype (which may be reflected in its observed association with BCL6 [p = .004]) and methylation which is associated with dismal prognosis [26,27].
- Furthermore, our results reinforce the primacy of clinical staging. Age > 60 years (HR, 2.04) and ECOG status ≥ 2 (HR, 3.46) were the only independent predictors of OS. This underscores that in the current era of treatment, host factors and performance status often outweigh single-protein expression patterns in predicting mortality.
- ROC analyses showed poor performance of individual markers (AUCs, 0.39 to 0.54), underscoring limited prognostic utility. Multi-marker panels, such as EZH2 + p16 + H3K27me3 + p53, improved discrimination modestly (AUC, up to 0.65), yet even these composite IHC panels remain below thresholds typically considered clinically useful and are not ready for risk stratification in clinical practice. This also suggests that the integrated biological state of a tumor is better captured by an integrated signature rather than any single protein. The high interobserver agreement (ICC, 0.92 to 0.96) proves that our scoring was reliable, but the biology itself is too heterogeneous for simple IHC thresholds to serve as robust clinical cutoffs.
- Our study suggests that IHC expression of EZH2, p53, H3K27me3, and pRB does not translate into actionable prognostic markers, despite strong biological rationale and mutational evidence in the literature. This divergence likely reflects methodological limitations (semi-quantitative scoring, cutoff variability) and the inability of IHC to capture functional mutations or epigenetic activity. Although none of the biomarkers achieved statistical significance in our cohort, cell cycle inhibitors may hold underexplored prognostic value in DLBCL, though this requires confirmation in larger independent cohorts. Our data do not support a direct link between EZH2 expression and p16 status at the IHC level, and the hypothesized EZH2-mediated silencing of p16 requires molecular validation. Although EZH2 was highly expressed and biologically associated with p53 and the GCB subtype, it showed no independent prognostic impact, nor did it correlate directly with p16.
- In conclusion, while EZH2, H3K27me3, p53, p16, and pRB demonstrate biological associations in DLBCL, their prognostic utility as IHC markers is weak. Findings should be regarded as exploratory, hypothesis-generating observations. This study has limitations, including its retrospective, single-center design, treatment heterogeneity (CHOP vs. R-CHOP), incomplete follow-up, and reliance on semi-quantitative IHC without molecular profiling. Variability in cutoff thresholds, small subgroup sizes, and absence of an independent validation cohort further limit reproducibility and statistical robustness. Future research should address these gaps through prospective, multi-center studies with standardized protocols, uniform follow-up, and integration of molecular profiling. Quantitative IHC methods, harmonized thresholds, and validation in larger cohorts will be essential to strengthen prognostic models. Ultimately, combining clinical variables with molecular, multiomics, and immunohistochemical data may yield more reliable risk stratification and guide targeted therapeutic strategies in DLBCL, moving closer to clinically actionable biomarkers.
DISCUSSION
Supplementary Information
Ethics Statement
All procedures performed in the current study were approved by the institute’s ethics committee (IEC/NP-357/10.09.2015) in accordance with the 1964 Helsinki Declaration and its later amendments. The study was initiated after taking informed consent from all prospective patients.
Availability of Data and Material
The datasets generated or analyzed during the study are available from the corresponding author on reasonable request.
Code Availability
Not applicable.
Author Contributions
Conceptualization: SM. Data curation: IG, SJ, CKD, MRL. Formal analysis: SM, AG, MCS. Funding acquisition: SM. Investigation: AG, SM. Methodology: SM, ADU, AG, MCS. Project administration: SM. Resources: SM, AG. Supervision: SM. Visualization: SM, MCS. Writing—original draft: IG, SJ. Writing—review & editing: SJ, SM, MCS, AG. Approval of final manuscript: all authors.
Conflicts of Interest
The authors declare that they have no potential conflicts of interest.
Funding Statement
This work was supported by funding from the All India Institute of Medical Sciences, project code: A-362.
Acknowledgments
The authors gratefully acknowledge the contributions of all collaborators, clinicians, and technical staff involved in this study.
| Biomarker | EZH2 | p53 | p16 | H3K27me3 | pRB |
|---|---|---|---|---|---|
| EZH2 | 0.202* | −0.13 | 0.13 | 0.212* | |
| p53 | 0.202* | 0.06 | −0.12 | 0.16 | |
| p16 | −0.13 | 0.06 | −0.15 | −0.05 | |
| H3K27me3 | 0.13 | −0.12 | −0.15 | 0.192* | |
| pRB | 0.212* | 0.16 | −0.05 | 0.192* |
- 1. Wang SS. Epidemiology and etiology of diffuse large B-cell lymphoma. Semin Hematol 2023; 60: 255-66. ArticlePubMedPMC
- 2. Hilton LK, Scott DW, Morin RD. Biological heterogeneity in diffuse large B-cell lymphoma. Semin Hematol 2023; 60: 267-76. ArticlePubMed
- 3. Papageorgiou SG, Thomopoulos TP, Katagas I, Bouchla A, Pappa V. Prognostic molecular biomarkers in diffuse large B-cell lymphoma in the rituximab era and their therapeutic implications. Ther Adv Hematol 2021; 12: 20406207211013987.ArticlePubMedPMCPDF
- 4. Atallah-Yunes SA, Khurana A, Maurer M. Challenges identifying DLBCL patients with poor outcomes to upfront chemoimmunotherapy and its impact on frontline clinical trials. Leuk Lymphoma 2024; 65: 430-9. ArticlePubMedPMC
- 5. Liu Y, Yang Q. The roles of EZH2 in cancer and its inhibitors. Med Oncol 2023; 40: 167.ArticlePubMedPMCPDF
- 6. Gilardini Montani MS, Benedetti R, Cirone M. Targeting EZH2 in cancer: mechanisms, pathways, and therapeutic potential. Molecules 2024; 29: 5817.ArticlePubMedPMC
- 7. Li B, Chng WJ. EZH2 abnormalities in lymphoid malignancies: underlying mechanisms and therapeutic implications. J Hematol Oncol 2019; 12: 118.ArticlePubMedPMCPDF
- 8. Duan R, Du W, Guo W. EZH2: a novel target for cancer treatment. J Hematol Oncol 2020; 13: 104.ArticlePubMedPMCPDF
- 9. Zhang Q, Han Q, Zi J, et al. Mutations in EZH2 are associated with poor prognosis for patients with myeloid neoplasms. Genes Dis 2019; 6: 276-81. ArticlePubMedPMC
- 10. Dubois S, Mareschal S, Picquenot JM, et al. Immunohistochemical and genomic profiles of diffuse large B-cell lymphomas: implications for targeted EZH2 inhibitor therapy? Oncotarget 2015; 6: 16712-24. ArticlePubMedPMC
- 11. Sener M, Dincyurek HD, Totik N, Bagir EK, Paydas S, Gurkan E. EZH-2 expression and prognostic significance in patients with low-grade non-Hodgkin lymphoma. Sci Rep 2025; 15: 19329.ArticlePubMedPMC
- 12. Petronilho S, Sequeira JP, Paulino S, et al. Prognostic value of histone modifying enzyme EZH2 in RCHOP-treated diffuse large B-cell lymphoma and high grade B-cell lymphoma. J Pers Med 2021; 11: 1384.ArticlePubMedPMC
- 13. Zhou Z, Gao J, Popovic R, et al. Strong expression of EZH2 and accumulation of trimethylated H3K27 in diffuse large B-cell lymphoma independent of cell of origin and EZH2 codon 641 mutation. Leuk Lymphoma 2015; 56: 2895-901. ArticlePubMed
- 14. Lee HJ, Shin DH, Kim KB, et al. Polycomb protein EZH2 expression in diffuse large B-cell lymphoma is associated with better prognosis in patients treated with rituximab, cyclophosphamide, doxorubicin, vincristine and prednisone. Leuk Lymphoma 2014; 55: 2056-63. ArticlePubMed
- 15. Deng Y, Chen X, Huang C, et al. EZH2/Bcl-2 coexpression predicts worse survival in diffuse large B-cell lymphomas and demonstrates poor efficacy to rituximab in localized lesions. J Cancer 2019; 10: 2006-17. ArticlePubMedPMC
- 16. Yap DB, Chu J, Berg T, et al. Somatic mutations at EZH2 Y641 act dominantly through a mechanism of selectively altered PRC2 catalytic activity, to increase H3K27 trimethylation. Blood 2011; 117: 2451-9. ArticlePubMedPMCPDF
- 17. Landsburg DJ, Morrissette JJ, Nasta SD, et al. TP53 mutations predict for poor outcomes in patients with newly diagnosed aggressive B-cell lymphomas in the current era. Blood Adv 2023; 7: 7243-53. ArticlePubMedPMCPDF
- 18. Oh EJ, Yang WI, Cheong JW, Choi SE, Yoon SO. Diffuse large B-cell lymphoma with histone H3 trimethylation at lysine 27: another poor prognostic phenotype independent of c-Myc/Bcl2 coexpression. Hum Pathol 2014; 45: 2043-50. ArticlePubMed
- 19. Adegbola O, Pasternack GR. Phosphorylated retinoblastoma protein complexes with pp32 and inhibits pp32-mediated apoptosis. J Biol Chem 2005; 280: 15497-502. ArticlePubMed
- 20. Jiang D, Aguiar RC. MicroRNA-155 controls RB phosphorylation in normal and malignant B lymphocytes via the noncanonical TGF-beta1/SMAD5 signaling module. Blood 2014; 123: 86-93. ArticlePubMed
- 21. Koumpis E, Georgoulis V, Papathanasiou K, et al. The role of microRNA-155 as a biomarker in diffuse large B-cell lymphoma. Biomedicines 2024; 12: 2658.ArticlePubMedPMC
- 22. Jing Y, Yuan Y, Yu Y, Zhao H, Yang H, Wang X. p53/PD-L1 co-expression predicts poor prognosis in diffuse large B-cell lymphoma. Discov Oncol 2025; 16: 1270.ArticlePubMedPMCPDF
- 23. Farinha P, Sehn L, Skinnider B, et al. Strong p53 expression is an independent predictor of outcome in de novo diffuse large B cell lymphoma (DLBCL) treated with either CHOP or CHOP-R. Blood 2006; 108: 812.ArticlePubMedPMCPDF
- 24. Du KX, Wu YF, Hua W, et al. Identify truly high-risk TP53-mutated diffuse large B cell lymphoma patients and explore the underlying biological mechanisms. Cell Commun Signal 2024; 22: 401.ArticlePubMedPMCPDF
- 25. Lee ES, Kim LH, Abdullah WA, Peh SC. Expression and alteration of p16 in diffuse large B cell lymphoma. Pathobiology 2010; 77: 96-105. ArticlePubMedPDF
- 26. Mohd Ridah LJ, Talib NA, Muhammad N, Hussain FA, Zainuddin N. p16 tumor suppressor gene methylation in diffuse large B cell lymphoma: a study of 88 cases at two hospitals in the East Coast of Malaysia. Asian Pac J Cancer Prev 2017; 18: 2781-5. ArticlePubMedPMC
- 27. Hamed HB, Hammam MT, Abulwafa ME, Temerik DF, Abdelmohsen SM, Elashmawy HE. Prognostic role of p16 gene methylation in diffuse large B-cell lymphoma. Al-Azhar Assiut Med J 2025; 23: 307-16. Article
REFERENCES
Figure & Data
References
Citations

 PubReader
 ePub Link
-
 Cite this Article
- Cite this Article
-
- Close
- Download Citation
- Close
 XML Download
- Figure
-
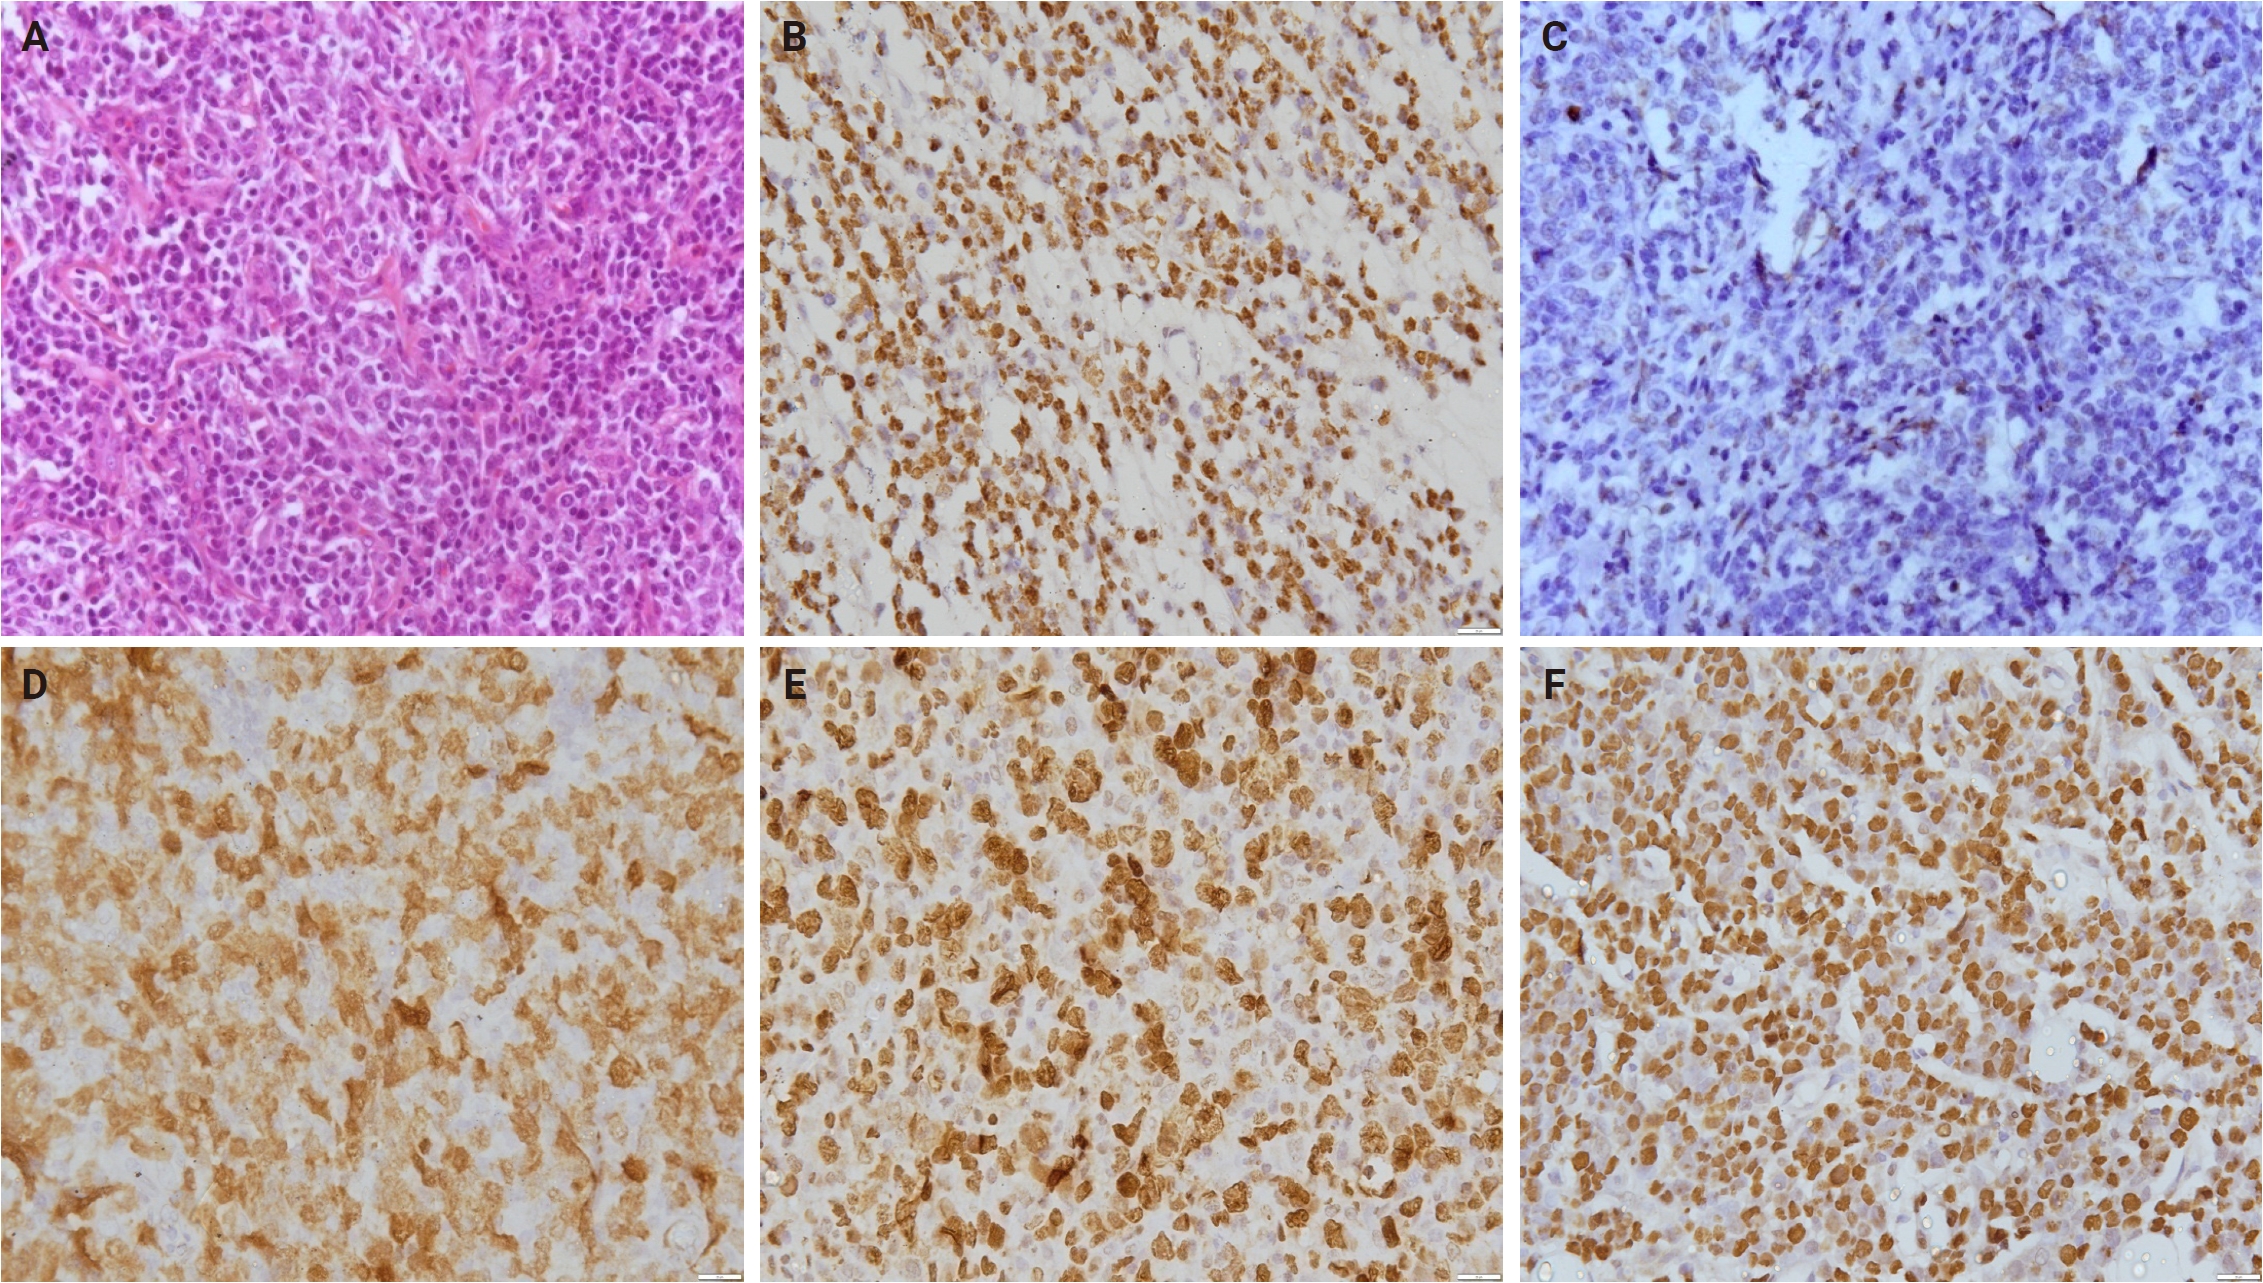
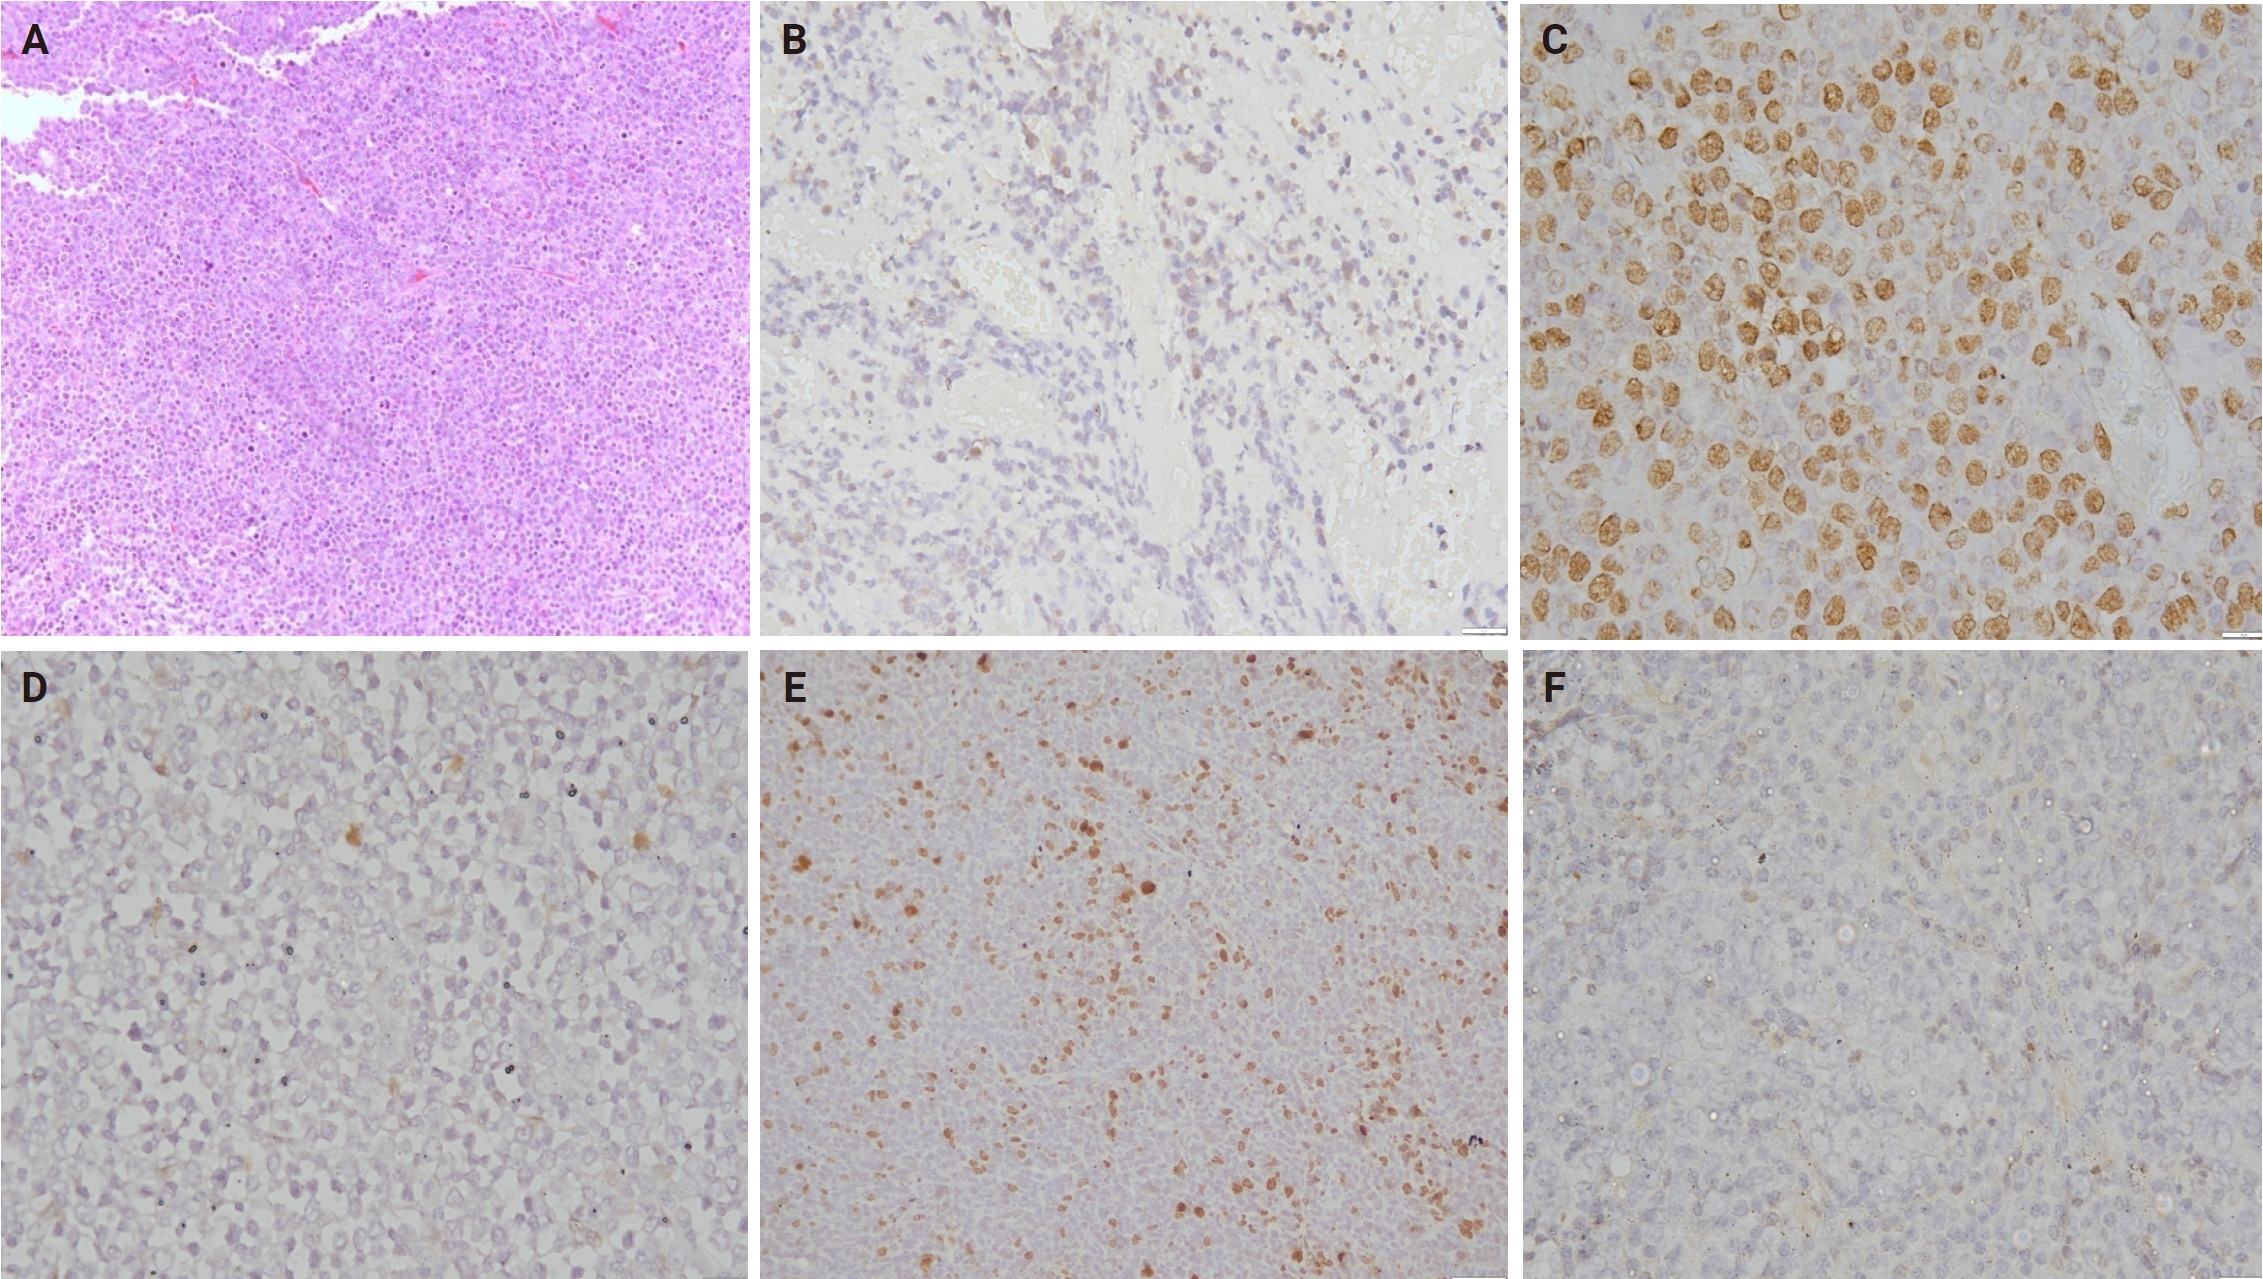
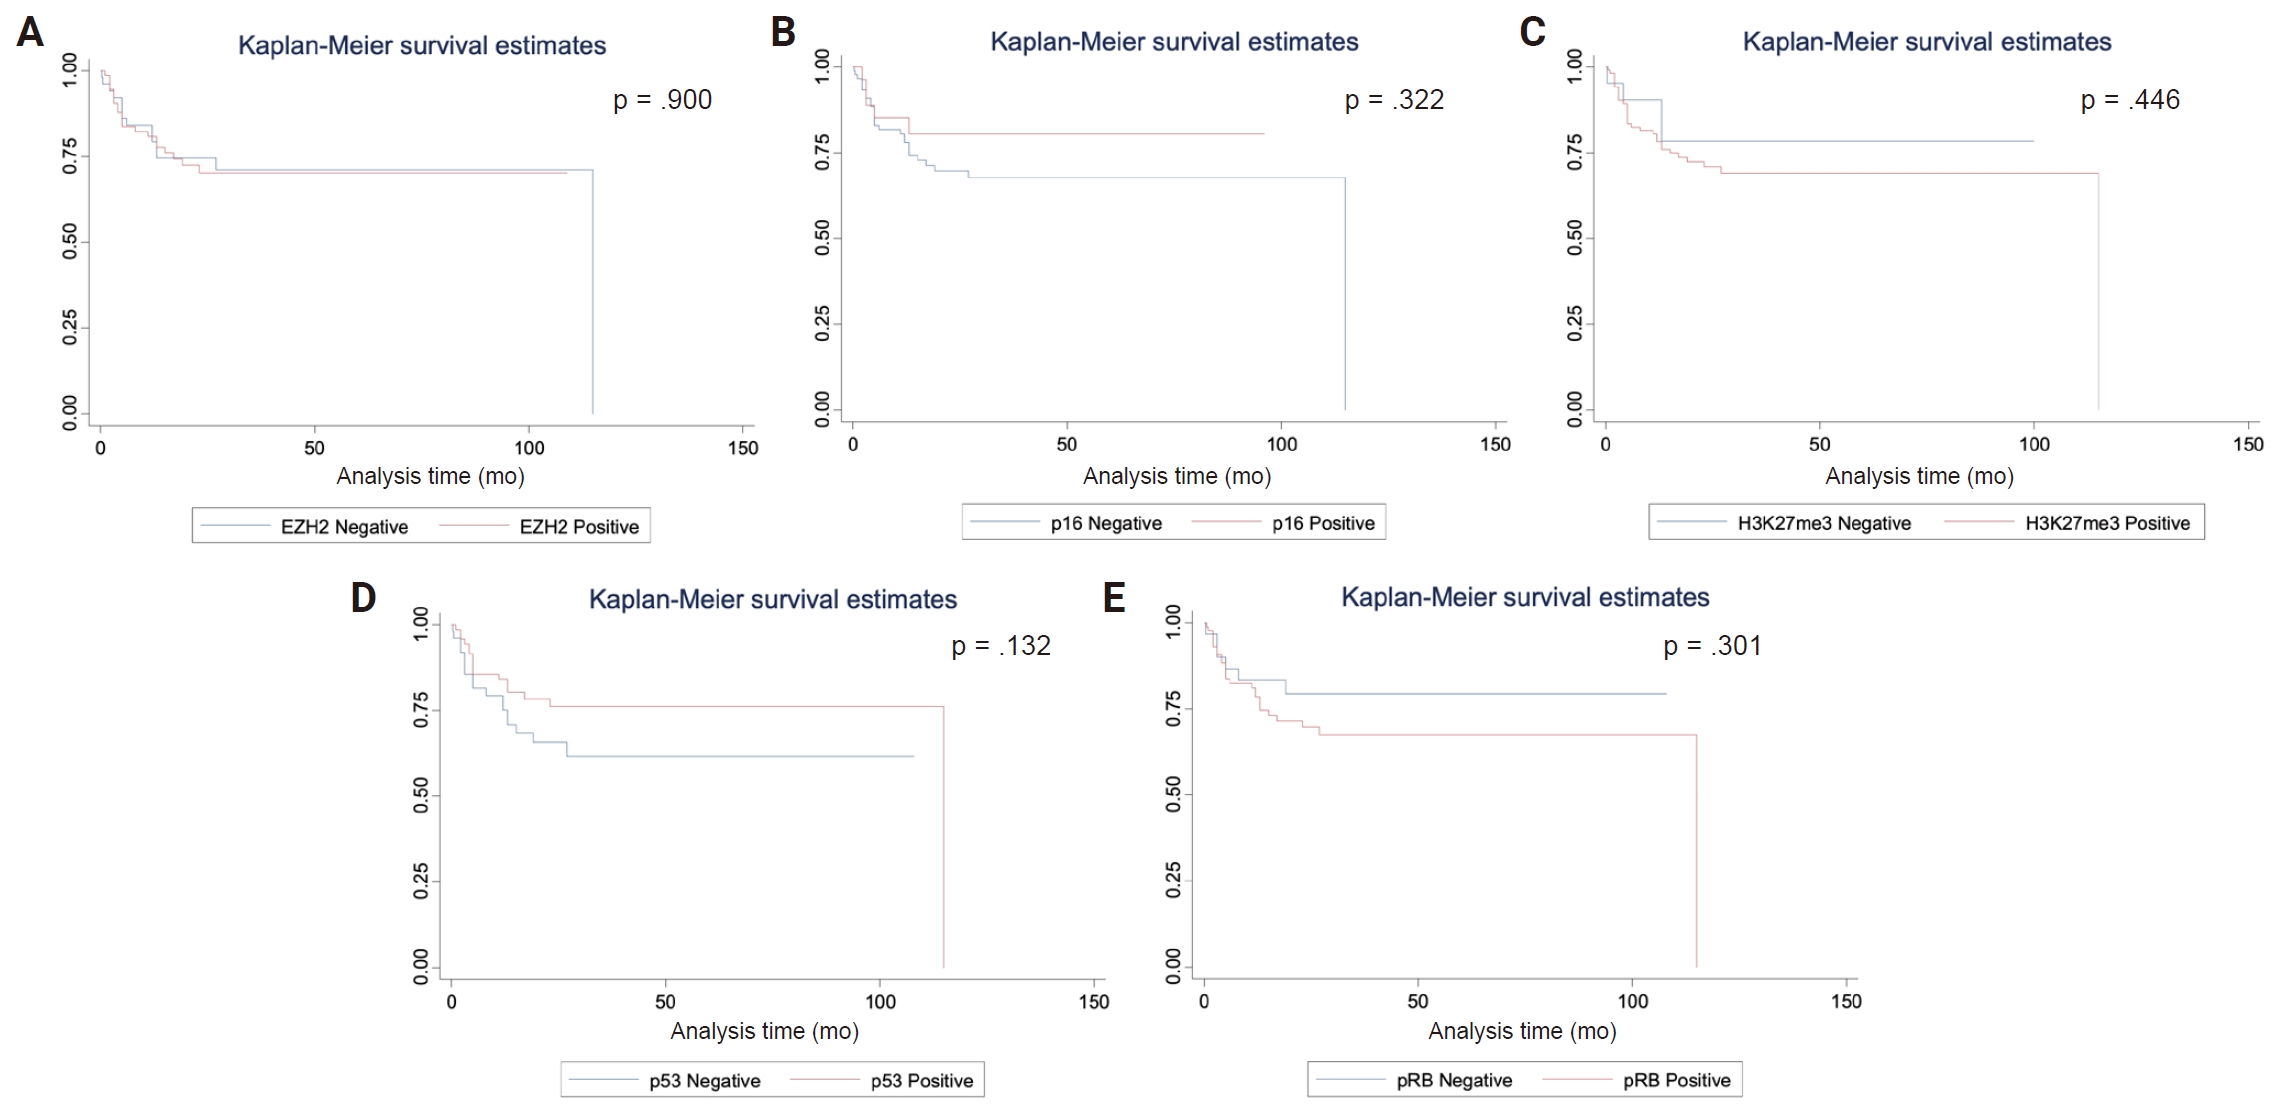
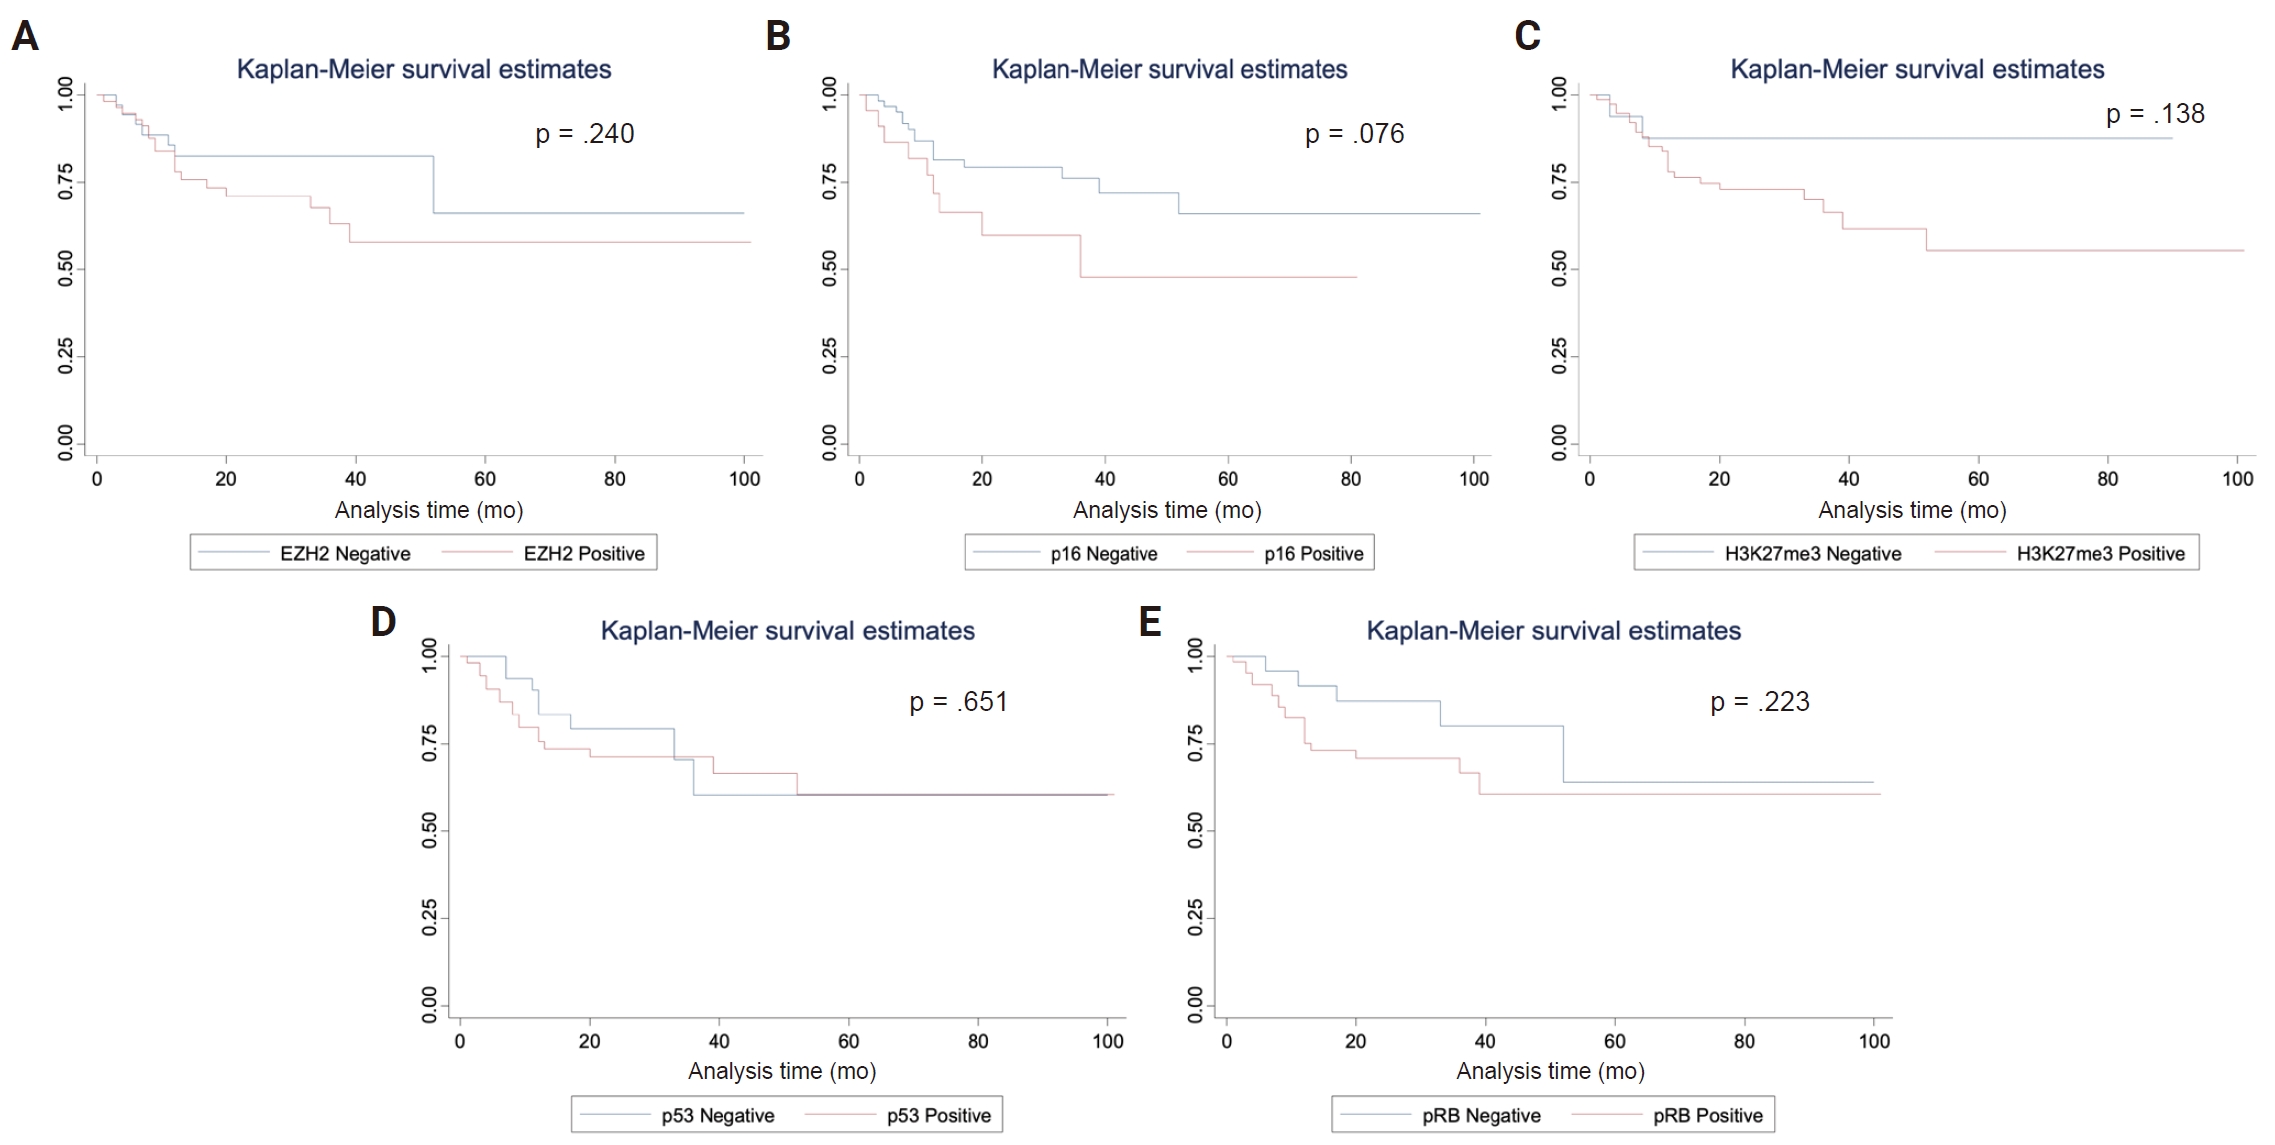
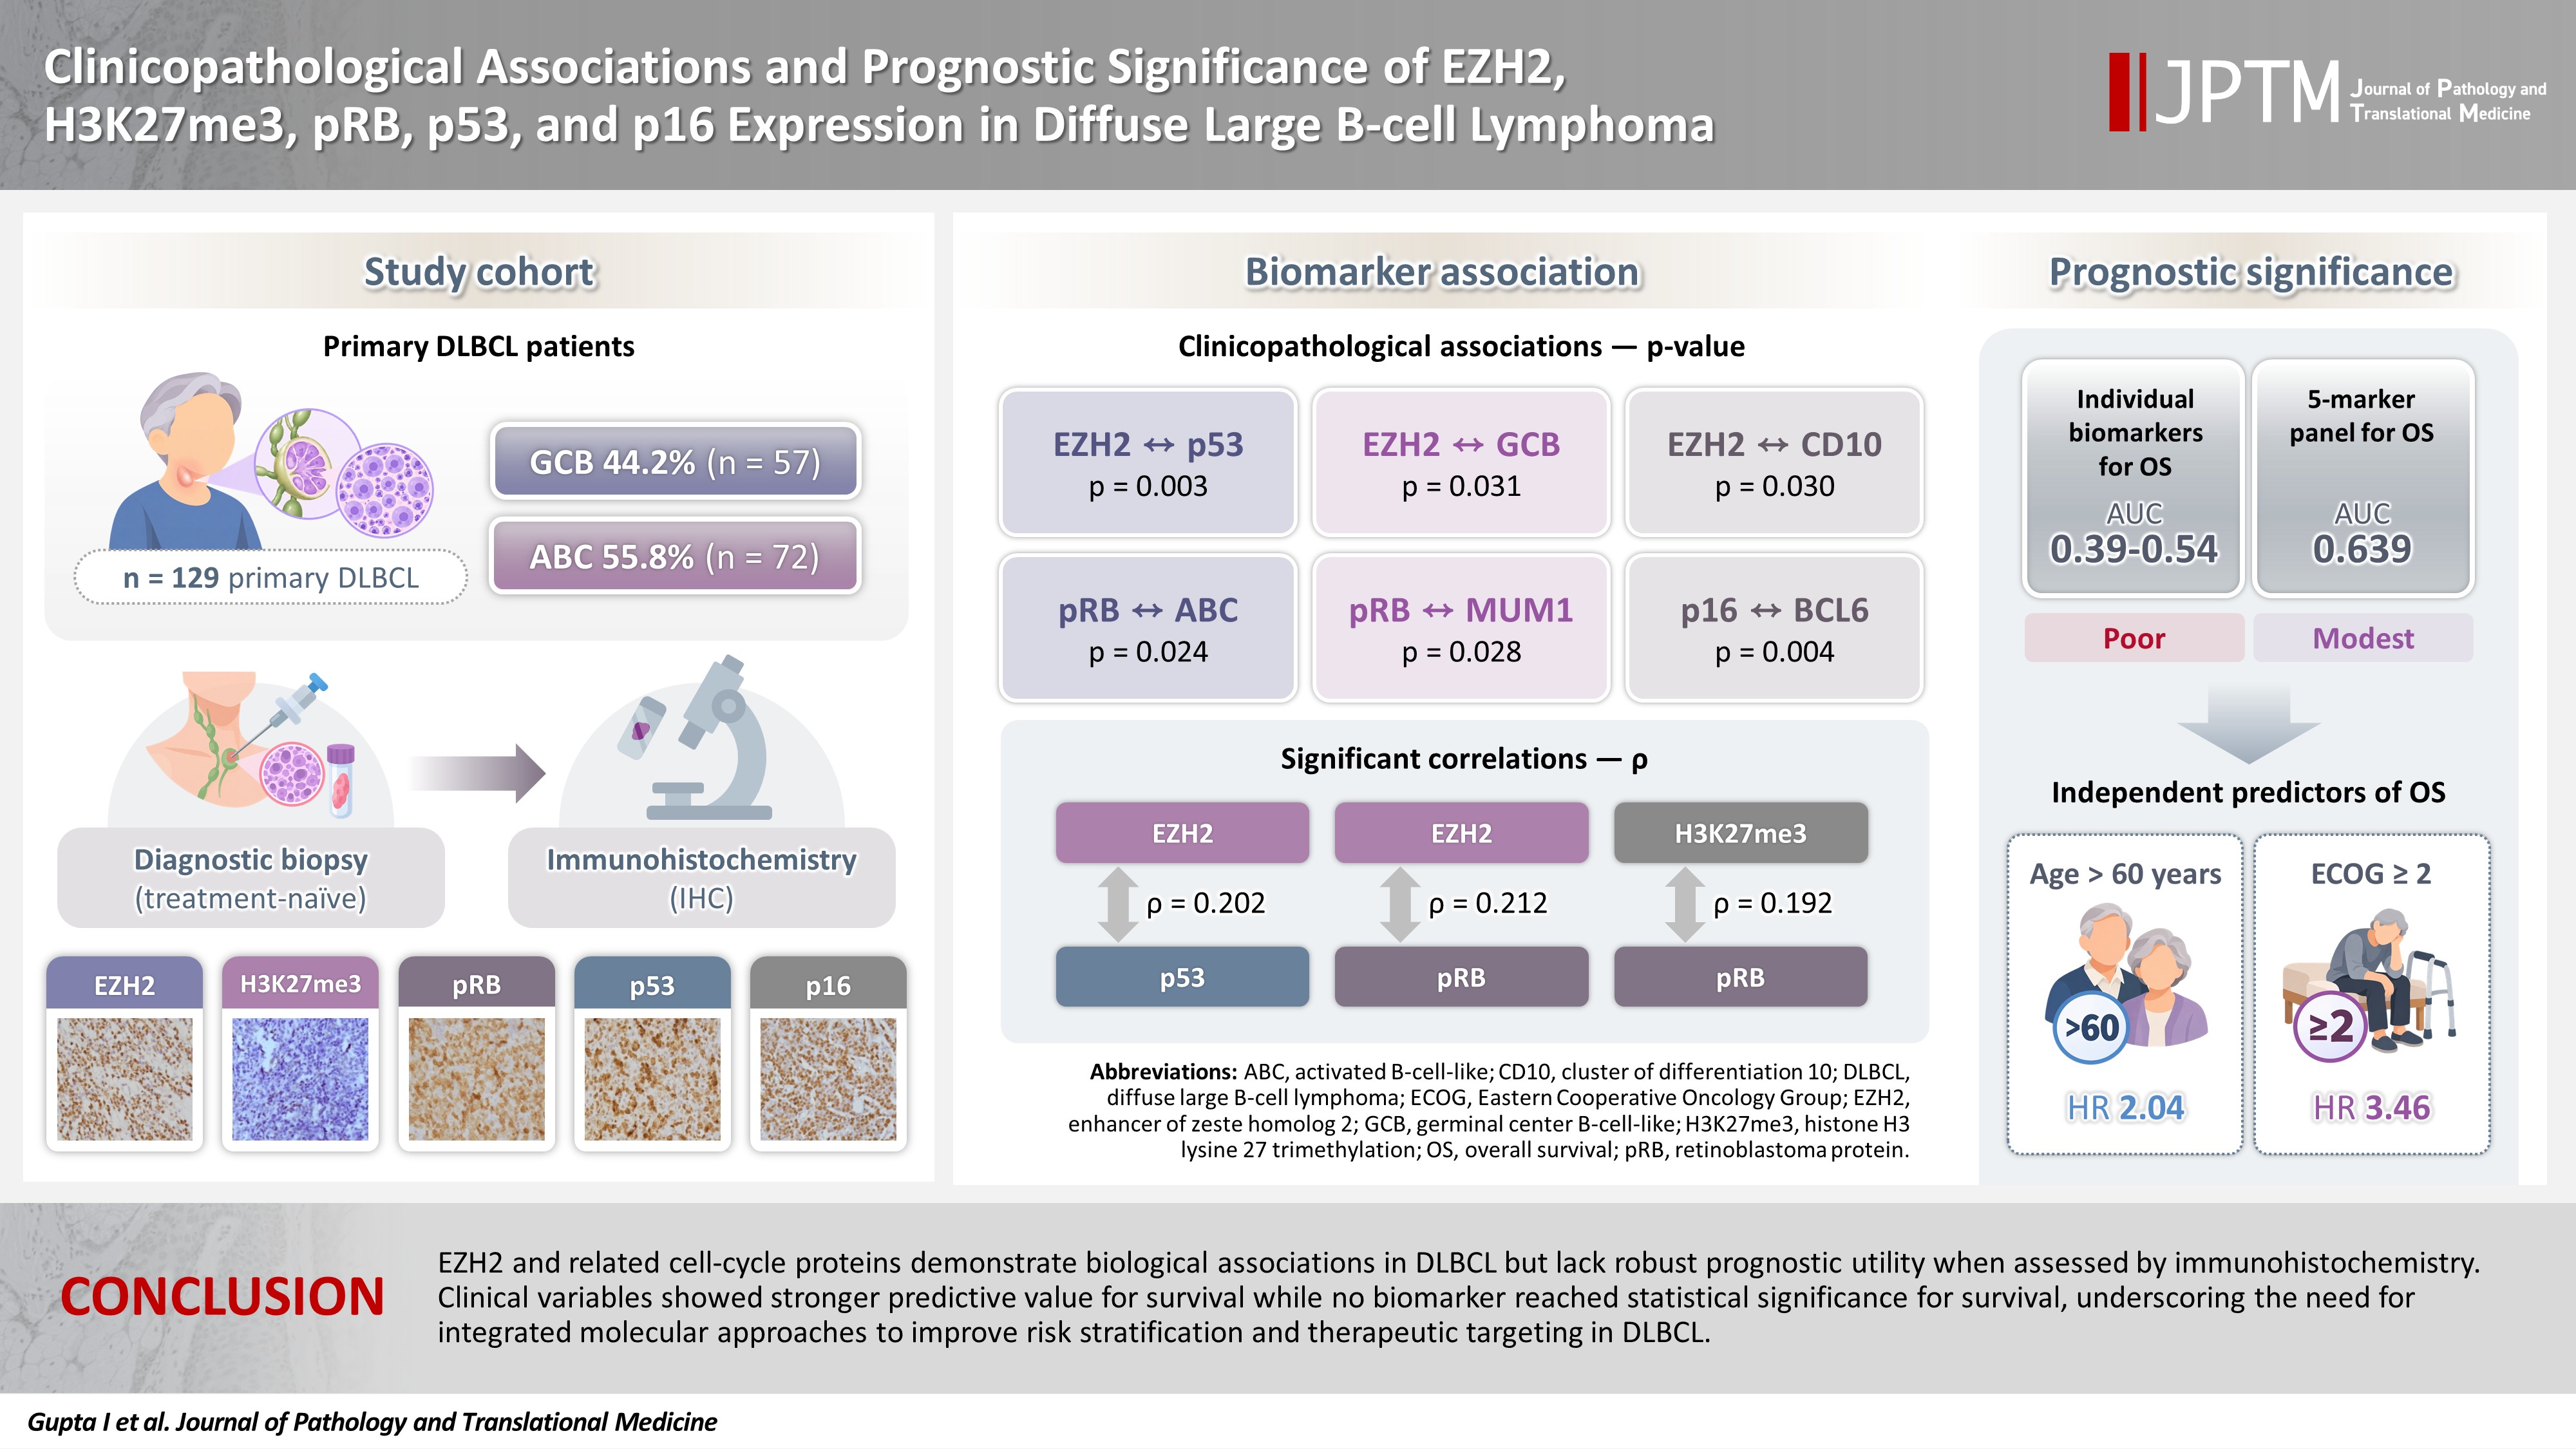

Fig. 1.
Fig. 2.
Fig. 3.
Fig. 4.
Graphical abstract
| Variable | p53 | EZH2 | p16 | H3K27me3 | pRB | |||||
|---|---|---|---|---|---|---|---|---|---|---|
| No. (%) | p-value | No. (%) | p-value | No. (%) | p-value | No. (%) | p-value | No. (%) | p-value | |
| Age > 60 yr | 25/45 (55.6) | .573 | 27/47 (57.4) | .715 | 12/41 (29.3) | .367 | 40/47 (85.1) | .663 | 28/42 (66.7) | .156 |
| Female sex | 24/45 (53.3) | .317 | 29/48 (60.4) | .877 | 11/46 (23.9) | .927 | 39/48 (81.3) | .649 | 33/48 (68.8) | .250 |
| Stage III/IV | 36/64 (56.3) | .492 | 36/69 (52.2) | .070 | 16/65 (24.6) | .945 | 56/69 (81.2) | .509 | 49/62 (79.0) | .229 |
| ECOG ≥ 2 | 24/47 (51.1) | .167 | 29/52 (55.8) | .512 | 10/46 (21.7) | .567 | 44/52 (84.6) | .702 | 39/47 (83.0) | .077 |
| IPI > 2 | 25/49 (51.0) | .151 | 29/54 (53.7) | .280 | 10/48 (20.8) | .434 | 44/54 (81.5) | .683 | 39/48 (81.3) | .148 |
| LDH high | 49/86 (57.0) | .673 | 51/91 (56.0) | .358 | 21/80 (26.3) | .428 | 76/91 (83.5) | .741 | 62/82 (75.6) | .484 |
| B symptoms | 40/66 (60.6) | .735 | 42/70 (60.0) | .909 | 15/65 (23.1) | .719 | 56/70 (80.0) | .293 | 50/63 (79.4) | .190 |
| Variable | p53 | EZH2 | p16 | H3K27me3 | pRB | |||||
|---|---|---|---|---|---|---|---|---|---|---|
| No. (%) | p-value | No. (%) | p-value | No. (%) | p-value | No. (%) | p-value | No. (%) | p-value | |
| p53 status (+) | - | 53/74 (71.6) | .003 | 17/72 (23.6) | .865 | 61/74 (82.4) | .782 | 54/69 (78.3) | .247 | |
| EZH2 status (+) | 53/76 (69.7) | .003 | - | 16/72 (22.2) | .499 | 68/78 (87.2) | .140 | 58/75 (77.3) | .342 | |
| pRB status (+) | 54/87 (62.1) | .247 | 58/90 (64.4) | .342 | 21/85 (24.7) | .758 | 77/90 (85.6) | .150 | - | |
| p16 status (+) | 17/28 (60.7) | .865 | 16/29 (55.2) | .499 | - | 23/29 (79.3) | .621 | 21/29 (72.4) | .758 | |
| H3K27me3 status (+) | 61/104 (58.7) | .782 | 68/109 (62.4) | .140 | 23/98 (23.5) | .621 | - | 77/100 (77.0) | .150 | |
| Subtype: GCB | 28/54 (51.9) | 40/57 (70.2) | 16/53 (30.2) | 45/57 (78.9) | 36/56 (64.3) | |||||
| Subtype: ABC | 45/69 (65.2) | .134 | 37/72 (51.4) | .031 | 12/64 (18.8) | .149 | 62/72 (86.1) | .283 | 52/63 (82.5) | .024 |
| CD10 (+) | 19/36 (52.8) | .243 | 28/38 (73.7) | .030 | 10/36 (27.8) | .358 | 31/38 (81.6) | .791 | 25/37 (67.6) | .323 |
| BCL6 (+) | 42/68 (61.8) | .702 | 44/71 (62.0) | .925 | 21/63 (33.3) | .004 | 60/71 (84.5) | .975 | 45/64 (70.3) | .617 |
| MUM1 (+) | 50/84 (59.5) | .966 | 49/87 (56.3) | .240 | 17/79 (21.5) | .114 | 74/87 (85.1) | .600 | 62/78 (79.5) | .028 |
| Outcome | p53 | EZH2 | p16 | H3K27me3 | pRB | |||||
|---|---|---|---|---|---|---|---|---|---|---|
| No. (%) | p-value | No. (%) | p-value | No. (%) | p-value | No. (%) | p-value | No. (%) | p-value | |
| Relapse (yes) | 23/41 (56.1) | .514 | 26/41 (63.4) | .532 | 11/40 (27.5) | .573 | 37/41 (90.2) | .101 | 32/40 (80.0) | .208 |
| OS status (dead) | 17/34 (50.0) | .201 | 21/35 (60.0) | .949 | 6/33 (18.2) | .330 | 31/35 (88.6) | .321 | 27/33 (81.8) | .251 |
| Biomarker | EZH2 | p53 | p16 | H3K27me3 | pRB |
|---|---|---|---|---|---|
| EZH2 | 0.202 |
−0.13 | 0.13 | 0.212* | |
| p53 | 0.202 |
0.06 | −0.12 | 0.16 | |
| p16 | −0.13 | 0.06 | −0.15 | −0.05 | |
| H3K27me3 | 0.13 | −0.12 | −0.15 | 0.192 |
|
| pRB | 0.212 |
0.16 | −0.05 | 0.192 |
None reached statistical significance. IHC, immunohistochemistry; ECOG, Eastern Cooperative Oncology Group; IPI, International Prognostic Index; LDH, lactate dehydrogenase.
For subtype GCB/ABC rows, the single p-value listed applies to the GCB-vs.-ABC comparison for that marker (shown on the ABC row). GCB, germinal center B-cell-like; ABC, activated B-cell-like.
None reached statistical significance. OS, overall survival.
p < .05.


