E-submission
Articles
- Page Path
- HOME > J Pathol Transl Med > Volume 48(4); 2014 > Article
-
Original Article
The Role of TWIST in Ovarian Epithelial Cancers - Kyungbin Kim1, Eun Young Park2, Man Soo Yoon3, Dong Soo Suh3, Ki Hyung Kim3, Jeong Hee Lee1, Dong Hoon Shin1,2, Jee Yeon Kim1,2, Mee Young Sol1,2, Kyung Un Choi1,2
-
Korean Journal of Pathology 2014;48(4):283-291.
DOI: https://doi.org/10.4132/KoreanJPathol.2014.48.4.283
Published online: August 26, 2014
1Department of Pathology, Pusan National University Yangsan Hospital, Yangsan, Korea.
2Department of Pathology, Pusan National University School of Medicine, Yangsan, Korea.
3Department of Obstetrics and Gynecology, Pusan National University School of Medicine, Yangsan, Korea.
- Corresponding Author: Kyung Un Choi, M.D. Department of Pathology, Pusan National University School of Medicine, 49 Busandaehak-ro, Yangsan 626-815, Korea. Tel: +82-51-510-8050, Fax: +82-51-510-8040, 'kuchoi@pusan.ac.kr'
• Received: May 28, 2014 • Revised: July 3, 2014 • Accepted: July 17, 2014
© 2014 The Korean Society of Pathologists/The Korean Society for Cytopathology
This is an Open Access article distributed under the terms of the Creative Commons Attribution Non-Commercial License (http://creativecommons.org/licenses/by-nc/3.0/) which permits unrestricted non-commercial use, distribution, and reproduction in any medium, provided the original work is properly cited.
Abstract
-
Background
- Epithelial-mesenchymal transition (EMT) is associated with tumor hypoxia. EMT is regulated, in part, by the action of TWIST, which inhibits of E-cadherin expression and may interfere with the p53 tumor-suppressor pathway.
-
Methods
- We examined the expression of TWIST, E-cadherin, hypoxia-inducible factor 1α (HIF1α), and p53 by immunohistochemistry in 123 cases of ovarian epithelial cancers (OEC) to evaluate the role of TWIST in OEC. We assessed the association between protein expression and clinicopathologic parameters.
-
Results
- The expression of TWIST, E-cadherin, HIF1α, and p53 proteins was found in 28.5%, 51.2%, 35.0%, and 29.3% of cases, respectively. TWIST expression was associated with higher histologic grade and unfavorable survival. TWIST expression was correlated with HIF1α expression and reduced E-cadherin expression. The altered HIF1α/TWIST/E-cadherin pathway was associated with lower overall survival (OS), while the co-expression of TWIST and p53 was correlated with lower progression-free survival. In the multivariate analyses, TWIST expression was an independent prognostic factor for OS.
-
Conclusions
- Our data imply that TWIST expression could be a useful predictor of unfavorable prognosis for OEC. TWIST may affect the p53 tumor-suppressor pathway. Moreover, hypoxia-mediated EMT, which involves the HIF1α/TWIST/E-cadherin pathway may play an important role in the progression of OEC.
- Patients and tissue samples
- The OEC tissue samples were obtained during surgical operations performed at Pusan National University Hospital, Korea, from 1999 to 2008. A total of 123 patients (mean age, 49.5 years; range, 15 to 82 years) who underwent surgical resection for OEC were examined. Pathological data, such as pathologic stage, tumor grading, tumor size, mitosis, and histological tumor type, were obtained from the primary pathology reports, and patient chart reviews were performed retrospectively. Histologic tumor type and grade were determined according to the World Health Organization criteria. The criteria of the International Federation of Gynecology and Obstetrics (FIGO) were used to classify cases as stages I-IV. All patients, except those with grade 1, stage IA, were given adjuvant chemotherapy of platinum/taxol-containing drugs. The patients were followed up from the date of surgery until death or the last visit to the outpatient department. The follow-up period ranged from one to 175 months (median, 49 months). Overall survival (OS) was calculated from the date of surgery to the date of death or last followup visit. Progression-free survival (PFS) was calculated from the date of surgery to the date of tumor progression or relapse, including local recurrence and/or metastasis. The patients' demographic and tumor characteristics are presented in Table 1. This study was approved by the Ethics Committee of the Pusan National University Hospital, and informed consent was obtained from all the patients.
- Immunohistochemistry
- Immunohistochemistry was performed on serial 4-µm-thick paraffin sections. The slides were deparaffinized in xylene and rehydrated through four decreasing grades of ethanol (100%, 95%, 80%, and 70%) for 2 minutes each. Endogenous peroxidase activity was blocked by immersing the slides in 3% hydrogen peroxide in methanol for 15 minutes at room temperature. Heat-induced antigen retrieval was performed for 5 minutes with 1× citrate buffer (pH 6.3) using a microwave and then cooled for 5 minutes. This process was performed three times. In order to reduce the nonspecific binding of antibodies to the tissues, the slides were preincubated with blocking serum in 1% bovine serum albumin for 30 minutes at room temperature. The slides were left to incubate with rabbit polyclonal anti-TWIST antibody (1:200, Santa Cruz Biotechnology, San Diego, CA, USA), mouse monoclonal anti-E-cadherin antibody (1:400, Invitrogen, Carlsbad, CA, USA), mouse monoclonal anti-HIF1α antibody (1:1,000, Novus Biologicals, Littleton, CO, USA), and rabbit monoclonal anti-p53 antibody (1:200, Thermo Scientific, San Jose, CA, USA) overnight at 4℃. After incubation with the primary antibodies, the slides were rinsed with phosphate-buffered saline for 10 minutes. Thereafter, for the detection of the antibody reactions, the EnVision Detection System (Dako, Carpinteria, CA, USA) was used. The color was developed using diaminobenzidine. Finally, the sections were counterstained with Mayer's hematoxylin solution for 1 minute, and dehydrated with graded alcohols, dipped in two changes of xylene, and mounted.
- Assessment of immunohistochemical staining
- The immunohistochemical staining was assessed with a light microscope by two pathologists who had no prior knowledge of the clinical data. For TWIST and HIF1α, only nuclear staining was considered with a 10% cut-off value for positivity.7 For E-cadherin, membrane staining was graded from 0-3: 0, no staining or weak intensity in 10% of the tumor cells; 1, low intensity in 10% of the tumor cells; 2, moderate intensity in 10% of the tumor cells; and 3, strong intensity in 10% of the tumor cells. The cases were divided into two groups: preserved E-cadherin expression (score 3) or reduced E-cadherin expression (scores 0, 1, and 2).21 p53 was recognized through nuclear staining of the positive cells. The results were divided into two groups: positive (≥30% positive tumor cells) and negative (<30% positive tumor cells).25
- Statistical analysis
- All statistical analyses were performed using SPSS ver. 19.0 (IBM Co., Armonk, NY, USA). Pearson's chi-squared test was used to study the associations between the clinicopathological factors and immunohistochemical markers. The linear correlations for protein expression were assessed using the Sperman's rank test. OS was calculated from the date of surgery to the date of death or last follow-up visit to the outpatient department. PFS was calculated from the date of surgery to the date of tumor relapse or progression. Data on patients who had survived until the end of the observation period were censored at their last follow-up visit. Death from a cause other than ovarian cancer and cases lost to follow-up were considered censoring events. The effect of immunohistochemical markers on survival was assessed using Kaplan-Meier survival curves and a log-rank test. Multivariate survival analyses were calculated using Cox's proportional hazards model. For all the tests, a p-value ≤ .05 was considered to be significant.
MATERIALS AND METHODS
- Altered expression of HIF1α, E-cadherin, TWIST, and p53 in relation to clinicopathologic parameters
- Expression of HIF1α, TWIST, and p53 proteins was detected in 35 (28.5%), 43 (35.0%), and 36 (29.3%) of the 123 OEC cases, respectively. Reduced expression of E-cadherin was observed in 60 cases (48.8%). Specific staining for TWIST was observed in the nucleus of tumor cells, but in some cases, both nuclear and cytoplasmic staining was observed. There was little immunoreactivity for TWIST in the tumor stroma. E-Cadherin expression was membranous, and occasionally cytoplasmic. Representative images of immunostaining are shown in Fig. 1.
- TWIST expression was associated with higher histologic tumor grades (p=.004). Clear cell types exhibited TWIST expression more frequently than other histologic types, but this was not statistically significant (p=.240). Reduced E-cadherin expression was more commonly found in the advanced stages of OEC (38 of 60 cases, 63.3%) than the early stages (22 of 63 case, 34.9%) (p=.002). HIF1α showed different expression according to histologic tumor type but was not associated with any clinicopathological parameters. There was a statistically significant increase in the expression of p53 in serous-type OEC compared with other types (p=.000). There were also positive correlations between p53 and the histologic tumor grade, FIGO stage, and mitotic rate (Table 2).
- TWIST expression was significantly correlated with reduced E-cadherin expression (p=.000, correlation coefficient [c.c.]=-0.309) and increased HIF1α expression (p=.000, c.c.=0.532). TWIST expression was not correlated with the expression of p53 (p=.142, c.c.=0.168). There was a negative correlation between p53 expression and the reduced expression of E-cadherin (p=.041, c.c.=-0.219) (Table 3).
- Correlation between TWIST, E-cadherin, HIF1α, and p53 expressions and survival
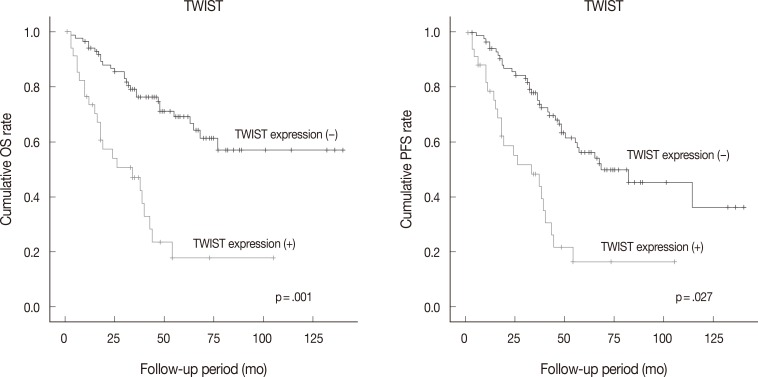
- Follow-up data were available for 123 patients (median, 49 months; range, 1 to 175 months). Fifty patients (40.7% of 123 patients) died from the disease during the follow-up period. Sixty patients (48.8%) developed either recurrence or metastasis (progression group), whereas 63 patients (51.2%) remained free of progression (progression-free group). The univariate analysis showed that tumor histologic grade, tumor stage, mitotic rate, positive expression of TWIST and p53, and reduced expression of E-cadherin were associated with poor OS and PFS. Serous type and tumor size were also correlated with poor PFS (Table 4, Fig. 2).
- We tried to explore whether the combined expression of these protein markers had any prognostic value. Eighteen of 27 patients (66.7%) who had a pattern of positive TWIST expression and reduced expression of E-cadherin [TWIST(+)/E-cadherin(-) group] died of disease, compared to 32 of 96 patients (33.3%) without a pattern of TWIST(+)/E-cadherin(-) (p=.003). Of 19 patients showing an altered HIF1α/TWIST/E-cadherin pathway with positive expression of HIF1α and TWIST, and reduced E-cadherin expression, 13 (68.4%) died of disease, whereas 37 of 104 patients (35.6%) without an altered HIF1α/TWIST/E-cadherin pathway died of disease (p=.011). Thirteen of 14 patients (92.9%) who displayed expression of both TWIST and p53 showed disease progression compared to 47 of 109 patients (43.1%) who had no expression of TWIST or p53. This difference was statistically significant (p=.000). In a multivariate analysis with the variables defined in Table 5, positive expression of TWIST was associated with lower OS after adjustment for histologic grade, tumor stage, mitotic rate, p53 expression, and altered expression of the HIF1α/TWIST/E-cadherin pathway, which were significant parameters in the univariate analysis.
RESULTS
- The EMT, which is considered to be one of the major mechanisms underlying tumor invasion and metastasis, has been studied to understand how epithelial cancer cells can acquire the ability to migrate and metastasize. EMT is triggered by a set of stimuli, which include hypoxia and growth factors, and tumor stromal cell interactions with transcription factors such as TWIST, SNAI1, SLUG, and ZWB1.4 TWIST overexpression has also been identified in various kinds of epithelial tumors and plays a distinct role in tumor progression via the loss of E-cadherin expression.6,7,8,9,10,11,12,13,14,15,16
- There have been a few other reports showing a correlation between TWIST expression and clinical significance in patients with OEC.8,9 These previous studies have examined the expression of TWIST in OEC cases, reporting immunohistochemical detection of TWIST expression in about 30-40% of cases. TWIST expression was correlated with clinicopathological parameters and found to be a predictor of poor survival. Hosono et al.8 also reported that positive TWIST expression was an independent prognostic factor for survival in their multivariate analyses. In this study of 123 OEC patients with follow-up, positive TWIST expression was detected in 35 of 123 OEC cases (28.5%). We found that TWIST expression was correlated with higher histologic grades and shorter OS and PFS in OEC patients, which is consistent with results from previous studies of other malignant tumors, including OEC. In the analysis of the histological type-stratified data, TWIST expression tended to be higher in the clear cell type of OEC (44.0%), although the difference was not significant (p=.240). Kajiyama et al.26 reported that TWIST expression was not only detected more frequently, but was also an independent prognostic factor in the clear cell type of OEC. They suggested that TWIST might play a role in the mechanisms for poor prognosis and chemoresistance in the clear cell type of OEC.
- p53 is a tumor suppressor gene that is involved in the regulation of cell growth. Mutations in the p53 gene are among the most commonly detected genetic abnormalities in human neoplasia. Mutations result in a conformational change in the protein, which becomes stabilized, thus usually, but not always, allowing for immunohistochemical detection. Although not fully defined, recent evidence has indicated that TWIST may interfere with the p53 tumor suppressor pathway.23,24 TWIST has previously been shown to reduce the activity of the p53 promoter as well as mediate suppression on p53 target sequences. Wang et al.18 demonstrated that increased TWIST was responsible for the development of acquired resistance to chemotherapeutic drugs and microtubule-disrupting agents, including paclitaxel. TWIST may protect from apoptosis mediated by p53 in response to DNA damage induced by radiation and drugs. Chemoresistance, as well as the facilitation of metastasis by TWIST, may be the underlying mechanism linking TWIST expression with an unfavorable prognosis. In this study, we found that p53 expression showed no correlation with TWIST expression, but an inverse correlation with E-cadherin expression was established. Interestingly, co-expression of TWIST and p53 (13/14 cases, 92.9%) showed unfavorable PFS compared with no co-expression (47/109 cases, 43.1%) (p=.000). These results suggest that TWIST and p53 could cooperate with each other to facilitate cancer progression, and p53 could have an important role in EMT.
- E-Cadherin plays a critical role in regulating the balance of cell-cell adhesion and cell motility, placing it in a significant position to regulate tumor cell proliferation and invasion. Some studies have identified that reduced E-cadherin expression is associated with more aggressive epithelial tumors.9,12,17,21 TWIST binds the E-cadherin promoter and inhibits E-cadherin transcription levels, which modulate EMT in cancer progression. An inverse correlation between TWIST upregulation and E-cadherin downregulation was also observed in several types of malignancies.5,10 However, Yoshida et al.27 demonstrated that there was not an inverse correlation between the expression of E-cadherin and TWIST in OEC. In this study, reduced E-cadherin expression was associated with advanced FIGO stage and poor OS and PFS. Our results are consistent with the observation that E-cadherin has been described in patients with advanced stage OEC and is associated with poor prognosis.9 Moreover, a significant inverse relationship was observed between these two markers in this study, and we showed that TWIST(+)/E-cadherin(-) cases are also associated with poor prognosis.
- For cancer progression, intratumoral hypoxia followed by the activation of HIF1α is one of the most important mechanisms promoting tumor aggressiveness, leading to metastasis and patient mortality. Recent results have shown the upregulation of mRNA and protein levels of TWIST in different cell lines under hypoxia and constitutive expression of HIF1α.19,20 TWIST can be a direct target of HIF1α due to the functional presence of a hypoxia-related element located in the proximal promoter of TWIST.20 The survival analysis in the aforesaid report demonstrated the worst prognosis and shortest metastasis-free period in HNSCC patients with HIF1α, TWIST, and Snail co-expression, indicating that the co-expression of these markers in tumor tissues could be used as a valuable marker to predict metastasis and prognosis in HNSCC patients. In a study by Feng et al.,21 the overexpression of HIF1α and TWIST was frequently detected in endometrial endometrioid carcinoma (EEC) samples, and they were associated with aggressive tumor characteristics, such as higher histologic grades, deeper myometrial invasion, and lymph node metastasis. The interesting findings of the study were that TWIST-positive cases exhibited increased expression of HIF1α and reduced expression of E-cadherin in EEC. The researchers suggested that the HIF1α/TWIST/E-cadherin pathway may play a critical role in the progression of EEC. Our study showed a positive association between HIF1α and TWIST expression (γ=0.407, p=.000) and a negative association between TWIST and E-cadherin expression (γ=-0.358, p=.000). Moreover, altered expression of the HIF1α/TWIST/E-cadherin pathway was associated with poor OS in OEC in the univariate analysis.
- In summary, we show that increased expression of TWIST, HIF1α, and p53 and reduced expression of E-cadherin are frequently observed in OEC cases. TWIST expression was associated with poor OS in both the univariate and multivariate analyses. Therefore, TWIST may serve as a useful marker in patients with OEC who are likely to have an unfavorable clinical outcome. Our results support the critical role of the HIF1α/TWIST/E-cadherin pathway in cancer progression and the acquisition of the metastatic phenotype in OEC. Therefore, pathways involved in hypoxia-mediated EMT, such as the HIF1α/TWIST/E-cadherin pathway, may be possible candidates for molecular targeting in the future treatment of OEC. Further studies are needed to clarify the role and molecular mechanisms underlying of the HIF1α/TWIST/E-cadherin pathway in tumor progression.
DISCUSSION
Acknowledgments
Acknowledgments
- 1. Siegel R, Ward E, Brawley O, Jemal A. Cancer statistics, 2011: the impact of eliminating socioeconomic and racial disparities on premature cancer deaths. CA Cancer J Clin 2011; 61: 212–236. PMID: 21685461. ArticlePubMed
- 2. Naora H, Montell DJ. Ovarian cancer metastasis: integrating insights from disparate model organisms. Nat Rev Cancer 2005; 5: 355–366. PMID: 15864277. ArticlePubMed
- 3. Friedlander ML. Prognostic factors in ovarian cancer. Semin Oncol 1998; 25: 305–314. PMID: 9633842. PubMed
- 4. Thiery JP, Sleeman JP. Complex networks orchestrate epithelial-mesenchymal transitions. Nat Rev Mol Cell Biol 2006; 7: 131–142. PMID: 16493418. ArticlePubMed
- 5. Yang J, Mani SA, Donaher JL, et al. Twist, a master regulator of morphogenesis, plays an essential role in tumor metastasis. Cell 2004; 117: 927–939. PMID: 15210113. ArticlePubMed
- 6. Puisieux A, Valsesia-Wittmann S, Ansieau S. A twist for survival and cancer progression. Br J Cancer 2006; 94: 13–17. PMID: 16306876. ArticlePubMedPMC
- 7. Markiewicz A, Ahrends T, Wełnicka-Jaśkiewicz M, et al. Expression of epithelial to mesenchymal transition-related markers in lymph node metastases as a surrogate for primary tumor metastatic potential in breast cancer. J Transl Med 2012; 10: 226PMID: 23157797. ArticlePubMedPMC
- 8. Hosono S, Kajiyama H, Terauchi M, et al. Expression of Twist increases the risk for recurrence and for poor survival in epithelial ovarian carcinoma patients. Br J Cancer 2007; 96: 314–320. PMID: 17211477. ArticlePubMedPMC
- 9. Terauchi M, Kajiyama H, Yamashita M, et al. Possible involvement of TWIST in enhanced peritoneal metastasis of epithelial ovarian carcinoma. Clin Exp Metastasis 2007; 24: 329–339. PMID: 17487558. ArticlePubMed
- 10. Kyo S, Sakaguchi J, Ohno S, et al. High Twist expression is involved in infiltrative endometrial cancer and affects patient survival. Hum Pathol 2006; 37: 431–438. PMID: 16564917. ArticlePubMed
- 11. Wallerand H, Robert G, Pasticier G, et al. The epithelial-mesenchymal transition-inducing factor TWIST is an attractive target in advanced and/or metastatic bladder and prostate cancers. Urol Oncol 2010; 28: 473–479. PMID: 19272800. ArticlePubMed
- 12. Lee JH, Park WY, Jeong SM, et al. Relationship between the endogenous hypoxic markers hypoxia inducible factor-1alpha, carbonic anhydrase IX, and epithelial mesenchymal transition regulator TWIST expression in non-small cell lung cancer. Korean J Pathol 2010; 44: 469–476. Article
- 13. Gao XH, Yang XQ, Wang BC, Liu SP, Wang FB. Overexpression of twist and matrix metalloproteinase-9 with metastasis and prognosis in gastric cancer. Asian Pac J Cancer Prev 2013; 14: 5055–5060. PMID: 24175775. ArticlePubMed
- 14. Arumugam T, Ramachandran V, Fournier KF, et al. Epithelial to mesenchymal transition contributes to drug resistance in pancreatic cancer. Cancer Res 2009; 69: 5820–5828. PMID: 19584296. ArticlePubMedPMC
- 15. Buehler D, Hardin H, Shan W, et al. Expression of epithelial-mesenchymal transition regulators SNAI2 and TWIST1 in thyroid carcinomas. Mod Pathol 2013; 26: 54–61. PMID: 22899291. ArticlePubMed
- 16. Jouppilä-Mattö A, Närkiö-Mäkelä M, Soini Y, et al. Twist and snai1 expression in pharyngeal squamous cell carcinoma stroma is related to cancer progression. BMC Cancer 2011; 11: 350PMID: 21834956. ArticlePubMedPMCPDF
- 17. Zhang Z, Xie D, Li X, et al. Significance of TWIST expression and its association with E-cadherin in bladder cancer. Hum Pathol 2007; 38: 598–606. PMID: 17258791. ArticlePubMed
- 18. Wang X, Ling MT, Guan XY, et al. Identification of a novel function of TWIST, a bHLH protein, in the development of acquired taxol resistance in human cancer cells. Oncogene 2004; 23: 474–482. PMID: 14724576. ArticlePubMed
- 19. Ruan K, Song G, Ouyang G. Role of hypoxia in the hallmarks of human cancer. J Cell Biochem 2009; 107: 1053–1062. PMID: 19479945. ArticlePubMed
- 20. Yang MH, Wu MZ, Chiou SH, et al. Direct regulation of TWIST by HIF-1alpha promotes metastasis. Nat Cell Biol 2008; 10: 295–305. PMID: 18297062. ArticlePubMed
- 21. Feng Z, Gan H, Cai Z, et al. Aberrant expression of hypoxia-inducible factor 1alpha, TWIST and E-cadherin is associated with aggressive tumor phenotypes in endometrioid endometrial carcinoma. Jpn J Clin Oncol 2013; 43: 396–403. PMID: 23372184. ArticlePubMed
- 22. O'Neill CJ, Deavers MT, Malpica A, Foster H, McCluggage WG. An immunohistochemical comparison between low-grade and high-grade ovarian serous carcinomas: significantly higher expression of p53, MIB1, BCL2, HER-2/neu, and C-KIT in high-grade neoplasms. Am J Surg Pathol 2005; 29: 1034–1041. PMID: 16006797. PubMed
- 23. Stasinopoulos IA, Mironchik Y, Raman A, Wildes F, Winnard P Jr, Raman V. HOXA5-twist interaction alters p53 homeostasis in breast cancer cells. J Biol Chem 2005; 280: 2294–2299. PMID: 15545268. ArticlePubMed
- 24. Maestro R, Dei Tos AP, Hamamori Y, et al. Twist is a potential oncogene that inhibits apoptosis. Genes Dev 1999; 13: 2207–2217. PMID: 10485844. ArticlePubMedPMC
- 25. Havrilesky L, Darcy KM, Hamdan H, et al. Prognostic significance of p53 mutation and p53 overexpression in advanced epithelial ovarian cancer: a Gynecologic Oncology Group Study. J Clin Oncol 2003; 21: 3814–3825. PMID: 14551300. ArticlePubMed
- 26. Kajiyama H, Hosono S, Terauchi M, et al. Twist expression predicts poor clinical outcome of patients with clear cell carcinoma of the ovary. Oncology 2006; 71: 394–401. PMID: 17690559. ArticlePubMed
- 27. Yoshida J, Horiuchi A, Kikuchi N, et al. Changes in the expression of E-cadherin repressors, Snail, Slug, SIP1, and Twist, in the development and progression of ovarian carcinoma: the important role of Snail in ovarian tumorigenesis and progression. Med Mol Morphol 2009; 42: 82–91. PMID: 19536615. ArticlePubMed
References
Fig. 1Expression of TWIST, hypoxia-inducible factor 1α (HIF1α), p53, and E-cadherin in ovarian epithelial cancer. TWIST (A, clear cell carcinoma), HIF1α (B, mucinous carcinoma), and p53 (C, serous carcinoma) are expressed in the nuclei of tumor cells, whereas E-cadherin (D, clear cell carcinoma) expression is lost.
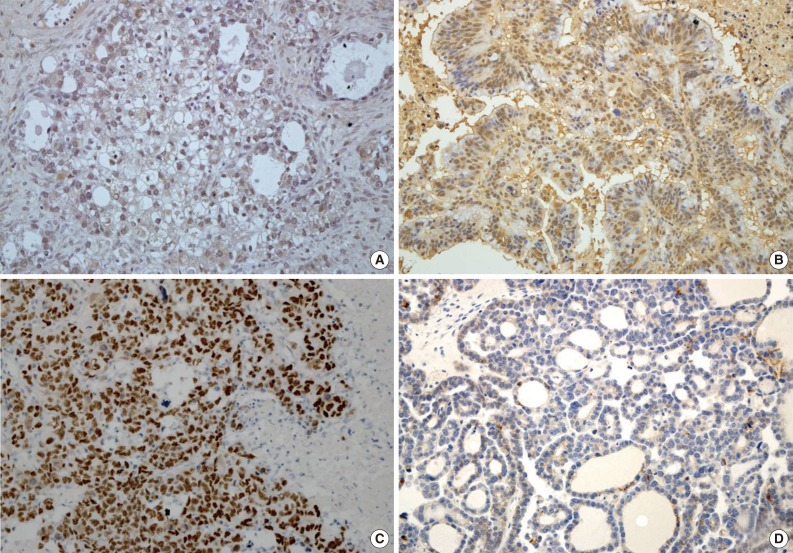
Fig. 2Kaplan-Meier analysis of overall survival (OS) and progression-free survival (PFS) in ovarian epithelial cancer according to the immunoexpression of TWIST. TWIST expression is associated with poorer OS and PFS.

Table 1.Clinicopathological features of the ovarian epithelial cancer patients
Table 2.Relationship between TWIST, HIF1α, p53, and E-cadherin with clinicopathological factors in patients with OEC (n=123)
Table 3.Correlation between TWIST, HIF1α, p53, and E-cadherin
| TWIST | E-cadherin | HIF1α | p53 | ||
|---|---|---|---|---|---|
| TWIST | p-value | - | .000 | .000 | .142 |
| c.c | - | – 0.309 | 0.532 | 0.168 | |
| E-Cadherin | p-value | - | - | .322 | .041 |
| c.c | - | - | – 0.157 | – 0.219 | |
| HIF1α | p-value | - | - | - | .611 |
| c.c | - | - | - | – 0.006 |
Table 4.Univariate analysis of various clinicopathological parameters and the immunoexpression of TWIST, HIF1α, p53, and E-cadherin in relation to overall survival (OS) and progression-free survival (PFS)
Table 5.Multivariate analysis of several clinicopathological factors in relation to the OS of patients with OEC
Figure & Data
References
Citations
Citations to this article as recorded by 
- E-Cadherin Expression in Relation to Clinicopathological Parameters and Survival of Patients with Epithelial Ovarian Cancer
Michal Kielbik, Izabela Szulc-Kielbik, Magdalena Klink
International Journal of Molecular Sciences.2022; 23(22): 14383. CrossRef - Oxygen sensing, mitochondrial biology and experimental therapeutics for pulmonary hypertension and cancer
Danchen Wu, Asish Dasgupta, Austin D. Read, Rachel E.T. Bentley, Mehras Motamed, Kuang-Hueih Chen, Ruaa Al-Qazazi, Jeffrey D. Mewburn, Kimberly J. Dunham-Snary, Elahe Alizadeh, Lian Tian, Stephen L. Archer
Free Radical Biology and Medicine.2021; 170: 150. CrossRef - Hypoxia-Induced Epithelial-Mesenchymal Transition in Cancers: HIF-1α and Beyond
Shing Yau Tam, Vincent W. C. Wu, Helen K. W. Law
Frontiers in Oncology.2020;[Epub] CrossRef - Expression of selected epithelial–mesenchymal transition transcription factors in serous borderline ovarian tumors and type I ovarian cancers
Pawel Sadlecki, Jakub Jóźwicki, Paulina Antosik, Marek Grabiec
Tumor Biology.2018; 40(6): 101042831878480. CrossRef - Expression and prognostic significance of epithelial-mesenchymal transition-related markers and phenotype in serous ovarian cancer
In Hye Song, Kyu-Rae Kim, Sehun Lim, Seok-Hyung Kim, Chang Ohk Sung
Pathology - Research and Practice.2018; 214(10): 1564. CrossRef - Transcription factors controlling E-cadherin down-regulation in ovarian cancer
Holly Russell, Md Zahidul Islam Pranjol
Bioscience Horizons: The International Journal of Student Research.2018;[Epub] CrossRef - Immunohistochemical expression of TWIST in oral squamous cell carcinoma and its correlation with clinicopathologic factors
Maryam Seyedmajidi, Safoura Seifi, Dariush Moslemi, Seyyedeh-Fatemeh Mozaffari, Hemmat Gholinia, Zahra Zolfaghari
Journal of Cancer Research and Therapeutics.2018; 14(5): 964. CrossRef - Activation of TWIST1 by COL11A1 promotes chemoresistance and inhibits apoptosis in ovarian cancer cells by modulating NF‐κB‐mediated IKKβ expression
Yi‐Hui Wu, Yu‐Fang Huang, Tzu‐Hao Chang, Cheng‐Yang Chou
International Journal of Cancer.2017; 141(11): 2305. CrossRef - MicroRNA-219-5p inhibits the proliferation, migration, and invasion of epithelial ovarian cancer cells by targeting the Twist/Wnt/β-catenin signaling pathway
Chunyan Wei, Xi Zhang, Sai He, Bianli Liu, Hongfang Han, Xuejun Sun
Gene.2017; 637: 25. CrossRef - Inhibition of proliferation and invasion of hepatocellular carcinoma cells by lncRNA-ASLNC02525 silencing and the mechanism
Zi Chen, Dongwen Xu, Tao Zhang
International Journal of Oncology.2017; 51(3): 851. CrossRef - Is overexpression of TWIST, a transcriptional factor, a prognostic biomarker of head and neck carcinoma? Evidence from fifteen studies
Xianlu Zhuo, Huanli Luo, Aoshuang Chang, Dairong Li, Houyu Zhao, Qi Zhou
Scientific Reports.2015;[Epub] CrossRef
 PubReader
 ePub Link
-
 Cite this Article
- Cite this Article
-
- Close
- Download Citation
- Close
- Figure
-