 E-submission
Articles
- Page Path
- HOME > J Pathol Transl Med > Volume 54(3); 2020 > Article
-
Original Article
Gene variant profiles and tumor metabolic activity as measured by FOXM1 expression and glucose uptake in lung adenocarcinoma -
Ashley Goodman1, Waqas Mahmud2
 , Lela Buckingham1,2
 -
Journal of Pathology and Translational Medicine 2020;54(3):237-245.
DOI: https://doi.org/10.4132/jptm.2020.02.08
Published online: March 4, 2020
1Rush University College of Health Sciences, Chicago, IL, USA
2Department of Pathology, Rush University Medical Center, Chicago, IL, USA
- Corresponding Author: Lela Buckingham, PhD, Department of Pathology, Rush University Medical Center, Chicago, IL 60612, USA Tel: +1-312-942-2814, Fax: +1-312-942-7781, E-mail: LelaBArnell@gmail.com
© 2020 The Korean Society of Pathologists/The Korean Society for Cytopathology
This is an Open Access article distributed under the terms of the Creative Commons Attribution Non-Commercial License (http://creativecommons.org/licenses/by-nc/4.0) which permits unrestricted non-commercial use, distribution, and reproduction in any medium, provided the original work is properly cited.
Abstract
-
Background
- Cancer cells displaying aberrant metabolism switch energy production from oxidative phosphorylation to glycolysis. Measure of glucose standardized uptake value (SUV) by positron emission tomography (PET), used for staging of adenocarcinoma in high-risk patients, can reflect cellular use of the glycolysis pathway. The transcription factor, FOXM1 plays a role in regulation of glycolytic genes. Cancer cell transformation is driven by mutations in tumor suppressor genes such as TP53 and STK11 and oncogenes such as KRAS and EGFR. In this study, SUV and FOXM1 gene expression were compared in the background of selected cancer gene mutations.
-
Methods
- Archival tumor tissue from cases of lung adenocarcinoma were analyzed. SUV was collected from patient records. FOXM1 gene expression was assessed by quantitative reverse transcriptase polymerase chain reaction (qRT-PCR). Gene mutations were detected by allele-specific PCR and gene sequencing.
-
Results
- SUV and FOXM1 gene expression patterns differed in the presence of single and coexisting gene mutations. Gene mutations affected SUV and FOXM1 differently. EGFR mutations were found in tumors with lower FOXM1 expression but did not affect SUV. Tumors with TP53 mutations had increased SUV (p = .029). FOXM1 expression was significantly higher in tumors with STK11 mutations alone (p < .001) and in combination with KRAS or TP53 mutations (p < .001 and p = .002, respectively).
-
Conclusions
- Cancer gene mutations may affect tumor metabolic activity. These observations support consideration of tumor cell metabolic state in the presence of gene mutations for optimal prognosis and treatment strategy.
- Patient samples
- Analysis of archival tissue in the current study was approved by the Rush University Institutional Review Board (IRB#1212 1202). Participants were deidentified before group statistical analyses. Patient samples consisted of formalin-fixed paraffin-embedded tissue from 301 patients with adenocarcinoma NSCLC (stage I–III) treated at Rush Medical Center through surgical resection and no adjuvant therapy. The study includes cases of adenocarcinoma only.
- PET analysis
- Tumor metabolic activity was assessed by measure of glucose metabolism (rate of consumption of glucose) through accumulation of FDG. Benign and malignant tumors differ in FDG SUV measured by PET. PET data, measured from tumor tissue prior to surgery, was collected from electronic medical records. When the tumors are imaged by PET, a minimum (PET Min) and maximum (PET Max) density of FDG is reported for the tissue regions scanned. A high (PET Max) and low (PET Min) density was recorded for 301 patients (Table 1). PET Max is considered the maximum SUV of the tissue.
- Gene expression analysis
- The amount of mRNA expression of the FOXM1 gene was measured in tumor and non-malignant lung tissue in all patient samples with available corresponding sample material. Hematoxylin and eosin-stained 4-micron sections were reviewed by a pathologist to distinguish tumor and non-malignant tissue for each sample. Tissue was then macro-dissected from the adjacent unstained slide and the RNA extracted using the RecoverAll Total Nucleic Acid Isolation Kit (Ambion/Life Technologies, Austin, TX, USA) according to manufacturer’s directions.
- Ten microliters of the extracted RNA were converted to cDNA in a reaction mix (Thermo Fisher Scientific, Waltham, MA, USA) containing 5 µL 5× reaction buffer, 2 µL 0.1M DTT, 1 µL each of RNasin (40 units/µL) dNTPs (2.5 mM each) and Moloney virus reverse transcriptase (200 units/µL), yielding 20 µL total volume. Gene expression levels were then measured from the cDNA using TaqMan qRT-PCR. Two microliters of cDNA were mixed with 1.25 µL primer/probe mix (Integrated DNA Technologies, Coralville, IW, USA), 12.5 µL Universal Master Mix with passive reference dye (Roche Diagnostics/Sigma, Mannheim, Germany) brought to a final volume of 25 µL with nuclease-free water. The primers used for FOXM1 were F: 5'-GATGGCGAATTGTATCATGGC, R: 5'-GGAGGAAAAGGAGAATTGTCAC and probe: 5'-/56-FAM/CAGCGACAG/ZEN/ GTTAAGGTTGAGGAGC/ 3lABkFQ and those used for miR149 were F: 5'-CGTTGTTCCAGCTGCCCCAGC, R: 5'-GCTCCCAGGCCGGCGCC and probe: 5'-/56-FAM/AGACA/ ZEN/CGGAGCCAGA/ 3lABkFQ. In addition to well to well correction through the passive reference dye, the mRNA levels of the housekeeping gene, beta-2 microglobulin (B2M; Integrated DNA Technologies), were concurrently measured in duplicate samples as a cDNA input normalization control. For statistical analysis, target gene expression was normalized to the amount of B2M expression, to compensate for variability in the amount of tissue used and the input cDNA of each sample.
- Mutation status
- KRAS mutation status was measured from column purified, diluted tissue DNA using the Therascreen PCR method (Qiagen, Hilden, Germany) according to manufacturer’s directions. Further variant information was collected from a clinical next-generation sequencing panel of 500 genes (Foundation Medicine, Cambridge, MA, USA).
- Statistics
- Statistical analysis was performed using SPSS software ver. 18.0 (SPSS Inc., Chicago, IL, USA). Association between gene expression and tumor mutation status was analyzed using the independent T-test. Nonparametric data were analyzed by the Mann-Whitney U test. Association of dichotomized gene expression and mutation status with patient outcome (time to recurrence [TTR] and overall survival [OS]) was analyzed for significance using Kaplan-Meier survival curves.
- Ethics statement
- All procedures performed in the current study were approved by the Rush University Institutional Review Board (IRB#1212 1202, approved date 3/22/18) with a waiver of individual consent in accordance with the Common Rule (45CFR46, December 13, 2001) and any other governing regulations or subparts. The Institutional Federalwide Assurance Number is FWA000 00482 in accordance with the 1964 Helsinki declaration and its later amendments.
MATERIALS AND METHODS
- Patient demographics and PET activity
- FDG uptake reflects active glucose metabolism in tumor cells but is not constant across tumor tissue. PET Min and PET Max define the low and high metabolic activity of cells, respectively, for each tumor. PET Max is a measure of the maximum metabolic activity of the tumor. Nucleic acid was successfully extracted from 301 archival tissue samples for analysis (Table 1). Tested patients had an average age of 66.8 years (range, 40 to 92 years), were 44% male, and 77% ever smokers. Tumor PET activity was similar in demographic groups, except for marginally increased PET Min in tumors from male patients. It is noted that younger and older patients are not evenly represented in the patient group: 77% of patients were older than 60 years. PET Max (maximum SUV) was not significantly different by sex.
- Mutation status
- Mutation status was assessed by allele-specific PCR, Sanger sequencing and/or next-generation sequencing of tumor tissue (Table 1). EGFR mutations were present in 12% of cases. Fourteen percent of female patient tumors had EGFR mutations compared to 8% of male patient tumors. Exon 19 deletions (n= 15) and L858R point mutations (n=5) accounted for the majority of EGFR variants in this patient group.
- KRAS mutations present in 35% of cases were equally represented by sex (36% vs. 34% in females and males, respectively). Of the 105 KRAS mutations, the most common variants were G12C (n=42) and G12D (n=22), and G12V (n=20). TP53 is the most mutated gene in cancer and was the most frequently mutated gene in this patient group. TP53 mutation frequency was 42%, about equally represented in male (40%) and female (44%) patients. The spectrum of TP53 mutations fell mostly within the DNA binding domain of the protein.
- Chi-square analysis revealed significantly increased mutation frequency in smokers compared to non-smokers for KRAS (p=.042) and TP53 (p=.012). The reverse was true for EGFR, where 30% of non-smokers had EGFR mutated tumors, compared to 5% of those in smokers (p=.018). Older patients had increased KRAS mutations (p=.042).
- Metabolic activity as measured by SUV vs. gene mutation status
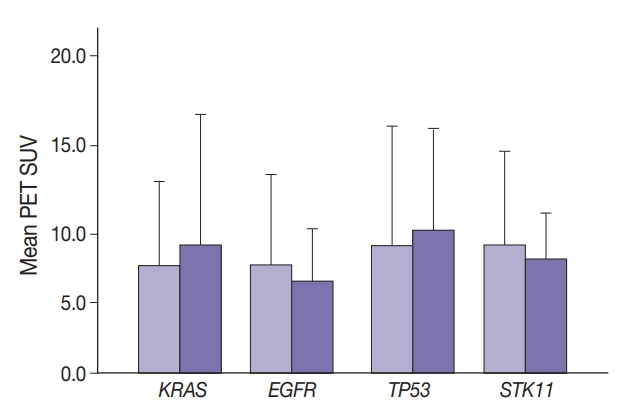
- Maximal SUV was assessed in tumor tissue. There was no significant difference in SUV with KRAS nor EGFR mutation compared to no mutation (p=.443) nor with any TP53 nor STK11 mutations (p=.114 and p=.191, respectively) (Fig. 1). Mutation status for all genes were grouped as “mutated” vs. “not mutated.” Similar grouping was done for STK11 due to the low number of STK11 mutant cases.
- Median SUV did not differ significantly among the most frequent KRAS mutations. For 170 wild-type, 31 G12C, 22 G12D, 19 G12V, and 14 other KRAS mutations, median SUV ranged from 6.4 (G12D) to 8.4 (G12V). Median SUV in the absence of any KRAS was 7.4.
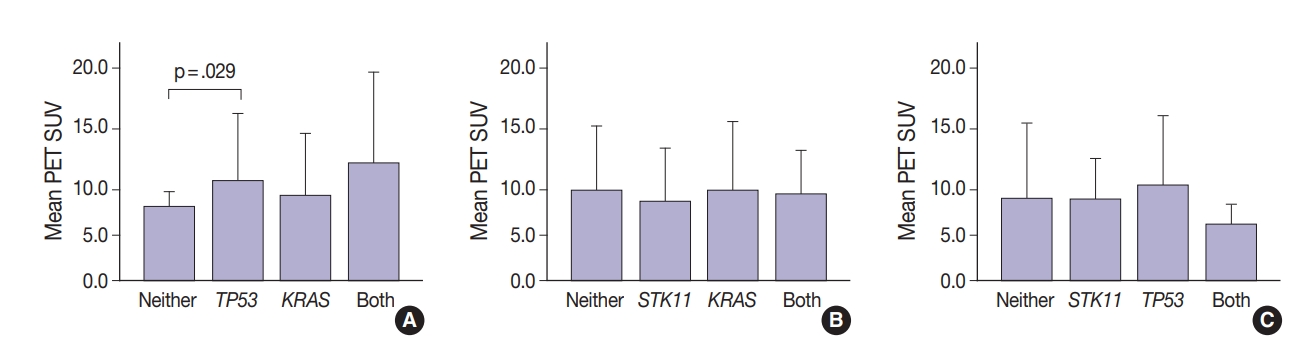
- Thirty-one tumors displayed mutations in more than one oncogene. Tumor metabolic activity measured by PET was compared in the presence of these mutation profiles (n=168) (Fig. 2). Tumors with co-existing KRAS and TP53 mutations showed higher metabolic activity (p=.029) (Fig. 2A). The presence of single KRAS and STK11 mutations vs. combinations showed no significant relationship to metabolic activity (Fig. 2B). FDG uptake was lower in the presence of STK11 mutations when TP53 mutations were present, but not significantly so (Fig. 2C).
- Metabolic activity as measured by FOXM1 gene expression
- The role of FOXM1 in glycolysis along with its tumor suppressor potential led to assessing its association with tumor metabolic activity. FOXM1 is epigenetically regulated, in part, by miRNA, specifically miR-149, the expression of which was also measured. The amount of FOXM1 and miR-149 expression in the tumor samples was assessed by quantitative reverse transcriptase PCR normalized to B2M expression. There was significantly higher FOXM1 expression in tumor tissue from older patients accompanied by half the miR-149 expression (chi-square p=.002) (Table 1).
- Compared to non-malignant tissue, FOXM1 transcription is increased in tumor cells. To confirm this, mRNA was isolated from adjacent non-malignant lung tissue to estimate endogenous FOXM1 expression before the oncogenic transformation. Only two of the 34 normal tissue samples tested were positive for FOXM1 expression (5.9%) indicating that expression differences were not likely due to differences in endogenous levels of gene expression between patients, but FOXM1 was specifically induced in and unique to the tumor cells (FOXM1/B2M% 8.65 tumor vs. 1.67 normal; p<.001).
- Because miR-149 negatively regulates FOXM1, an inverse expression pattern between the two genes might be expected. FOXM1 expression was inversely proportional to miR-149 expression, 13.6 FOXM1/B2M% with no detectable miR-149 expression versus 4.6 with miR-149 expression. If both gene activities were dichotomized (expressed/not expressed), cross-tabulation showed more cases of FOXM1 expressed when miR-149 was not detected, consistent with an inverse relationship which was also observed in dichotomized data for both genes (expressed/not expressed).
- FOXM1 expression in the tumor samples was compared to metabolic activity as measured by SUV from FDG-PET imaging. SUV (minimal and maximal) were higher with any FOXM1 expression compared to no detectable FOXM1 (avg. maximum SUV, 8.90 vs. 6.8 [p=.425]; avg. minimal SUV, 2.62 vs. 2.02 [p=.069] with and without FOXM1, respectively).
- FOXM1 gene expression and mutation status
- Marginally lower FOXM1 expression was observed in the presence of any EGFR mutations (Fig. 3), regardless of the mutation. No difference was observed in FOXM1 expression with KRAS nor TP53 mutated. There was significantly higher FOXM1 expression when STK11 was mutated than with no mutations (p<.001).
- Comparing FOXM1 expression and the different KRAS mutant subtypes, the G12V mutants had the highest median FOXM1 expression (2.8; range, 1.0 to 2.1), higher than the levels seen with wild-type KRAS (3.5; range, 0.0 to 9.0). G12C mutants had the lowest FOXM1 expression with a median of 0.16 (range, 0.0 to 10.5).
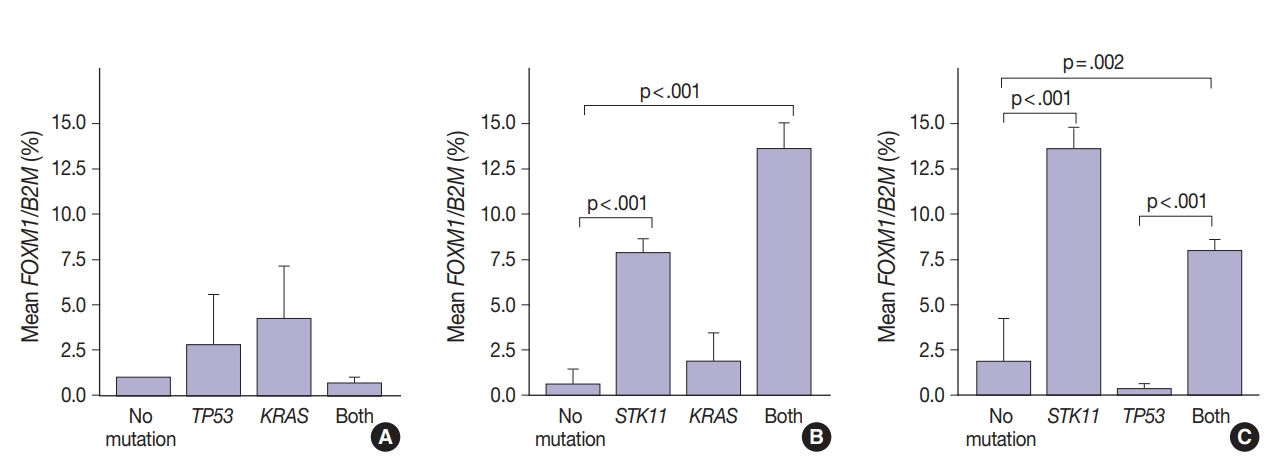
- FOXM1 expression patterns in the presence of multiple mutations were dissimilar to patterns seen with SUV for KRAS and TP53 mutations (compare Figs. 2 and 4). Tumors with KRAS and TP53 mutations had increased FOXM1 expression compared to no mutations or either mutation alone (Fig. 4A). In contrast, the presence of STK11 with KRAS mutations resulted in significantly higher levels of FOXM1 expression than with no mutation (p<.001) (Fig. 4B). A significant increase was seen in combination with TP53 versus no mutation and versus TP53 alone (p=.002 and p<.001, respectively) (Fig. 4C).
- Patient outcome studies
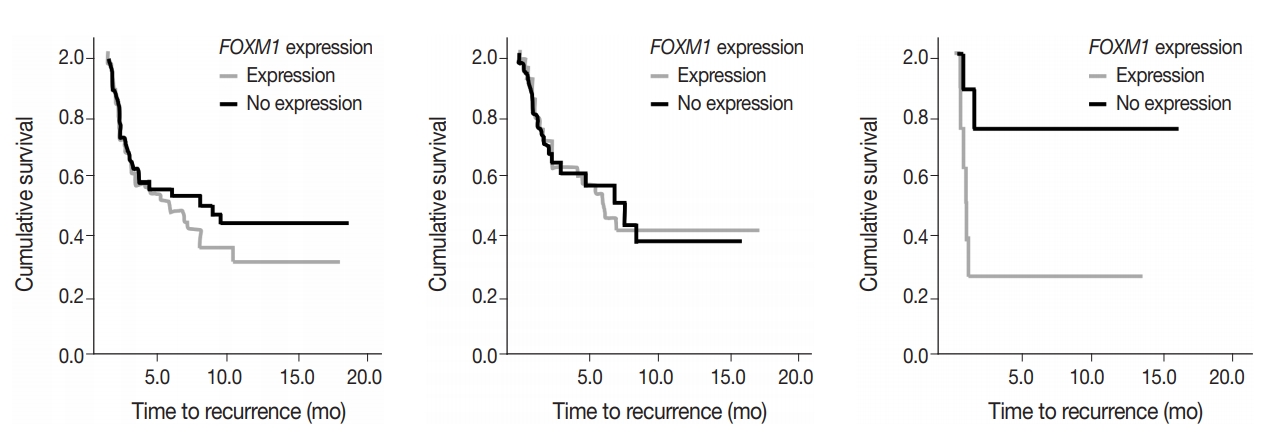
- To assess predictive value of metabolic state combined with mutational status, FOXM1 expression (any expression vs. no expression) in the tumor samples was compared to TTR and OS in early-stage surgically treated patients. There was no significant difference in OS and marginal decrease in TTR when FOXM1 was expressed versus not expressed. In cases with KRAS mutations, however, a significantly shortened TTR was observed when FOXM1 was expressed (24 months vs. median not reached, respectively; p=.033) (Fig. 5).
RESULTS
- Identification of somatic variants in tumors is essential in the prognosis and treatment strategy for lung adenocarcinoma. Tumor mutational and glycolytic status can vary in predicting treatment efficacy. The current study examined the relationship between tumor metabolic activity as measured by glucose uptake, gene expression in the glycolysis pathway and mutational status, with potential consequences on outcome.
- Frequencies of the selected mutations in this patient group: TP53 (42% of cases), KRAS (35% of cases), EGFR (12% of cases), and STK11 (10% of cases) reflected reported frequencies of these variants in lung cancer [16]. Co-existing mutations (among the four genes tested) was observed in 10% of cases. In previous studies, the presence of co-existing mutations such as TP53 and EGFR mutations in NSCLC were associated with inferior survival [2]. Others have observed that survival with chemotherapy was longer for patients without TP53 and KRAS mutations compared with patients with KRAS, TP53 mutations, or double mutant tumors [1,17].
- Glucose metabolism and the glycolysis pathway are dysregulated in lung cancer. This is a complex issue, with numerous factors involved, including tumor stage, co-morbidities, age, performance status, and tumor mutational state. Metabolic activity may not predict the presence of mutations in cancer genes, such as EGFR [18,19]. Consistent with these reports, no significant relationship between EGFR mutation status and SUV was observed in the current study. SUV was increased, however, with co-existing TP53 and KRAS mutations (p= .029) (Fig. 2). STK11 or any KRAS alone were also not related to tumor metabolic status as measured by maximum SUV. Significant differences in SUV in the presence of co-existing mutations were not observed. There was marginally decreased maximum SUV in tumors with co-existing KRAS+STK11 mutations (p=.141).
- In contrast, there was significantly increased glycolytic activity as measured by levels of FOXM1 expression in the presence of mutated STK11 (p<.001). Furthermore, tumors with co-existing TP53 or KRAS+STK11 mutations showed significantly increased FOXM1 expression (p=.002 and p<.001, respectively). FOXM1 is downregulated by TP53 through the FoxO3 transcription factor to slow DNA repair functions in cells with DNA damage. FoxO3 and FOXM1 transcription factors are also implicated in cancer initiation through metabolic programs [20].
- Reported higher levels of FOXM1 expression in oral cancer tumors with TP53 mutations than with wild-type TP53 were not observed here with lung adenocarcinoma [21]. One explanation for this difference is the effect of co-existing mutations, such as STK11. STK11 serine/threonine-protein kinase (also called LKB1) controls the activity of AMPK, to dampen cell metabolism. Human bronchial epithelial cells carrying mutated KRAS together with downregulated STK11 produced squamous cell carcinoma and adenosquamous cell carcinoma when injected into nude mice [15]. Furthermore, STK11-deficient lung tumors showed primary resistance to treatments that are effective to KRASG12D mutants [16,17]. These results show the potential heterogeneity in outcome of gene inactivation in NSCLC. Differences in PET and FOXM1 response in STK11+KRAS mutant tumors complicate coordination of tumor progression with metabolic adaptation by gene (STK11 and KRAS) inactivation. FOXM1 protein is activated by KRAS which is one of its downstream effectors. STK11 may also down-regulate KRAS activity.
- Adding to the complexity are differences in SUV and FOXM1 expression levels in the presence of the KRAS mutant subtypes suggesting that the mutant proteins produced could behave differently within the tumor cells and act through different pathways (causing differences in the progression and/or severity of the disease). The particular point mutation can change the overall stoichiometry of the encoded protein altering the proteins native interactions and normal effects on the cell. These mutation subtypes also interact differently with FOXM1, leading to varying levels of expression and activation.
- Expression of the FOXM1 transcription factor gene is highly correlated with the glycolytic pathway. Its expression was observed to be significantly higher in tumor tissue than in non-malignant tissue. PET SUV (also correlated with malignancy) trended lower when FOXM1 was not expressed than with any FOXM1 expression. Furthermore, FOXM1 expression is under epigenetic control, in part, as a target of miR-149. In this study minimum and maximum SUV trended lower when FOXM1 was not expressed than with any FOXM1 expression.
- FOXM1 expression on its own did not have a significant effect on patient survival (p=.875) nor tumor recurrence (p=.274), but did have a significant negative effect on TTR in patients who also expressed mutant KRAS. The effect of FOXM1 expression on tumor recurrence in cases with KRAS mutations (Fig. 5), suggests that FOXM1 expression may have a minor effect on the tumor phenotype, but could still be a viable prognostic factor, especially in the presence of other cancer gene mutations [22]. The phosphatidylinositol 3-kinase pathway signals growth and survival and helps drive the glycolytic phenotype of cancer cells by increasing cellular glucose uptake and glycolysis [23]. HNSCC patients with high levels of FOXM1 expression in the presence of TP53 mutations have been observed to have poor survival outcomes [21]. The presence of FOXM1 expression could indicate a higher chance of tumor recurrence, which can then be used by a provider when deciding on the intensity of the course of treatment [24,25].
- These observations are limited to the four genes investigated in this study. The effects of co-existing mutations suggest that cancer cells with high tumor mutational burden (coding somatic mutations/Mb of tumor DNA) may have further differences in metabolic characteristics. Tumor mutational burden also affects immune characteristics of tumors which contribute to recurrence and survival following treatment. Further studies with more comprehensive mutational analysis would address this question.
- With the effects of mutation state on FOXM1 expression, further studies on outcome were performed comparing FOXM1 expression and outcome. STK11 mutations were significantly related to increased FOXM1 expression; however, numbers were not sufficient for analysis. Although measurement of FOXM1 gene expression is not currently a practical method for tumor assessment, its comparison to PET activity shows a degree of complexity in metabolic activity in tumor cells with and without mutations. The effect of KRAS mutations on outcome with and without FOXM1 expression suggests that both metabolic and mutational status affect tumor characteristics, and predicted patient outcome.
DISCUSSION
Author contributions
Conceptualization: AG, LB, WM.
Data curation: AG, LB, WM.
Formal analysis: AG, LB, WM.
Funding acquisition: LB.
Investigation: AG, LB, WM.
Methodology: AG, LB, WM.
Project administration: LB.
Resources: LB, WM.
Software: AG, LB, WM.
Supervision: LB.
Validation: WM.
Visualization: AG, LB, WM
Writing—original draft: AG.
Writing—review & editing: WM, LB.
Conflicts of Interest
The authors declare that they have no potential conflicts of interest.
Funding
This work was supported departmental funds (Rush University Medical Center, Department of Pathology and College of Health Sciences).

|
|
SUV |
Gene expressiona FOXM1/miR-149 |
Mutation status, n (%)b |
|||||
|---|---|---|---|---|---|---|---|---|
| No. | PET Min | PET Max | EGFR | KRAS | STK11 | TP53 | ||
| Total | 301 | 2.47 ± 1.44 | 8.85 ± 6.69 | 3.11 ± 4.69/3.92 ± 9.84 | 32/267 (12) | 105/296 (35) | 17/173 (10) | 73/173 (42) |
| Sex | ||||||||
| Female | 168 | 2.33 | 8.79 | 1.83/5.94 | 22/152 | 61/167 | 7/99 | 40/99 |
| Male | 133 | 2.65 | 8.93 | 4.38/1.39 | 9/115 | 42/123 | 10/73 | 32/73 |
| p-value | .077 | .867 | .055 | .661 | .675 | .150 | .652 | |
| Age (yr) | ||||||||
| < 60 | 70 | 2.48 | 8.99 | 0.76/3.30 | 9/53 | 17/69 | 4/42 | 20/42 |
| > 60 | 231 | 2.47 | 8.82 | 17.3/2.25 | 22/212 | 85/227 | 13/126 | 51/128 |
| p-value | .973 | .857 | .002 | .181 | .050 | .882 | .462 | |
| Smokingc | ||||||||
| Ever | 56 | 2.16 | 10.3 | -/0.00 | 2/40 | 24/53 | 8/53 | 34/53 |
| Non-smoker | 17 | 1.87 | 8.62 | -/2.84 | 3/10 | 3/17 | 0/17 | 5/17 |
| p-value | .527 | .529 | - | .018 | .042 | .089 | .012 | |
- 1. Tomasini P, Mascaux C, Jao K, et al. Effect of coexisting KRAS and TP53 mutations in patients treated with chemotherapy for non-small-cell lung cancer. Clin Lung Cancer 2019; 20: e338-45. ArticlePubMed
- 2. Aggarwal C, Davis CW, Mick R, et al. Influence of TP53 mutation on survival in patients with advanced EGFR-mutant non-small-cell lung cancer. JCO Precis Oncol 2018 Aug 31 https://doi.org/10.1200/PO.18.00107. Article
- 3. Ding M, Li F, Wang B, Chi G, Liu H. A comprehensive analysis of WGCNA and serum metabolomics manifests the lung cancer-associated disordered glucose metabolism. J Cell Biochem 2019; 120: 10855-63. ArticlePubMedPDF
- 4. Cairns RA, Harris IS, Mak TW. Regulation of cancer cell metabolism. Nat Rev Cancer 2011; 11: 85-95. ArticlePubMedPDF
- 5. Soga T. Cancer metabolism: key players in metabolic reprogramming. Cancer Sci 2013; 104: 275-81. ArticlePubMedPMC
- 6. Park HL, Yoo IR, Boo SH, et al. Does FDG PET/CT have a role in determining adjuvant chemotherapy in surgical margin-negative stage IA non-small cell lung cancer patients? J Cancer Res Clin Oncol 2019; 145: 1021-6. ArticlePubMedPDF
- 7. Brun C, Gay P, Cottier M, et al. Comparison of cytology, chest computed and positron emission tomography findings in malignant pleural effusion from lung cancer. J Thorac Dis 2018; 10: 6903-11. ArticlePubMedPMC
- 8. Vander Heiden MG, Cantley LC, Thompson CB. Understanding the Warburg effect: the metabolic requirements of cell proliferation. Science 2009; 324: 1029-33. ArticlePubMedPMC
- 9. Cui J, Shi M, Xie D, et al. FOXM1 promotes the warburg effect and pancreatic cancer progression via transactivation of LDHA expression. Clin Cancer Res 2014; 20: 2595-606. ArticlePubMedPMCPDF
- 10. Liao GB, Li XZ, Zeng S, et al. Regulation of the master regulator FOXM1 in cancer. Cell Commun Signal 2018; 16: 57.ArticlePubMedPMCPDF
- 11. He Y, Yu D, Zhu L, Zhong S, Zhao J, Tang J. miR-149 in human cancer: a systemic review. J Cancer 2018; 9: 375-88. ArticlePubMedPMC
- 12. Xu K, Liu X, Mao X, et al. MicroRNA-149 suppresses colorectal cancer cell migration and invasion by directly targeting forkhead box transcription factor FOXM1. Cell Physiol Biochem 2015; 35: 499-515. ArticlePubMedPDF
- 13. Wierstra I, Alves J. FOXM1, a typical proliferation-associated transcription factor. Biol Chem 2007; 388: 1257-74. ArticlePubMed
- 14. Wang IC, Ustiyan V, Zhang Y, Cai Y, Kalin TV, Kalinichenko VV. FOXM1 transcription factor is required for the initiation of lung tumorigenesis by oncogenic KRAS(G12D.). Oncogene 2014; 33: 5391-6. ArticlePubMedPDF
- 15. Wang IC, Snyder J, Zhang Y, et al. FOXM1 mediates cross talk between KRAS/mitogen-activated protein kinase and canonical Wnt pathways during development of respiratory epithelium. Mol Cell Biol 2012; 32: 3838-50. ArticlePubMedPMCPDF
- 16. Catalogue of Somatic Mutations in Cancer (COSMIC) [Internet]. Hinxton: Wellcome Sanger Institute, 2020 [cited 2020 Feb 2]. Available from: https://cancer.sanger.ac.uk/cosmic.
- 17. Arbour KC, Jordan E, Kim HR, et al. Effects of co-occurring genomic alterations on outcomes in patients with KRAS-mutant nonsmall cell lung cancer. Clin Cancer Res 2018; 24: 334-40. ArticlePubMedPDF
- 18. Zhu L, Yin G, Chen W, et al. Correlation between EGFR mutation status and F(18) -fluorodeoxyglucose positron emission tomography-computed tomography image features in lung adenocarcinoma. Thorac Cancer 2019; 10: 659-64. ArticlePubMedPMCPDF
- 19. Kim HS, Mendiratta S, Kim J, et al. Systematic identification of molecular subtype-selective vulnerabilities in non-small-cell lung cancer. Cell 2013; 155: 552-66. ArticlePubMed
- 20. Saavedra-Garcia P, Nichols K, Mahmud Z, Fan LY, Lam EW. Unravelling the role of fatty acid metabolism in cancer through the FoxO3-FOXM1 axis. Mol Cell Endocrinol 2018; 462: 82-92. ArticlePubMed
- 21. Tanaka N, Zhao M, Tang L, et al. Gain-of-function mutant p53 promotes the oncogenic potential of head and neck squamous cell carcinoma cells by targeting the transcription factors FoxO3a and FOXM1. Oncogene 2018; 37: 1279-92. ArticlePubMedPDF
- 22. Shimamura T, Chen Z, Soucheray M, et al. Efficacy of BET bromodomain inhibition in KRAS-mutant non-small cell lung cancer. Clin Cancer Res 2013; 19: 6183-92. ArticlePubMedPDF
- 23. Kompier LC, Lurkin I, van der Aa MN, van Rhijn BW, van der Kwast TH, Zwarthoff EC. FGFR3, HRAS, KRAS, NRAS and PIK3CA mutations in bladder cancer and their potential as biomarkers for surveillance and therapy. PLoS One 2010; 5: e13821. ArticlePubMedPMC
- 24. He SY, Shen HW, Xu L, et al. FOXM1 promotes tumor cell invasion and correlates with poor prognosis in early-stage cervical cancer. Gynecol Oncol 2012; 127: 601-10. ArticlePubMed
- 25. Wang IC, Meliton L, Ren X, et al. Deletion of Forkhead Box M1 transcription factor from respiratory epithelial cells inhibits pulmonary tumorigenesis. PLoS One 2009; 4: e6609. ArticlePubMedPMC
REFERENCES
Figure & Data
References
Citations
- Prognostic value of combining clinical factors, 18F-FDG PET-based intensity, volumetric features, and deep learning predictor in patients with EGFR-mutated lung adenocarcinoma undergoing targeted therapies: a cross-scanner and temporal validation study
Kun-Han Lue, Yu-Hung Chen, Sung-Chao Chu, Chih-Bin Lin, Tso-Fu Wang, Shu-Hsin Liu
Annals of Nuclear Medicine.2024; 38(8): 647. CrossRef
 PubReader
 ePub Link
-
 Cite this Article
- Cite this Article
-
- Close
- Download Citation
- Close
- Figure
-


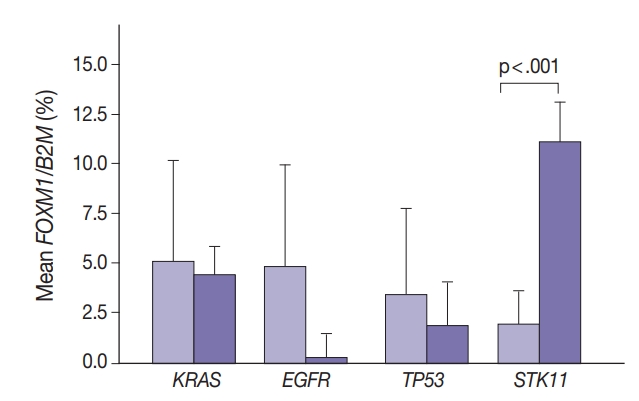


Fig. 1.
Fig. 2.
Fig. 3.
Fig. 4.
Fig. 5.
| SUV |
Gene expression |
Mutation status, n (%) |
||||||
|---|---|---|---|---|---|---|---|---|
| No. | PET Min | PET Max | EGFR | KRAS | STK11 | TP53 | ||
| Total | 301 | 2.47 ± 1.44 | 8.85 ± 6.69 | 3.11 ± 4.69/3.92 ± 9.84 | 32/267 (12) | 105/296 (35) | 17/173 (10) | 73/173 (42) |
| Sex | ||||||||
| Female | 168 | 2.33 | 8.79 | 1.83/5.94 | 22/152 | 61/167 | 7/99 | 40/99 |
| Male | 133 | 2.65 | 8.93 | 4.38/1.39 | 9/115 | 42/123 | 10/73 | 32/73 |
| p-value | .077 | .867 | .055 | .661 | .675 | .150 | .652 | |
| Age (yr) | ||||||||
| < 60 | 70 | 2.48 | 8.99 | 0.76/3.30 | 9/53 | 17/69 | 4/42 | 20/42 |
| > 60 | 231 | 2.47 | 8.82 | 17.3/2.25 | 22/212 | 85/227 | 13/126 | 51/128 |
| p-value | .973 | .857 | .002 | .181 | .050 | .882 | .462 | |
| Smoking |
||||||||
| Ever | 56 | 2.16 | 10.3 | -/0.00 | 2/40 | 24/53 | 8/53 | 34/53 |
| Non-smoker | 17 | 1.87 | 8.62 | -/2.84 | 3/10 | 3/17 | 0/17 | 5/17 |
| p-value | .527 | .529 | - | .018 | .042 | .089 | .012 | |
SUV, standardized uptake value; PET, positron emission tomography. Expression normalized to B2M; left-tailed probability of the chi-square distribution; Mutated/total resulted; left-tailed probability of the chi-square distribution; Smoking status was not available for all cases.

