 E-submission
Articles
- Page Path
- HOME > J Pathol Transl Med > Volume 59(4); 2025 > Article
-
Original Article
Pancreatic cancer in liquid-based cytology: cytological features and cell block utility from 254 fine-needle aspiration samples -
Jaeyong Min1,2
 , Wookjin Oh1,2, Baek-hui Kim1,2
 -
Journal of Pathology and Translational Medicine 2025;59(4):249-261.
DOI: https://doi.org/10.4132/jptm.2025.05.27
Published online: July 3, 2025
1Korea University College of Medicine, Seoul, Korea
2Department of Pathology, Korea University Guro Hospital, Seoul, Korea
- Correspondence to: Baek-hui Kim, MD, PhD Department of Pathology, Korea University Guro Hospital, 148 Gurodong-ro, Guro-gu, Seoul 08308, Korea Tel: +82-2-2626-1482, Fax: +82-2-2626-1486, E-mail: maelstrom@naver.com
© The Korean Society of Pathologists/The Korean Society for Cytopathology
This is an Open Access article distributed under the terms of the Creative Commons Attribution Non-Commercial License (http://creativecommons.org/licenses/by-nc/4.0) which permits unrestricted non-commercial use, distribution, and reproduction in any medium, provided the original work is properly cited.


Figure & Data
References
Citations
- Cytology and small biopsy diagnosis of pancreatic ductal adenocarcinoma
Maria Pimenova, Matthew W. Rosenbaum
Seminars in Diagnostic Pathology.2026; 43(2): 150992. CrossRef
 PubReader
 ePub Link
-
 Cite this Article
- Cite this Article
-
- Close
- Download Citation
- Close
- Figure
-
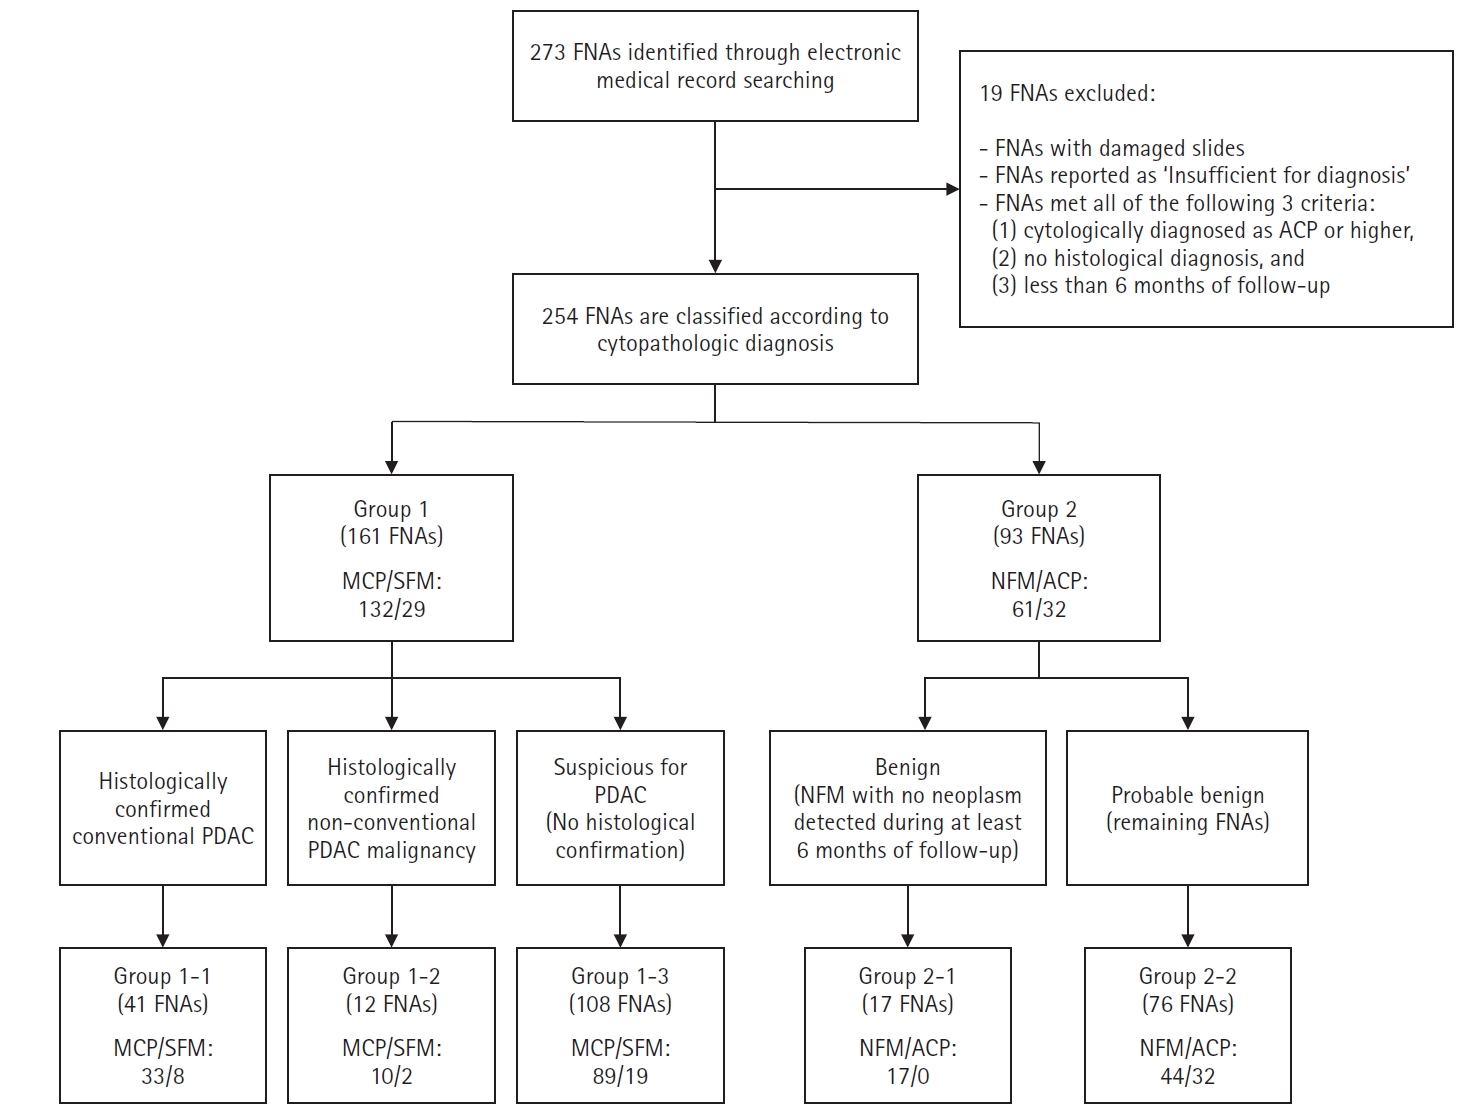
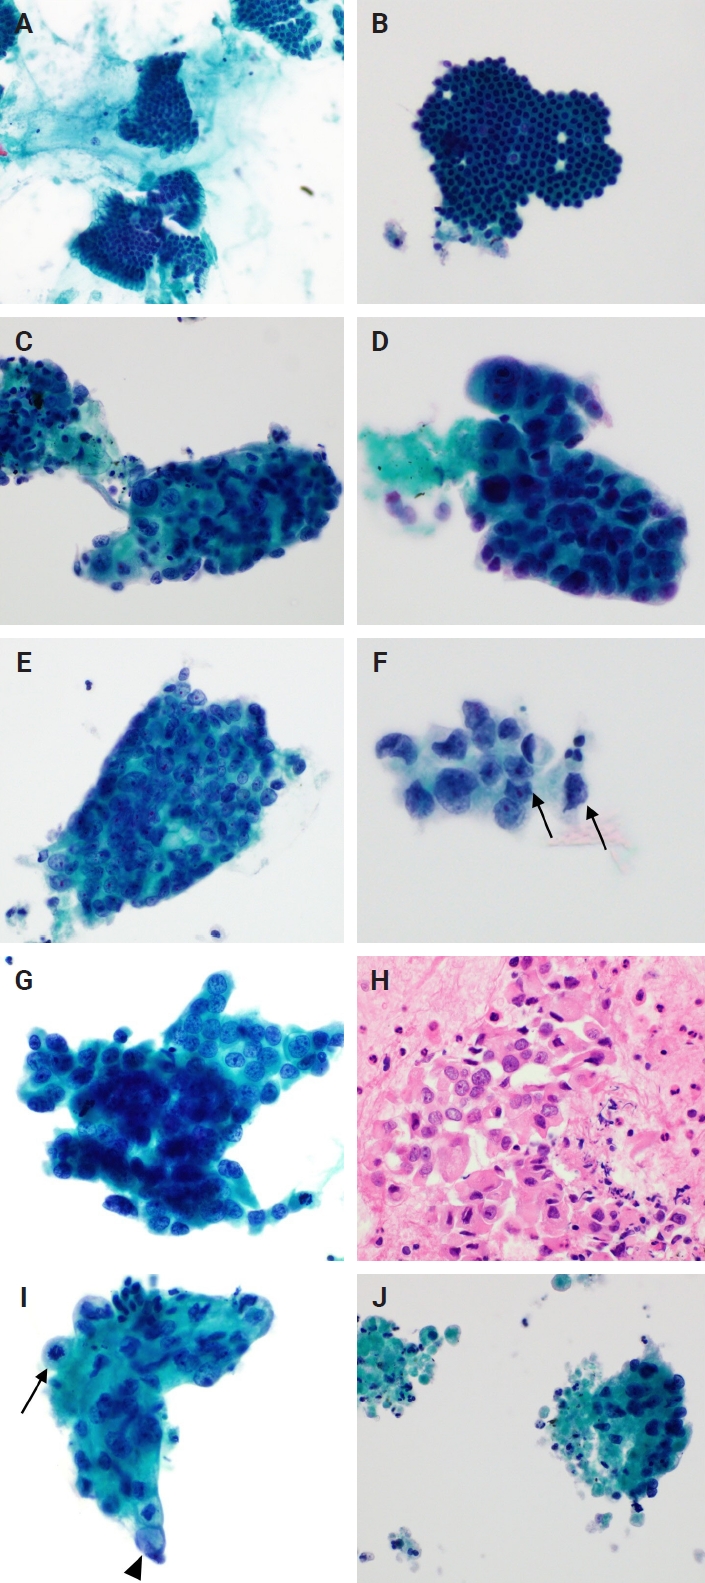
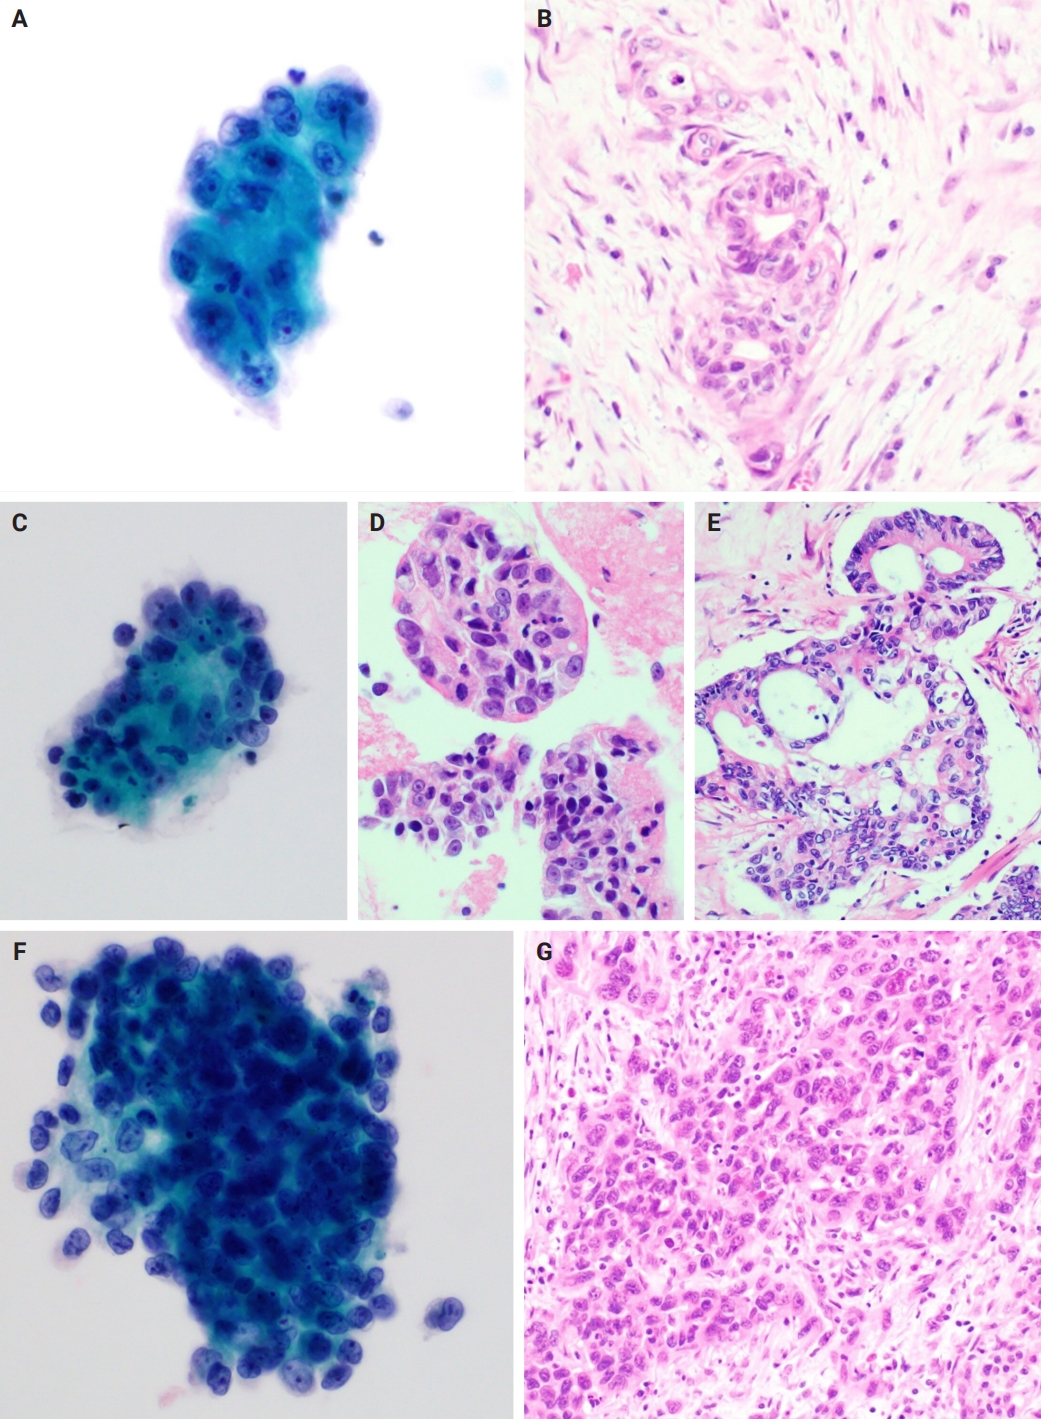
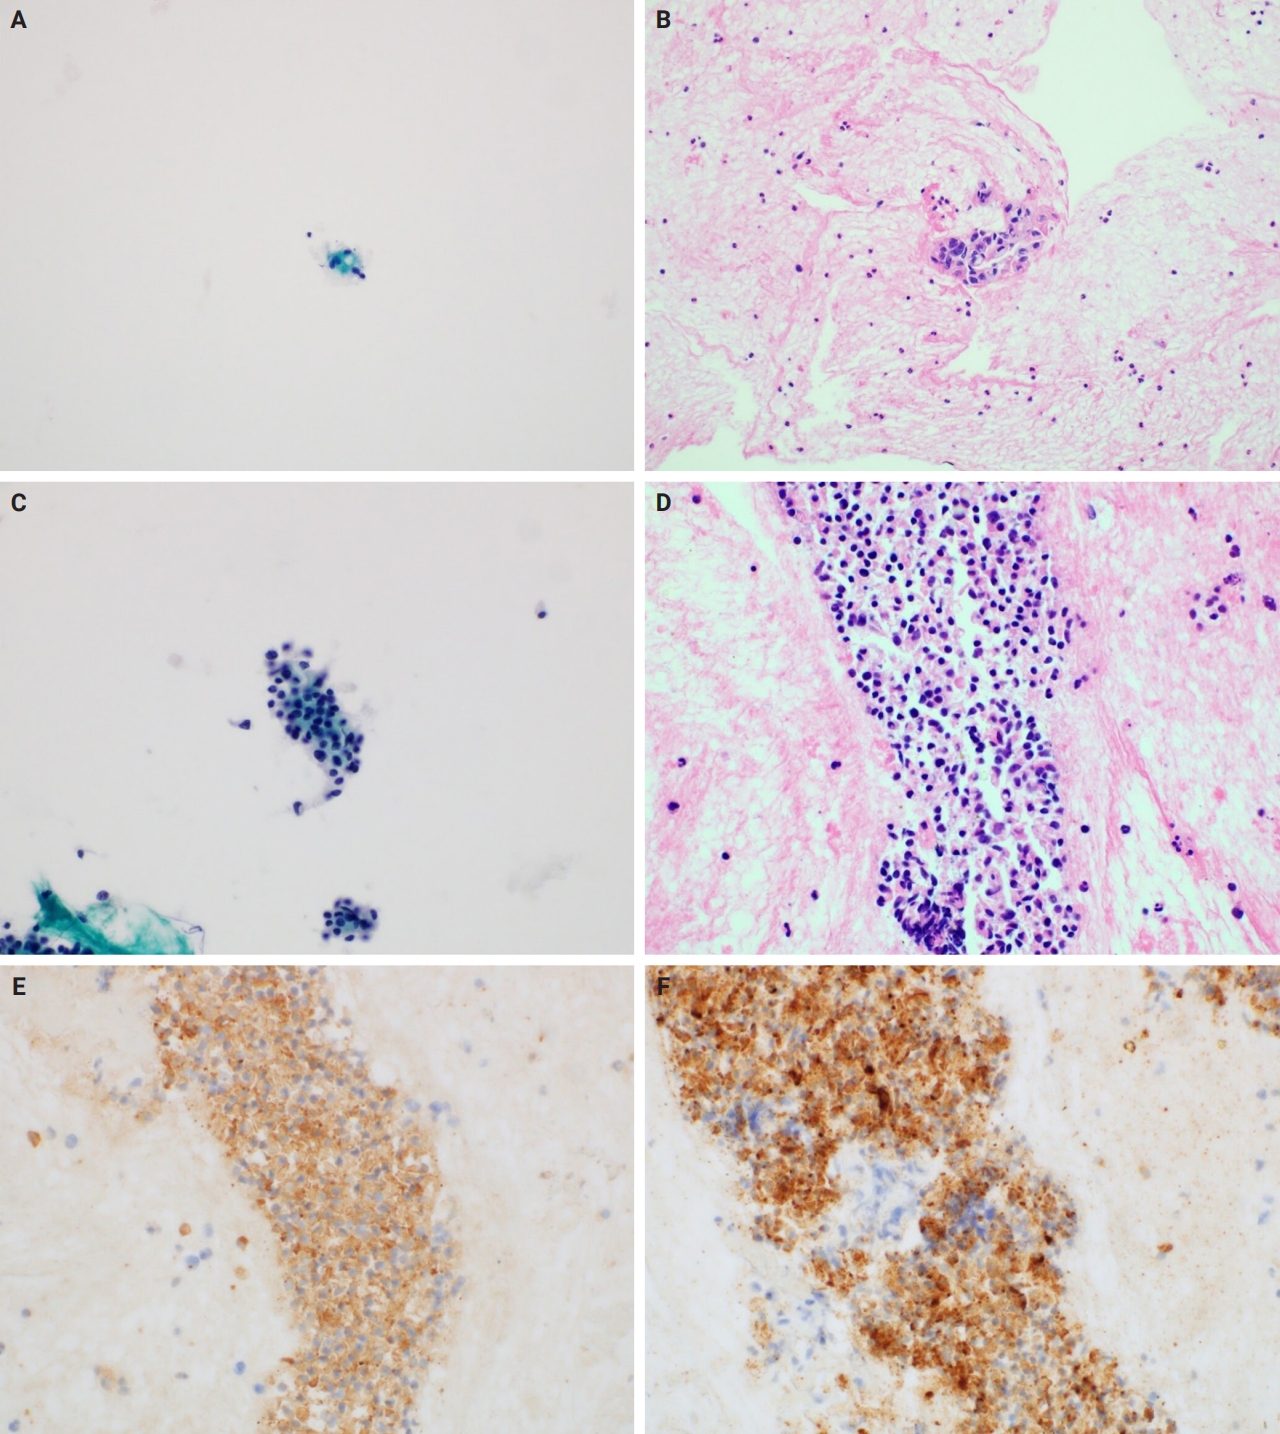
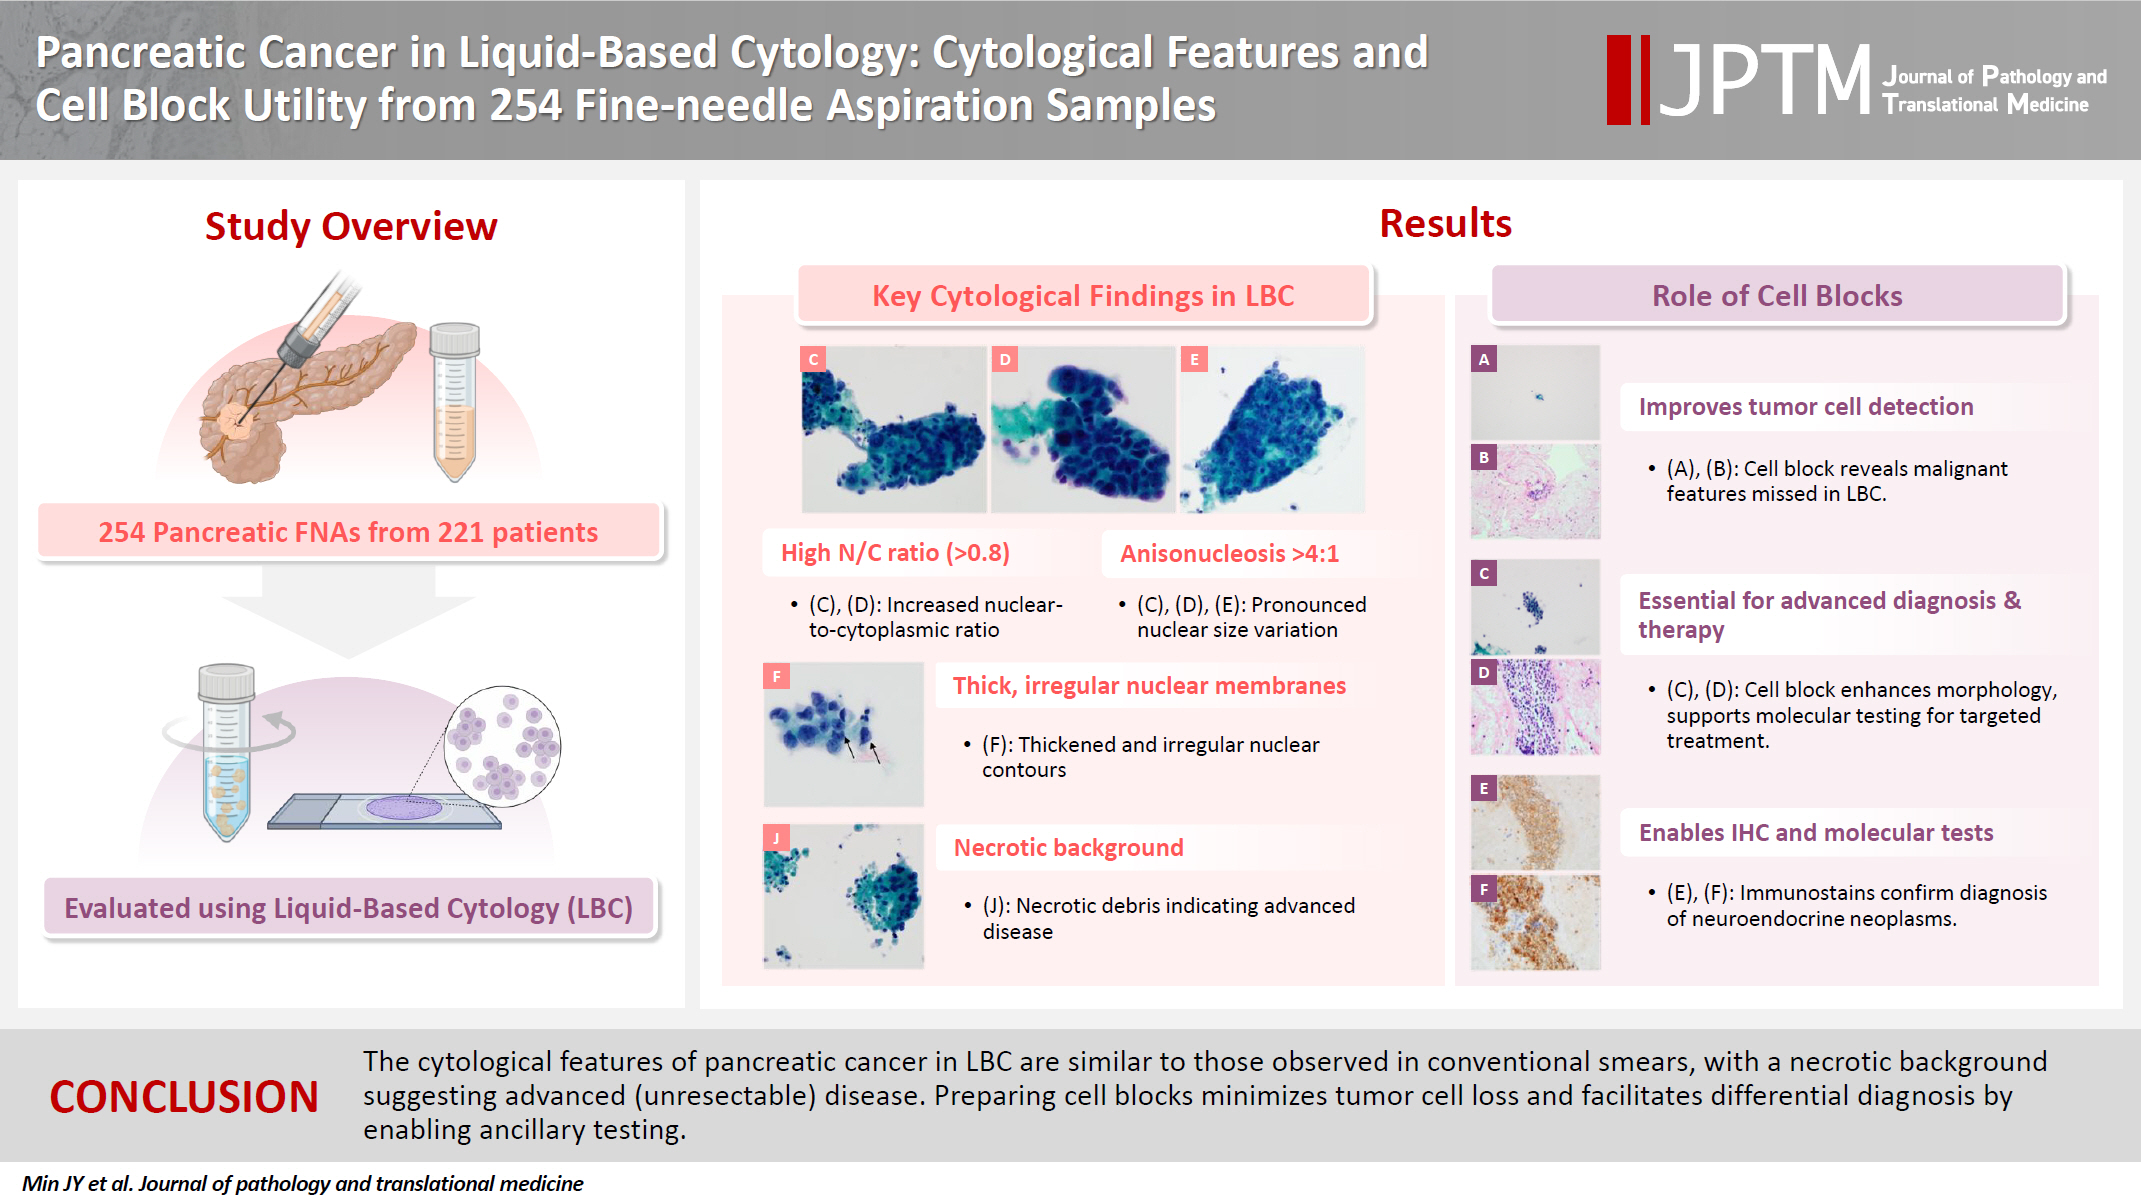


Fig. 1.
Fig. 2.
Fig. 3.
Fig. 4.
Graphical abstract
| Variable | Total (n = 221) | Group 1 (n = 159) |
Group 2 (n = 62) |
|||
|---|---|---|---|---|---|---|
| Group 1-1 (n = 41) | Group 1-2 (n = 12) | Group 1-3 (n = 106) | Group 2-1 (n = 13) | Group 2-2 (n = 49) | ||
| Sex (male/female) | 129 (58.4)/92 (41.6) | 19 (46.3)/22 (53.7) | 6 (50.0)/6 (50.0) | 66 (62.3)/40 (37.7) | 11 (84.6)/2 (15.4) | 27 (55.1)/22 (44.9) |
| Age (yr) | 67.0 ± 11.8 | 66.6 ± 10.7 | 66.0 ± 13.8 | 69.6 ± 9.8 | 52.4 ± 15.5 | 65.8 ± 12.5 |
| Radiologic feature |
||||||
| Solid | 193 (87.3) | 39 (95.1) | 12 (100) | 99 (93.4) | 7 (53.8) | 36 (73.5) |
| Solid-cystic | 12 (5.4) | 2 (4.9) | 0 | 4 (3.8) | 1 (7.7) | 5 (10.2) |
| Cystic | 16 (7.3) | 0 | 0 | 3 (2.8) | 5 (38.5) | 8 (16.3) |
| Specimen collection (EUS-guided/other) |
219 (99.1)/2 (0.9) | 41 (100)/0 (0) | 12 (100)/0 (0) | 106 (100)/0 (0) | 11 (84.6)/2 (15.4) | 49 (100)/0 (0) |
| Site of FNA | ||||||
| Head and neck (including uncinate process) | 101 (45.7) | 16 (39.0) | 6 (50.0) | 43 (40.6) | 6 (46.1) | 30 (61.2) |
| Body | 82 (37.1) | 18 (43.9) | 5 (41.7) | 42 (39.6) | 2 (15.4) | 15 (30.6) |
| Tail | 38 (17.2) | 7 (17.1) | 1 (8.3) | 21 (19.8) | 5 (38.5) | 4 (8.2) |
| Cytological feature | Group 1 (n = 161) | Group 2 (n = 93) | p-value |
|---|---|---|---|
| Background | <.001 | ||
| Non-necrotic |
126 (78.3) | 89 (95.7) | |
| Necrotic | 35 (21.7) | 4 (4.3) | |
| Gastrointestinal contaminants | .045 | ||
| Not identified | 59 (36.7) | 45 (48.4) | |
| Gastric | 54 (33.5) | 17 (18.3) | |
| Duodenal | 48 (29.8) | 31 (33.3) | |
| Cellularity | <.001 | ||
| No pancreatic ductal component |
0 | 20 (21.5) | |
| Low cellularity | 61 (37.9) | 56 (60.2) | |
| Intermediate cellularity | 46 (28.6) | 13 (14.0) | |
| High cellularity | 54 (33.5) | 4 (4.3) | |
| Architecture |
<.001 | ||
| Mixed pattern | 76 (47.2) | 15 (20.5) | |
| Mainly single cells | 14 (8.7) | 2 (2.7) | |
| Mainly small clusters | 66 (41.0) | 51 (69.9) | |
| Mainly large sheets | 5 (3.1) | 5 (6.9) | |
| Nuclear/cytoplasmic ratio |
<.001 | ||
| <0.5 | 0 | 4 (5.5) | |
| 0.5–0.8 | 53 (32.9) | 50 (68.5) | |
| >0.8 | 108 (67.1) | 19 (26.0) | |
| Cytoplasm |
.127 | ||
| Fine | 150 (93.2) | 71 (97.2) | |
| Clear | 1 (0.6) | 0 | |
| Foamy | 0 | 1 (1.4) | |
| Bubbly | 10 (6.2) | 1 (1.4) | |
| Anisonucleosis |
<.001 | ||
| <2:1 | 7 (4.3) | 55 (75.3) | |
| 2:1–4:1 | 33 (20.5) | 14 (19.2) | |
| >4:1 | 121 (75.2) | 4 (5.5) | |
| Nuclear membrane irregularity |
<.001 | ||
| Smooth | 7 (4.3) | 42 (57.5) | |
| Irregular | 147 (91.4) | 31 (42.5) | |
| Spiculate | 7 (4.3) | 0 | |
| Nuclear membrane thickness |
<.001 | ||
| Inconspicuous | 3 (1.9) | 17 (23.3) | |
| Thin | 75 (46.6) | 53 (72.6) | |
| Thick and prominent | 83 (51.5) | 3 (4.1) | |
| Multinucleated cells |
<.001 | ||
| Not identified | 129 (80.1) | 72 (98.6) | |
| Present | 32 (19.9) | 1 (1.4) | |
| Hyperchromatic nuclei |
<.001 | ||
| Not identified | 16 (9.9) | 43 (58.9) | |
| Present | 145 (90.1) | 30 (41.1) | |
| Chromatin pattern |
<.001 | ||
| Fine | 8 (5.0) | 45 (61.7) | |
| Coarse | 72 (44.7) | 22 (30.1) | |
| Clumped | 76 (47.2) | 3 (4.1) | |
| Smudged | 5 (3.1) | 3 (4.1) | |
| No. of nucleoli |
<.001 | ||
| No visible nucleoli | 58 (36.0) | 53 (72.6) | |
| Single | 93 (57.8) | 20 (27.4) | |
| Multiple | 10 (6.2) | 0 | |
| Prominent nucleoli |
<.001 | ||
| No visible nucleoli | 58 (36.0) | 53 (72.6) | |
| Visible at 400× magnification | 9 (5.6) | 7 (9.6) | |
| Visible at 200× or 100× magnification | 93 (57.8) | 13 (17.8) | |
| Visible at 40× or lower magnification | 1 (0.6) | 0 |
| Cytological feature | Curative (n = 19) | Palliative (n = 22) | p-value |
|---|---|---|---|
| Background | .004 | ||
| Non-necrotic |
18 (94.7) | 12 (54.5) | |
| Necrotic | 1 (5.3) | 10 (45.5) | |
| Gastrointestinal contaminants | .211 | ||
| Not identified | 6 (31.6) | 11 (50.0) | |
| Gastric | 7 (36.8) | 9 (40.9) | |
| Duodenal | 6 (31.6) | 2 (9.1) | |
| Cellularity | .785 | ||
| Low cellularity | 10 (52.6) | 9 (40.9) | |
| Intermediate cellularity | 5 (26.3) | 8 (36.4) | |
| High cellularity | 4 (21.1) | 5 (22.7) | |
| Architecture | .214 | ||
| Mixed pattern | 11 (57.9) | 10 (45.5) | |
| Mainly single cells | 2 (10.5) | 0 | |
| Mainly small clusters | 6 (31.6) | 11 (50.0) | |
| Mainly large sheets | 0 | 1 (4.5) | |
| Nuclear/cytoplasmic ratio | .138 | ||
| 0.5–0.8 | 3 (15.8) | 8 (36.4) | |
| >0.8 | 16 (84.2) | 14 (63.6) | |
| Cytoplasm | .463 | ||
| Fine | 18 (94.7) | 22 (100) | |
| Clear | 0 | 0 | |
| Foamy | 0 | 0 | |
| Bubbly | 1 (5.3) | 0 | |
| Anisonucleosis | .592 | ||
| <2:1 | 1 (5.3) | 0 | |
| 2:1–4:1 | 5 (26.3) | 5 (22.7) | |
| >4:1 | 13 (68.4) | 17 (77.3) | |
| Nuclear membrane irregularity | .490 | ||
| Smooth | 0 | 2 (9.1) | |
| Irregular | 19 (100) | 20 (90.9) | |
| Spiculate | 0 | 0 | |
| Nuclear membrane thickness | .177 | ||
| Inconspicuous | 0 | 0 | |
| Thin | 9 (47.4) | 15 (68.2) | |
| Thick and prominent | 10 (52.6) | 7 (31.8) | |
| Multinucleated cells |
.588 | ||
| Not identified | 17 (89.5) | 21 (95.5) | |
| Present | 2 (10.5) | 1 (4.5) | |
| Hyperchromatic nuclei | >.999 | ||
| Not identified | 4 (21.1) | 4 (18.2) | |
| Present | 15 (78.9) | 18 (81.8) | |
| Chromatin pattern | .869 | ||
| Fine | 1 (5.3) | 1 (4.5) | |
| Coarse | 6 (31.6) | 9 (40.9) | |
| Clumped | 12 (63.1) | 12 (54.6) | |
| Smudged | 0 | 0 | |
| No. of nucleoli | .737 | ||
| No visible nucleoli | 6 (31.6) | 8 (36.4) | |
| Single | 12 (63.1) | 14 (63.6) | |
| Multiple | 1 (5.3) | 0 | |
| Prominent nucleoli | >.999 | ||
| No visible nucleoli | 6 (31.6) | 8 (36.4) | |
| Visible at 400× magnification | 1 (5.3) | 1 (4.5) | |
| Visible at 200× or 100× magnification | 12 (63.1) | 13 (59.1) | |
| Visible at 40× or lower magnification | 0 | 0 |
| Variable | Total (n = 225 |
Group 1 (n = 151) |
Group 2 (n = 74) |
|||
|---|---|---|---|---|---|---|
| Group 1-1 (n = 40) | Group 1-2 (n = 11) | Group 1-3 (n = 100) | Group 2-1 (n = 13) | Group 2-2 (n = 61) | ||
| Assistance in diagnosis | ||||||
| Cytopathological diagnosis can be made without a cell block | 123 (81.5 |
37 (92.5) | 2 (18.2) | 84 (84.0) | N/A | N/A |
| Cell block helps in determining the presence of malignant cells |
16 (10.6 |
3 (7.5) | 0 (0.0) | 13 (13.0) | N/A | N/A |
| Cell block helps in differential histopathological diagnosis | 13 (5.8) | 0 (0.0) | 9 (81.8) | 3 (3.0) | 1 (7.7) | 0 |
| With the cell block alone | ||||||
| Cytopathological diagnosis can be made | 112 (74.2 |
27 (67.5) | 1 (9.1) | 84 (84.0) | N/A | N/A |
| Cytopathological diagnosis cannot be made | 39 (25.8 |
13 (32.5) | 10 (90.9) | 16 (16.0) | N/A | N/A |
| IHC/Special staining | ||||||
| Neither was performed | 211 (93.8) | 39 (97.5) | 3 (27.3) | 96 (96.0) | 12 (92.3) | 61 (100) |
| Only IHC performed | 7 (3.1) | 0 | 5 (45.4) | 2 (2.0) | 0 | 0 |
| Only special staining performed | 2 (0.9) | 1 (2.5) | 0 | 0 | 1 (7.7) | 0 |
| Both were performed | 5 (2.2) | 0 | 3 (27.3) | 2 (2.0) | 0 | 0 |
| Molecular testing | ||||||
| Not performed | 222 (98.7) | 39 (97.5) | 10 (90.9) | 100 (100) | 12 (92.3) | 61 (100) |
| Performed | 3 (1.3) | 1 (2.5) | 1 (9.1) | 0 | 1 (7.7) | 0 |
Values are presented as number (%) or mean ± standard deviation. EUS, endoscopic ultrasound; FNA, fine-needle aspiration. To prevent duplication of clinical information, data were analyzed per patient; for those with multiple FNAs assigned to different groups, classification was based on the group with the most severe cytological diagnosis; Based on the findings of computed tomography scan and/or magnetic resonance imaging; 1 percutaneous ultrasound-guided and 1 intraoperative.
Values are presented as number (%). Group 1 (99 clear, 23 inflammatory, 4 mucinous and no bloody background); group 2 (73 clear, 14 inflammatory, 2 mucinous and no bloody background); This category encompasses fine-needle aspirations (FNAs) where no cellular components were observed and FNAs where only inflammatory cells were observed; The 20 FNAs in which a pancreatic ductal component is not observed are excluded from the analysis; Multinucleated histiocytic giant cells are excluded.
Values are presented as number (%). Curative treatment subgroup (15 clear, 2 inflammatory, 1 mucinous and no bloody background); Palliative treatment subgroup (9 clear, 3 inflammatory, no mucinous and no bloody background); Multinucleated histiocytic giant cells are excluded.
Values are presented as number (%). IHC, immunohistochemistry; N/A, not applicable. Of the 254 fine-needle aspirations (FNAs), 24 FNAs where cell blocks were not produced and five FNAs that could not be reviewed were excluded from the analysis; With only the liquid-based cytology slide, a diagnosis is equivalent to or below ‘atypical cell present’. However, when considering the cell block slide, a diagnosis of ‘suspicious for malignancy’ or higher can be made; These are the percentages calculated based on the 151 FNAs of group 1.

