
 E-submission
Articles
- Page Path
- HOME > J Pathol Transl Med > Forthcoming articles > Article
-
Original Article
Development of a prognostic prediction model for tumor recurrence or progression in gastrointestinal stromal tumors: integrating inflammatory blood indices with 5 mm2 versus 50 high-power field mitotic counts -
Waratchaya Tirasarnvong1
 , Thammasin Ingviya2, Paramee Thongsuksai1
 -
DOI: https://doi.org/10.4132/jptm.2026.06.15
Published online: July 31, 2026
1Department of Pathology, Faculty of Medicine, Prince of Songkla University, Hat Yai, Thailand
2Department of Clinical Research and Medical Data Science, Faculty of Medicine, Prince of Songkla University, Hat Yai, Thailand
- Corresponding Author: Paramee Thongsuksai, MD Department of Pathology, Faculty of Medicine, Prince of Songkla University, 15 Kanchanavanit Road, Hat Yai, Songkhla 90110, Thailand Tel: +66-81-541-4601 Fax: +66-74-212-908 E-mail: tparamee@gmail.com
© The Korean Society of Pathologists/The Korean Society for Cytopathology
This is an Open Access article distributed under the terms of the Creative Commons Attribution Non-Commercial License (https://creativecommons.org/licenses/by-nc/4.0) which permits unrestricted non-commercial use, distribution, and reproduction in any medium, provided the original work is properly cited.
- 66 Views
- 1 Download


Abstract
-
Background
- The behavior of gastrointestinal stromal tumors varies according to tumor size, location, mitotic rate, and rupture. Traditional mitotic counting in 50 high-power fields (HPF; 5.3 mm2) may overestimate progression risk, as 5 mm2 corresponds to 20–25 HPF under modern microscopy. However, the 50-HPF method remains widely used. This study evaluated the impact of two mitotic counting methods on risk classification and developed a prognostic model combining inflammatory biomarkers with clinicopathological factors.
-
Methods
- We retrospectively analyzed 150 patients who underwent resection at Songklanagarind Hospital between 2009 and 2021. Patients who had received neoadjuvant therapy or had a second primary cancer were excluded. Mitosis was evaluated using both methods. Clinicopathological and serum biomarker data were collected. The primary outcome was 5-year disease-free or progression-free survival. The model was developed using forward stepwise variable selection based on the time-dependent area under the curve and internally validated by bootstrapping.
-
Results
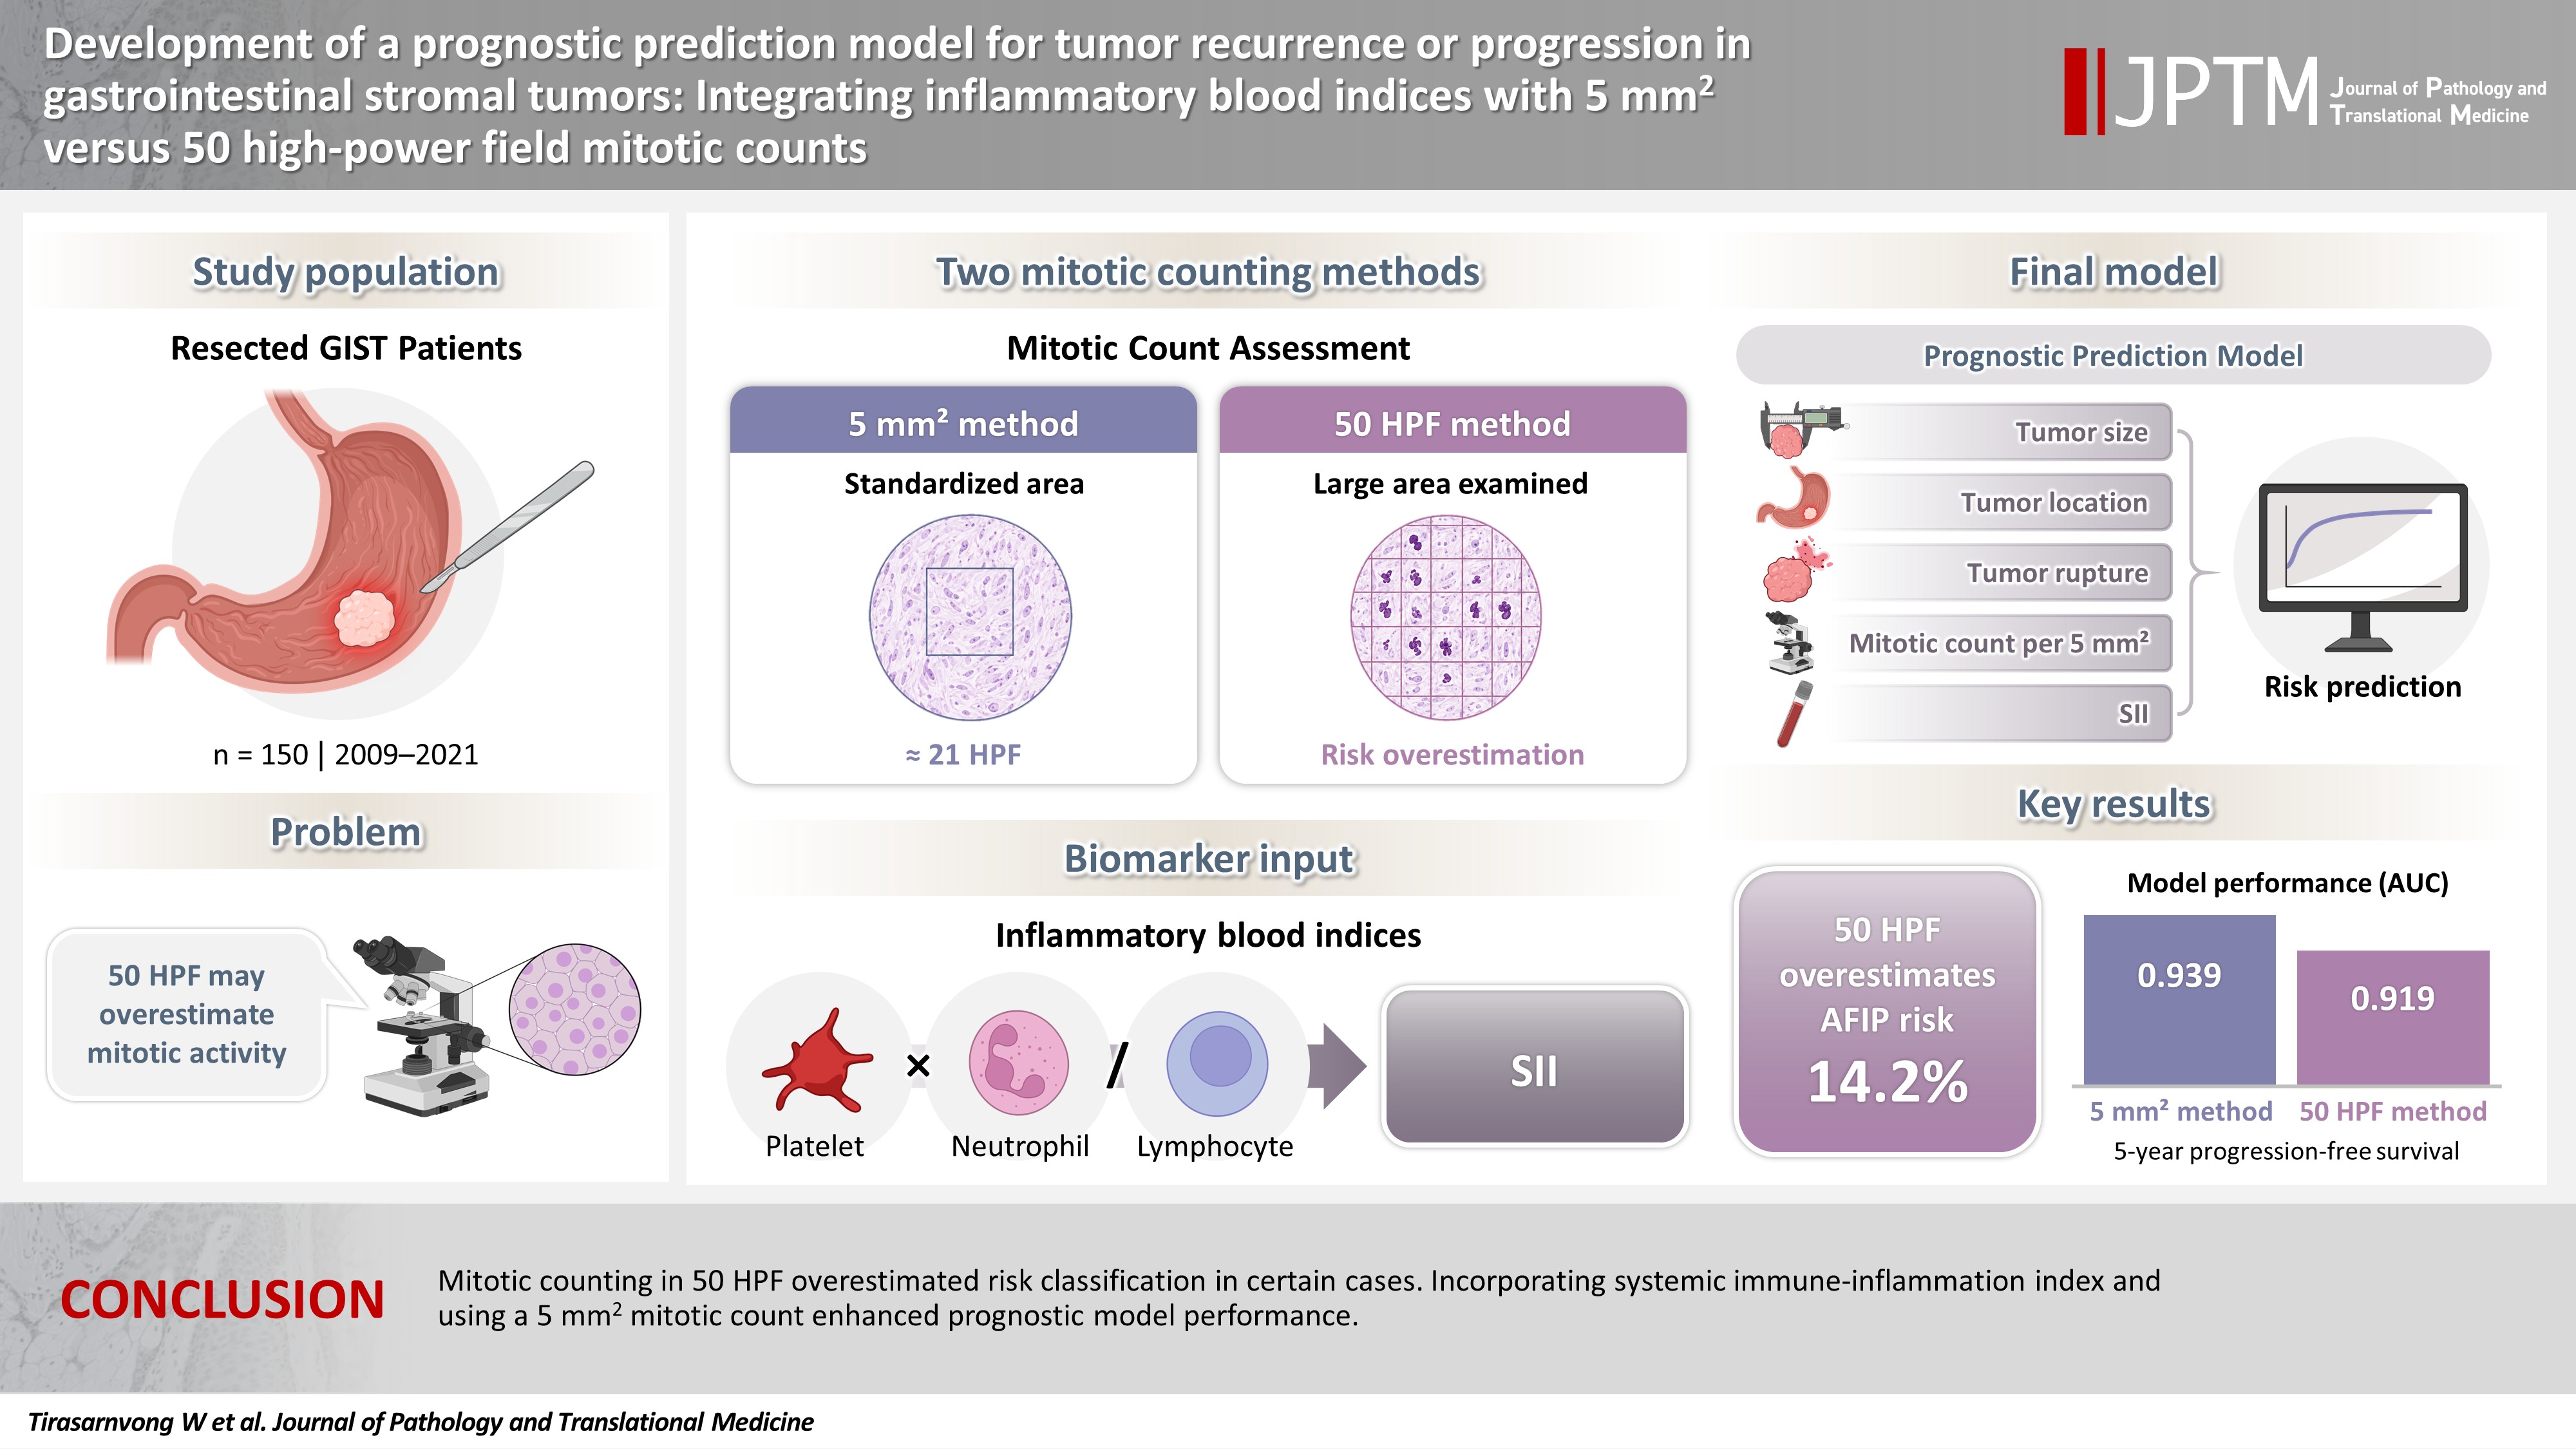
- The 50-HPF method overestimated the Armed Forces Institute of Pathology classification in 14.2% of cases. A model incorporating tumor size, location, rupture, mitotic count within 5 mm2, and systemic immune-inflammation index achieved the highest area under the curve of 0.939 in both training and validation sets, outperforming previous models. The 5-mm2 method demonstrated superior performance to the 50-HPF method across all models (0.939 vs. 0.919 for the proposed model).
-
Conclusions
- Mitotic counting in 50 HPF overestimated risk classification in certain cases. Incorporating systemic immune-inflammation index and using a 5 mm2 mitotic count enhanced prognostic model performance.
- Gastrointestinal stromal tumors (GISTs) are the common mesenchymal tumors of the digestive tract, predominantly originating in the stomach [1]. Their behavior exhibits wide variability in progression rates, depending on tumor size, location, mitotic rate, and rupture status [2-4]. Several risk classification systems have been proposed to predict disease progression and guide adjuvant therapy, including the Armed Forces Institute of Pathology (AFIP) [2] and the modified National Institutes of Health (NIH) criteria [3].
- The AFIP criteria, one of the most widely used systems proposed by Miettinen et al., were initially developed based on mitotic counts in 50 high-power fields (HPF), corresponding to an area of 5.3 mm2 [5,6]. This approach was established in an era when 50 HPF approximated 5 mm2. However, because the field area depends on the ocular field number, an area of 5 mm2 in modern microscopes corresponds to only 20–25 HPF. As a result, mitotic counting across 50 HPF, which encompasses a substantially larger area, may yield higher mitotic counts and consequently inflate risk classification [7]. To minimize this variability, recent guidelines have recommended mitotic counting within a standardized 5 mm2 field area instead of 50 HPF [8-12]. In 2023, Campora et al. [13] demonstrated that the 50-HPF method could overestimate progression risk by 10%–41%, depending on the field diameter. Such misclassification may have important clinical implications, particularly in decisions regarding adjuvant therapy. However, their survey revealed that more than half of pathologists still use the traditional 50-HPF method.
- Recent studies have highlighted the prognostic value of blood indices reflecting inflammatory and nutritional status, including the systemic immune-inflammation index (SII), platelet-to-lymphocyte ratio (PLR), neutrophil-to-lymphocyte ratio (NLR), prognostic nutritional index (PNI), and hemoglobin, albumin, lymphocyte, and platelet (HALP) score in various cancers [14-19]. Incorporating these indices can enhance the prognostic performance of established risk classification systems [20-23]. However, as mitotic activity is a key component of these systems, variability in mitotic counting methodology may influence their prognostic performance. In these studies, mitotic activity was assessed using the conventional 50-HPF method, which may have affected standardization across different microscopic settings. Therefore, there remains a need to evaluate the prognostic impact of integrating these biomarkers with standardized mitotic assessment within a prognostic model, and to identify the optimal combination of biomarkers and mitotic counting methods for risk prediction.
- Accordingly, this study aimed to evaluate the impact of the 5 mm2 and 50-HPF mitotic counting methods on risk classification. We further developed a prognostic model to assess their effects on risk prediction and to enhance model performance by incorporating systemic inflammatory and nutritional biomarkers as complementary variables. The predictive performance of this model was compared with that of established risk classification systems. The model is intended to remind pathologists of the appropriate mitotic counting method and to guide clinicians in surveillance planning for high-risk patients.
INTRODUCTION
- Study design, population, sample size, and data collection
- This retrospective cohort study included patients diagnosed with GISTs who underwent surgery between January 2009 and December 2021 at Songklanagarind Hospital, a single tertiary care center in Songkhla, Thailand. Patients were excluded if they had received neoadjuvant therapy or had two primary cancers.
- Variables, including age, sex, adjuvant treatment, tumor site, date of surgery, date of first recurrence or metastasis, last follow-up, and intraoperative parameters, such as tumor rupture status, were retrieved from the Hospital Information System of Songklanagarind Hospital and the Digital Innovation and Data Analytics database, Faculty of Medicine, Prince of Songkla University.
- Pathological assessment
- Archived formalin-fixed paraffin-embedded blocks were retrieved from the Department of Pathology, Prince of Songkla University. Each tissue block was sectioned at a thickness of 3 µm for hematoxylin and eosin staining. All samples were reexamined by a pathologist who was blinded to clinical history and outcomes. Additionally, 10% of cases were randomly selected for mitotic count assessment by a second pathologist. In cases of mitotic grade discordance, both pathologists jointly reviewed the slides and reached a consensus.
- All pathological features were evaluated using a light microscope (field number 22, Nikon ECLIPSE Ci, Tokyo, Japan). Mitotic activity was assessed in two ways: within a hotspot area of 5 mm2 (equivalent to 21 HPF using a 40× objective lens) and across 50 HPF. A mitotic cut-off of 5 was used to classify tumors into low (≤5) and high (>5) mitotic grade categories [24]. Tumor size was determined based on the greatest diameter described in the gross section of the pathology report. Histologic subtypes were categorized as spindle cell, epithelioid, or mixed. Additional features, including tumor necrosis, ulceration, mucosal invasion, muscle invasion, and serosal involvement, were recorded as present or absent.
- Laboratory assessment
- Preoperative serum laboratory data, including albumin levels and complete blood counts, were collected within 2 months prior to surgery and used to derive several inflammation- and nutrition-based indices. The PNI was calculated as follows: 10 × serum albumin (g/dL) + 0.005 × total lymphocyte count (/mm3). The HALP score was computed as hemoglobin (g/L) × albumin (g/L) × lymphocyte count (/L)/platelet count (/L). The SII was calculated as follows: platelet count (/L) × neutrophil count (/L)/lymphocyte count (/L). Other derived markers were calculated based on direct ratios, including the PLR, NLR, and monocyte-to-lymphocyte ratio (MLR).
- Statistical analysis
- Clinicopathological characteristics, intraoperative findings, and laboratory parameters were summarized using means with standard deviations or medians with interquartile range (IQR) for continuous variables and percentages for categorical variables. As no established cut-off values exist for blood indices, optimal thresholds were determined using the Euclidean distance method, selecting the receiver operating characteristic (ROC) point closest to the ideal coordinate [0,1] [25,26].
- Disease-free survival (DFS) was defined as the interval from surgery to the first recurrence or metastasis in patients with stage I–III disease. For patients with stage IV disease, progression-free survival (PFS) was defined as the interval from surgery to disease progression, indicated by locoregional recurrence or new metastatic lesions. For patients without recurrence or progression at the time of analysis, survival data were censored at the last follow-up (March 31, 2025), which marked the end of the study period. To address missing data, multiple imputation by chained equations [27] was performed before area under the curve (AUC) estimation.
- The associations between variables and prognosis were evaluated using Kaplan-Meier survival analysis and Cox proportional hazards regression. To reduce heterogeneity, survival outcomes were analyzed separately, with DFS for stage I–III patients and PFS for stage IV patients. Variables that were significant in univariate Cox regression analysis were included in the multivariable model.
- We developed a model to predict DFS/PFS. All available cases, including stages I–IV, were used for model development. Forward stepwise variable selection based on the time-dependent AUC was used for model construction. The initial model included four established prognostic factors identified in the literature [3,24]: tumor site, tumor size, mitotic count, and tumor rupture. Additional variables were subsequently incorporated to enhance the 5-year time-dependent AUC. The final prognostic models were compared with previously established scoring systems, including the AFIP criteria, modified NIH criteria, and the 8th edition of the American Joint Committee on Cancer (AJCC) staging system, based on AUC performance. AUCs were computed separately for models utilizing mitotic counts measured per 5 mm2 and per 50 HPF to compare the prognostic performance of the two counting methods.
- Model calibration was evaluated using three complementary approaches: calibration curves, the Hosmer-Lemeshow goodness-of-fit test [28], and the Brier score [29]. Internal validation was performed using bootstrapping. Statistical analyses were performed using R ver. 4.4.2 (R Foundation for Statistical Computing, Vienna, Austria), and statistical significance was set at p < .05.
MATERIALS AND METHODS
- Patients’ characteristics
- A total of 214 patients were initially eligible. After excluding 40 patients with two primary cancers and 24 patients who received neoadjuvant therapy, 150 patients were included in this study. The clinicopathological characteristics of the patients are summarized in Table 1. Fifty-seven patients (38.0%) were male and 93 (62.0%) were female, with a mean age of 61.5 ± 13.4 years. Most tumors were unifocal, comprising 147 cases (98.0%). The stomach was the most common primary tumor site, accounting for 82 cases (54.7%). Tumor rupture occurred in 23 patients (15.3%). The median tumor size was 7.0 cm (IQR, 4.0 to 11.9 cm). According to the 8th edition of the AJCC staging system, 67 cases (44.7%) were stage I, 27 (18.0%) were stage II, 43 (28.7%) were stage III, and 13 (8.7%) were stage IV. Eighteen patients (12.0%) received adjuvant imatinib. The median mitotic counts were 3 (IQR, 1 to 12) and 6 (IQR, 2 to 21) when assessed in 5 mm2 and 50 HPF, respectively.
- Impact of mitotic counting method on AFIP risk classification
- Using a mitotic cut-off of 5, mitotic counting in 50 HPF resulted in a higher grade in 22 cases (14.6%) compared with assessment in 5 mm2, whereas the remaining 128 cases retained the same mitotic grade, with 72 classified as low grade and 56 as high grade.
- According to the AFIP criteria, risk category upgrading occurred in 20 cases (14.2%) when mitoses were counted using the 50-HPF method compared with the 5 mm2 assessment (Table 2). Specifically, six cases (4.3%) were reclassified from very low to moderate risk, 11 cases (7.8%) from low to high risk, and three cases (2.1%) from moderate to high risk. Nine cases were unclassifiable because of insufficient data based on the AFIP criteria.
- Patient survival according to the mitotic counting method
- The median follow-up duration was 61.3 months (IQR, 32.9 to 67.2 months). Among the 39 patients (26.0%) who experienced recurrence, 10 (6.7%) had local recurrence, 35 (23.3%) had metastasis, and six (4%) had both. Approximately 25% of patients experienced recurrence or progressive disease by 54.8 months (95% confidence interval [CI], 41.3 to 71.8 months). The median time to recurrence could not be estimated, as the recurrence rate did not reach 50% during the follow-up period.
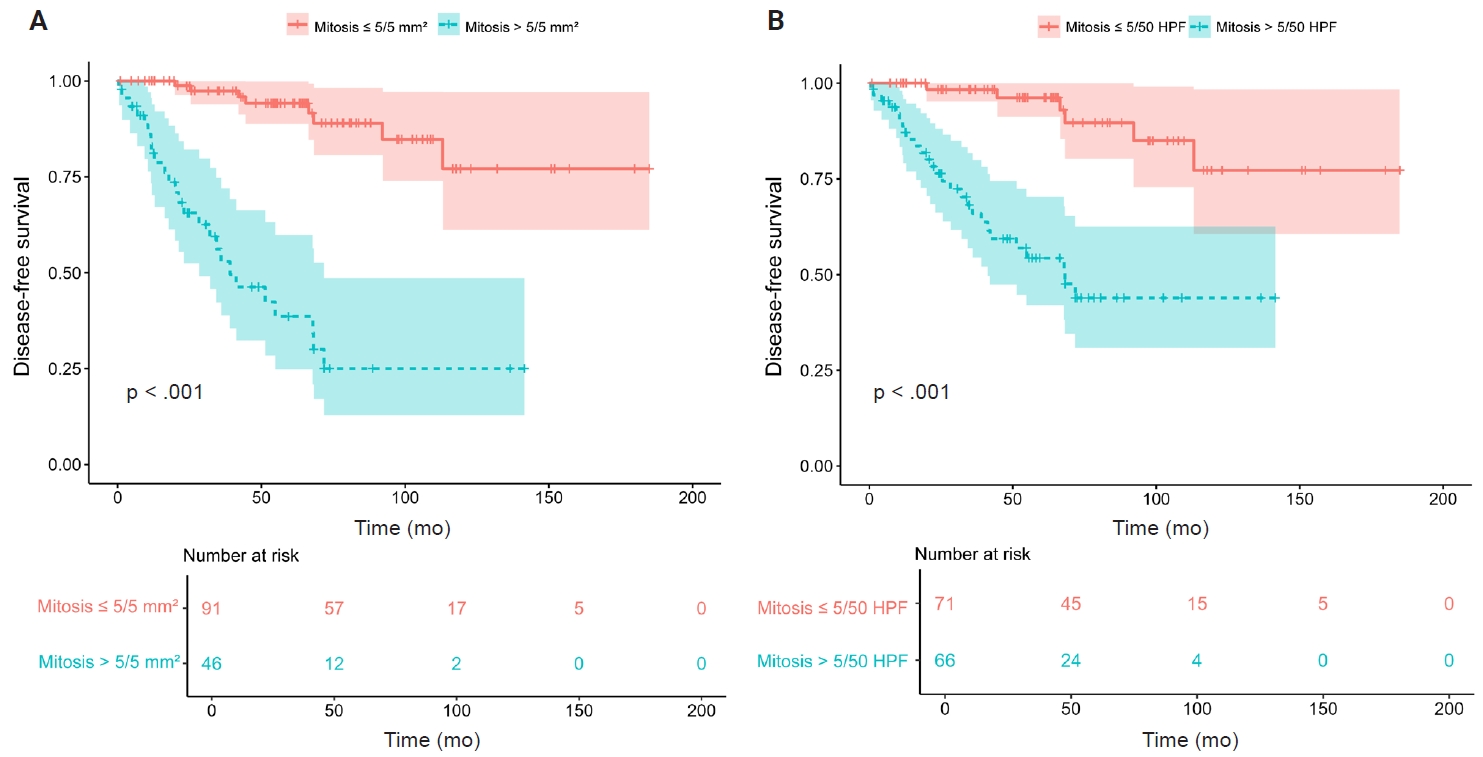
- In patients with stage I–III disease, those with a high mitotic grade demonstrated significantly worse DFS than those with a low mitotic grade, regardless of the counting method used (p < .001) (Fig. 1A, B). Survival analysis for PFS in stage IV patients was not feasible due to the limited sample size (n = 13).
- Kaplan-Meier survival analysis stratified by blood indices
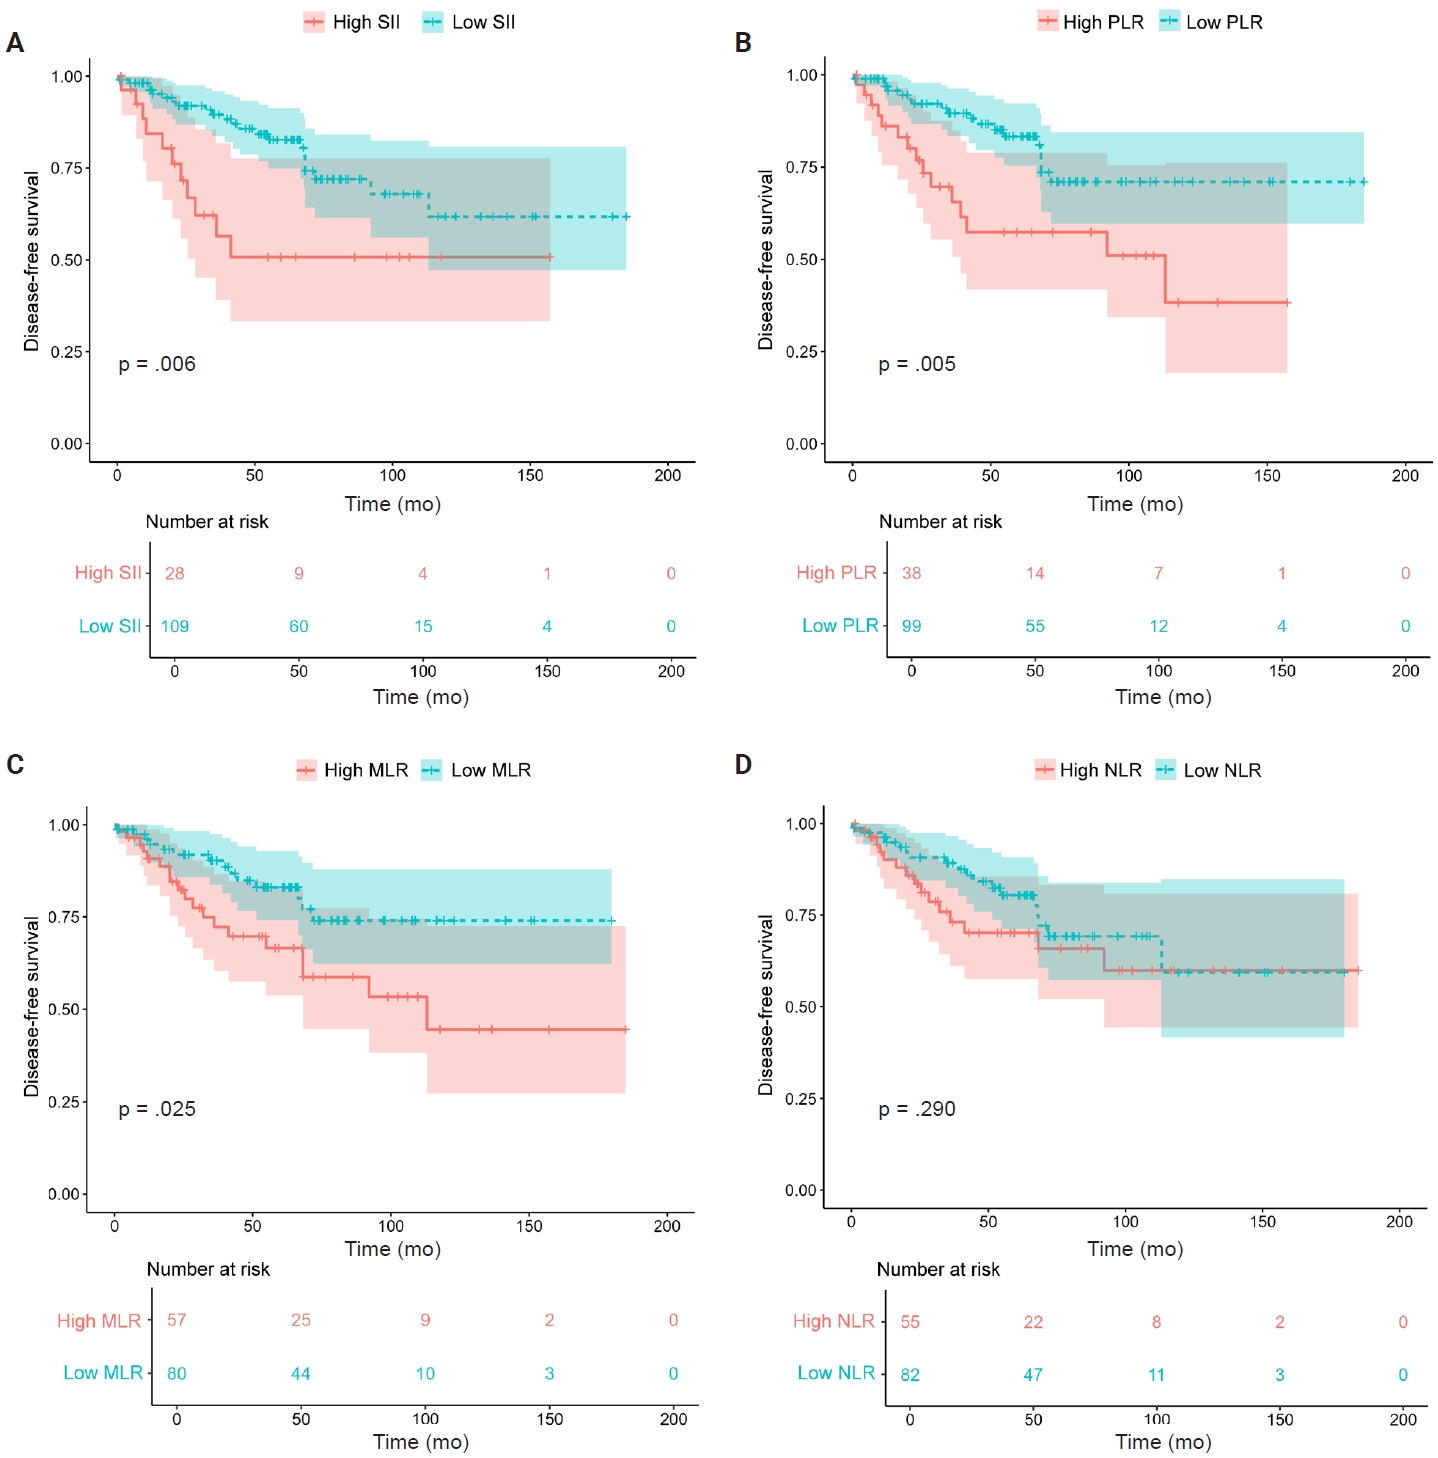
- Patients with high SII values had significantly worse DFS than those with low SII values (p = .006) (Fig. 2A). At 5 years, the estimated probability of recurrence was 49.2% (95% CI, 22.4% to 66.7%) in the high SII group versus 17.3% (95% CI, 8.8% to 25.1%) in the low SII group.
- In addition to the SII, high PLR and MLR were also significantly associated with worse DFS, as demonstrated in Fig. 2B and C, respectively. In contrast, NLR, PNI, and HALP were not significantly associated with DFS (Fig. 2D for NLR; data for other indices not shown).
- Univariate and multivariable Cox regression analyses
- Univariate and multivariable Cox regression analyses for DFS in stage I–III patients are presented in Table 3. The presence of tumor rupture, tumor size >5 cm, mitotic count >5 per 5 mm2 and per 50 HPF, as well as high SII, high PLR, and high MLR, were significantly associated with worse DFS in univariate analysis. In multivariable analysis, only tumor size, mitotic count, and high PLR remained independent prognostic factors for DFS.
- Model performance of prediction models
- The time-dependent AUC of the model comprising mitotic count (≤5 vs. >5 per 5 mm2 or per 50 HPF), tumor size (≤5 vs. >5 cm), tumor site (gastric vs. non-gastric), and tumor rupture (presence vs. absence) was 0.920 (95% CI, 0.867 to 0.974) and 0.910 (95% CI, 0.855 to 0.966) when mitotic count was assessed per 5 mm2 and per 50 HPF, respectively.
- The addition of SII (≤1,358.6 vs. >1,358.6) provided the greatest improvement in predictive performance, increasing the AUC to 0.939 (95% CI, 0.894 to 0.983). The incorporation of PLR (≤16.5 vs. >16.5) also improved model performance, yielding an AUC of 0.937. The AUC values for models incorporating other variables are presented in Supplementary Table S1. Model performance, evaluated separately using mitotic counts per 5 mm2 and per 50 HPF, is summarized in Table 4, along with corresponding time-dependent AUCs and 95% CIs.
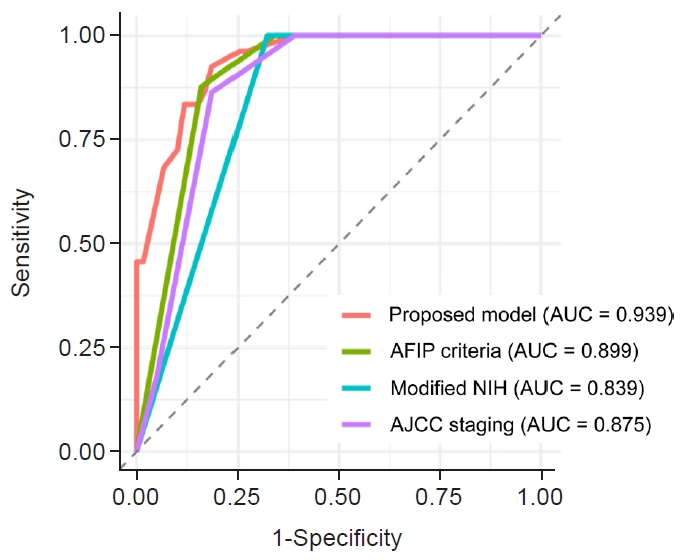
- The final prognostic model comprised mitotic count, tumor size, tumor site, tumor rupture, and SII. To benchmark prognostic discrimination, it was compared with previously established models, including the AFIP criteria, modified NIH criteria, and the 8th edition AJCC staging system, both with and without SII inclusion (Table 4). The proposed model demonstrated superior discriminative ability, achieving the highest AUC of 0.939 (95% CI, 0.894 to 0.983) when using mitotic count per 5 mm2 and 0.919 (95% CI, 0.867 to 0.971) when using mitotic count per 50 HPF. The ROC curves comparing the proposed model with previous models based on mitotic counts per 5 mm² are shown in Fig. 3. The AFIP risk grouping applied to 141 patients, as nine cases could not be classified because of undefined categories within the criteria. In a subgroup analysis of stage I–III patients, the proposed model demonstrated similarly high discriminative performance, with AUCs of 0.946 (95% CI, 0.902 to 0.991) and 0.923 (95% CI, 0.870 to 0.977) for mitotic counts assessed per 5 mm2 and 50 HPF, respectively.
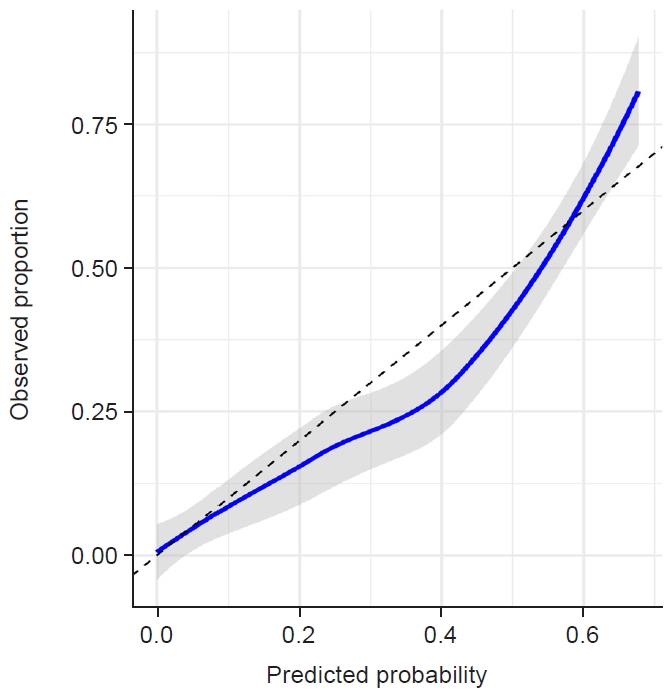
- Fig. 4 illustrates the calibration curve for 5-year DFS/PFS. The model tended to overestimate risk within the predicted probability range of 0.2–0.6. The Hosmer-Lemeshow test yielded a p-value of .913, indicating good model calibration, with a Brier score of 0.102.
- Table 4 presents the results of internal validation. The proposed model achieved its highest discriminatory performance, with an AUC of 0.939 (95% CI, 0.889 to 0.979), when mitotic count was evaluated per 5 mm2. Across both the original model and the internal validation set, mitotic count measured per 5 mm2 consistently yielded a higher time-dependent AUC than the 50-HPF method.
RESULTS
- Mitotic counting using the conventional 50-HPF method resulted in overestimation of the AFIP risk classification in certain cases. Our proposed model, which incorporated tumor size, location, rupture status, mitotic count within a 5-mm2 area, and SII, achieved the highest time-dependent AUC for DFS/PFS compared with previously established models. Furthermore, mitotic counting within a 5-mm2 area consistently yielded better prognostic performance than the 50-HPF method across all models.
- Using the 50-HPF method for mitotic counting resulted in overestimation of AFIP risk classification in certain cases, consistent with Campora et al. [13], who reported that mitotic assessment over 50 HPF could overestimate risk in 10%–41% of cases, depending on the microscope field diameter. The AFIP criteria were originally established using a mitotic count threshold of five per 50 HPF, corresponding to an area of approximately 5.3 mm2 [5,6]. With modern microscopes, the area covered by 50 HPF has nearly doubled, as 5 mm2 now corresponds to only 20–25 HPF. Consequently, counting mitoses across 50 HPF may overestimate mitotic activity, resulting in an upward shift in mitotic grade and AFIP risk classification. In our study, we observed a similar upward shift when using the 50-HPF method, consistent with the AFIP criteria. Nevertheless, Campora et al. [13] found that 64.5% of 110 pathologists still relied on the 50-HPF method for mitotic counting. Despite variation in counting methods, our Kaplan-Meier analysis demonstrated that a mitotic rate of ≥5 was significantly associated with a poorer prognosis than a mitotic rate <5, consistent with previous studies [5,30,31]. Our findings further indicate that the method of mitotic assessment is a key determinant of prognostic performance. Consistently, models based on mitotic counts assessed per 5 mm2 demonstrated superior performance compared with those based on counts per 50 HPF across all models. This observation aligns with current clinical guidelines recommending a standardized field area to minimize variability in field diameter [8–12].
- Recent studies have demonstrated the prognostic value of nutritional and inflammatory blood indices, including PNI, HALP, SII, PLR, and NLR, across various cancers [14-17,32,33]. Similar findings have been reported in GISTs [21,23,34-38]. However, these indices have not yet been incorporated into routine clinical practice. In our study, univariate analysis showed that high SII, PLR, and MLR were significantly associated with poorer DFS, consistent with previous findings [35-37,39-42]. The underlying mechanisms linking these indices to prognosis remain unclear. A plausible explanation involves the multifaceted roles of inflammatory cells in tumor progression. Platelets, activated by tumor-derived factors, release cytokines, including transforming growth factor-β and vascular endothelial growth factor, promoting epithelial–mesenchymal transition, angiogenesis, and metastasis [43-45]. Neutrophils facilitate tumor spread via extracellular matrix degradation and growth factor release [46,47]. In contrast, lymphocytes, particularly cytotoxic T cells, exert antitumor effects, and higher tumor-infiltrating lymphocyte levels correlate with better outcomes [48]. Monocytes promote tumor growth through angiogenesis, matrix remodeling, and immune suppression [49]. Accordingly, elevated SII values driven by increased platelets and neutrophils or decreased lymphocytes indicate a higher risk of disease progression. Similar associations were observed for PLR and MLR. In addition, SII has been reported to be significantly correlated with circulating tumor cells, which are associated with recurrence and distant metastasis [18]. Incorporating SII into the prognostic model may therefore provide additional information for risk stratification and potentially aid in decisions regarding surveillance intensity. Patients with elevated SII may warrant closer follow-up compared with those with lower SII.
- The proposed prognostic model incorporated mitotic count per 5 mm2, tumor size, site, rupture, and SII. It achieved the highest AUC compared with previously established models [2,3,50], both with and without SII. This finding was consistent for both the original and validation sets. In 2015, Goh et al. [20] also reported that integrating PLR or NLR with existing models using either the AFIP or NIH criteria enhanced prognostic discrimination, achieving the highest AUC of 0.866. In a similar manner, the inclusion of SII in our model further enhanced predictive performance. Notably, SII was incorporated as a complementary biomarker to improve model discrimination rather than as a primary prognostic determinant. SII, which is derived from three components—platelets, neutrophils, and lymphocytes—may provide a more comprehensive reflection of host inflammation and immune response to the tumor than indices based on two variables, such as PLR, NLR, and MLR. Accordingly, it has been shown to have superior prognostic performance in several malignancies [51,52]. However, in our cohort, its advantage over PLR was modest. This may be explained by the shared components of these indices, suggesting that the additional contribution of neutrophils may be limited in certain clinical settings, resulting in comparable predictive performance between SII and PLR.
- This study emphasizes the importance of evaluating mitotic counts within a standardized 5 mm2 area rather than across 50 HPF to avoid risk overestimation, which may lead to overtreatment. Adopting our model, which incorporates mitotic count per 5 mm2 and SII, could enable more accurate patient stratification. This approach may help reduce unnecessary adjuvant therapy in patients reclassified into lower-risk categories by avoiding the overestimation inherent in the 50-HPF method, while ensuring that truly high-risk patients are correctly identified and treated.
- This study had some limitations. First, it was a retrospective, single-center study, and the proposed model has not yet been externally validated. Moreover, the data-driven dichotomization of continuous variables may increase the risk of overfitting. Future studies are warranted to externally validate this model. Additionally, research on dynamic changes in SII and other inflammatory markers during follow-up may provide valuable insights for treatment monitoring and early recurrence detection.
- In conclusion, mitotic counting using the conventional 50-HPF method may overestimate AFIP risk classification in certain cases. In addition, mitotic count assessment within a standardized 5 mm2 area provides superior prognostic performance, underscoring its importance in risk stratification. A prognostic model incorporating mitotic count within a 5 mm2 area, along with tumor size, tumor location, rupture status, and SII, demonstrated improved predictive performance for 5-year DFS/PFS compared with existing models.
DISCUSSION
Supplementary Information
Ethics Statement
This study was approved by the Human Research Ethics Unit of the Faculty of Medicine, Prince of Songkla University (approval number: REC.67-560-5-1) in accordance with the Declaration of Helsinki and its later amendments. Formal written informed consent was not required, with a waiver granted by the appropriate Institutional Review Board.
Availability of Data and Material
The datasets generated or analyzed during the study are available from the corresponding author on reasonable request.
Code Availability
Not applicable.
Author Contributions
Conceptualization: WT. Data curation: WT, PT, TI. Formal analysis: WT. Funding acquisition: WT. Investigation: WT. Methodology: PT, TI. Project administration: WT. Resources: WT. Supervision: PT, TI. Validation: PT. Visualization: WT. Writing—original draft: WT. Writing—review & editing: PT, TI. Approval of final manuscript: all authors.
Conflicts of Interest
The authors declare that they have no potential conflicts of interest.
Funding Statement
This study was supported by the Faculty of Medicine, Prince of Songkla University (grant number 67-090-1).
Acknowledgments
This study was supported by the Department of Pathology, Faculty of Medicine, Prince of Songkla University.
| Mitosis per 5 mm2 | Mitosis per 50 HPF | ||||
|---|---|---|---|---|---|
| None | Very low | Low | Moderate | High | |
| None | 12 | 0 | 0 | 0 | 0 |
| Very low | 0 | 13 | 0 | 6 | 0 |
| Low | 0 | 0 | 28 | 0 | 11 |
| Moderate | 0 | 0 | 0 | 20 | 3 |
| High | 0 | 0 | 0 | 0 | 48 |
| Variable | Univariate analysis | Multivariable analysis | ||
|---|---|---|---|---|
| HR (95% CI) | p-value | HR (95% CI) | p-value | |
| Tumor location | ||||
| Gastric | 1 | 1 | ||
| Non-gastric | 0.65 (0.32–1.32) | .233 | 0.72 (0.30–1.70) | .455 |
| Tumor rupture | ||||
| Absence | 1 | 1 | ||
| Presence | 4.90 (2.36–10.18) | <.001 | 1.98 (0.83–4.72) | .122 |
| Tumor size (cm) | ||||
| ≤5 | 1 | 1 | ||
| >5 | 37.97 (5.18–278.40) | <.001 | 18.83 (2.49–142.27) | .004 |
| Mitosis (5 mm2) | ||||
| ≤5 | 1 | 1 | ||
| >5 | 10.98 (4.90–24.58) | <.001 | 6.50 (2.75–15.33) | <.001 |
| Mitosis (50 HPF) | ||||
| ≤5 | 1 | - | - | |
| >5 | 7.45 (3.04–18.25) | <.001 | ||
| PNI | ||||
| Low | 1 | - | - | |
| High | 0.86 (0.41–1.80) | .686 | ||
| HALP | ||||
| Low | 1 | - | - | |
| High | 1.16 (0.52–2.58) | .713 | ||
| SII | ||||
| Low | 1 | 1 | ||
| High | 2.65 (1.28–5.48) | .009 | 1.89 (0.88–4.08) | .103 |
| PLR | ||||
| Low | 1 | 1 | ||
| High | 2.60 (1.31–5.18) | .007 | 2.20 (1.05–4.59) | .036a |
| NLR | ||||
| Low | 1 | - | - | |
| High | 1.45 (0.73–2.88) | .293 | ||
| MLR | ||||
| Low | 1 | 1 | ||
| High | 2.17 (1.09–4.33) | .028 | 0.72 (0.33–1.58) | .418a |
DFS, disease-free survival; HR, hazard ratio; CI, confidence interval; HPF, high-power fields; PNI, prognostic nutritional index; HALP, hemoglobin, albumin, lymphocyte, and platelet; SII, systemic immune-inflammation index; PLR, platelet-to-lymphocyte ratio; NLR, neutrophil-to-lymphocyte ratio; MLR, monocyte-to-lymphocyte ratio.
aThe results of PLR and MLR in multivariable analysis were analyzed separately due to the strong correlation between the SII, PLR and MLR. The other variables included in both multivariable analyses were similar, as shown in this table.
| Model | Original model (AUC, 95% CI) | Validation set (AUC, 95% CI) | ||
|---|---|---|---|---|
| 5 mm2 | 50 HPF | 5 mm2 | 50 HPF | |
| Size + mitosis + site + rupture | 0.920 (0.867–0.974) | 0.910 (0.855–0.966) | 0.921 (0.860–0.970) | 0.912 (0.850–0.957) |
| Size + mitosis + site + rupture + SII | 0.939 (0.894–0.983) | 0.919 (0.867–0.971) | 0.939 (0.889–0.979) | 0.921 (0.861–0.964) |
| AFIP classificationa | 0.899 (0.841–0.956) | 0.874 (0.814–0.934) | 0.897 (0.834–0.952) | 0.873 (0.809–0.934) |
| AFIP classificationa + SII | 0.916 (0.861–0.972) | 0.890 (0.826–0.954) | 0.916 (0.858–0.966) | 0.890 (0.819–0.942) |
| Modified NIH classification | 0.839 (0.779–0.899) | 0.814 (0.752–0.875) | 0.839 (0.785–0.898) | 0.813 (0.750–0.868) |
| Modified NIH classification + SII | 0.876 (0.814–0.937) | 0.853 (0.786–0.920) | 0.877 (0.819–0.936) | 0.854 (0.785–0.916) |
| 8th edition AJCC staging | 0.875 (0.808–0.943) | 0.849 (0.778–0.920) | 0.884 (0.815–0.949) | 0.845 (0.770–0.913) |
| 8th edition AJCC staging + SII | 0.908 (0.852–0.965) | 0.875 (0.808–0.942) | 0.908 (0.851–0.963) | 0.876 (0.809–0.929) |
DFS/PFS, disease-free survival/progression-free survival; AUC, area under the curve; CI, confidence interval; HPF, high-power fields; SII, systemic immune-inflammation index; AFIP, Armed Forces Institute of Pathology; NIH, National Institutes of Health; AJCC, American Joint Committee on Cancer.
aAFIP risk grouping was feasible in 141 patients.
- 1. Sbaraglia M, Businello G, Bellan E, Fassan M, Dei Tos AP. Mesenchymal tumours of the gastrointestinal tract. Pathologica 2021; 113: 230-51. ArticlePubMedPMC
- 2. Miettinen M, Lasota J. Gastrointestinal stromal tumors: pathology and prognosis at different sites. Semin Diagn Pathol 2006; 23: 70-83. ArticlePubMed
- 3. Joensuu H. Risk stratification of patients diagnosed with gastrointestinal stromal tumor. Hum Pathol 2008; 39: 1411-9. ArticlePubMed
- 4. Joensuu H, Vehtari A, Riihimaki J, et al. Risk of recurrence of gastrointestinal stromal tumour after surgery: an analysis of pooled population-based cohorts. Lancet Oncol 2012; 13: 265-74. ArticlePubMedPMC
- 5. Miettinen M, Sobin LH, Lasota J. Gastrointestinal stromal tumors of the stomach: a clinicopathologic, immunohistochemical, and molecular genetic study of 1765 cases with long-term follow-up. Am J Surg Pathol 2005; 29: 52-68. ArticlePubMed
- 6. Miettinen M, Makhlouf H, Sobin LH, Lasota J. Gastrointestinal stromal tumors of the jejunum and ileum: a clinicopathologic, immunohistochemical, and molecular genetic study of 906 cases before imatinib with long-term follow-up. Am J Surg Pathol 2006; 30: 477-89. ArticlePubMed
- 7. Song IH, Ahn S, Kim HD, et al. Gastrointestinal stromal tumor: history, molecular subtypes, and risk stratification. J Gastric Cancer 2026; 26: 202-18. ArticlePubMedPMCPDF
- 8. Fanburg-Smith JC, Bellizzi AM, Bridge JA, et al. Protocol for the Examination of Resection Specimens from Patients with Gastrointestinal Stromal Tumor (GIST) version 4.3.0.0 [Internet]. Northfield: College of American Pathologists, 2022 [cited 2024 Sep 27]. Available from: https://documents.cap.org/protocols/Stomach.GIST_4.3.0.0.REL_CAPCP.pdf.
- 9. National Comprehensive Cancer Network. Gastrointestinal stromal tumors (version 2.2024) [Internet]. Plymouth Meeting: National Comprehensive Cancer Network, 2024 [cited 2024 Oct 24]. Available from: https://www.nccn.org/professionals/physician_gls/pdf/gist.pdf.
- 10. Casali PG, Blay JY, Abecassis N, et al. Gastrointestinal stromal tumours: ESMO-EURACAN-GENTURIS clinical practice guidelines for diagnosis, treatment and follow-up. Ann Oncol 2022; 33: 20-33. ArticlePubMed
- 11. Koo DH, Ryu MH, Kim KM, et al. Asian consensus guidelines for the diagnosis and management of gastrointestinal stromal tumor. Cancer Res Treat 2016; 48: 1155-66. ArticlePubMedPMCPDF
- 12. Serrano C, Martin-Broto J, Asencio-Pascual JM, et al. 2023 GEIS guidelines for gastrointestinal stromal tumors. Ther Adv Med Oncol 2023; 15: 17588359231192388.ArticlePubMedPMCPDF
- 13. Campora M, Paudice M, Gambella A, et al. Counting mitoses in gastrointestinal stromal tumours (GISTs): variable practices in the real-world setting and their clinical implications. Virchows Arch 2023; 482: 589-94. ArticlePubMedPMCPDF
- 14. Fang KH, Chang SW, Lee YC, et al. Preoperative prognostic nutritional index predicts prognosis of patients with oral cavity cancer. Oral Dis 2022; 28: 1816-30. ArticlePubMedPDF
- 15. Yamamoto T, Kawada K, Obama K. Inflammation-related biomarkers for the prediction of prognosis in colorectal cancer patients. Int J Mol Sci 2021; 22: 8002.ArticlePubMedPMC
- 16. Gong Z, Xin R, Li L, Lv L, Wu X. Platelet-to-lymphocyte ratio associated with the clinicopathological features and prognostic value of breast cancer: a meta-analysis. Int J Biol Markers 2022; 37: 339-48. ArticlePubMedPDF
- 17. Kim JY, Jung EJ, Kim JM, et al. Dynamic changes of neutrophil-to-lymphocyte ratio and platelet-to-lymphocyte ratio predicts breast cancer prognosis. BMC Cancer 2020; 20: 1206.ArticlePubMedPMCPDF
- 18. Hu B, Yang XR, Xu Y, et al. Systemic immune-inflammation index predicts prognosis of patients after curative resection for hepatocellular carcinoma. Clin Cancer Res 2014; 20: 6212-22. ArticlePubMedPDF
- 19. Xu H, Zheng X, Ai J, Yang L. Hemoglobin, albumin, lymphocyte, and platelet (HALP) score and cancer prognosis: a systematic review and meta-analysis of 13,110 patients. Int Immunopharmacol 2023; 114: 109496.ArticlePubMed
- 20. Goh BK, Chok AY, Allen JC Jr, et al. Blood neutrophil-to-lymphocyte and platelet-to-lymphocyte ratios are independent prognostic factors for surgically resected gastrointestinal stromal tumors. Surgery 2016; 159: 1146-56. ArticlePubMed
- 21. Shi WK, Zhang XH, Zhang J, et al. Predictive ability of prognostic nutritional index in surgically resected gastrointestinal stromal tumors: a propensity score matching analysis. Jpn J Clin Oncol 2019; 49: 823-31. ArticlePubMedPDF
- 22. Li S, Chen D, Li S, et al. Novel prognostic nomogram for recurrence-free survival of patients with primary gastrointestinal stromal tumors after surgical resection: combination of prognostic nutritional index and basic variables. Front Oncol 2020; 10: 581855.ArticlePubMedPMC
- 23. Yang W, Shou C, Chen Z, et al. Reassessment of the recurrence risk of primary gastrointestinal stromal tumour after complete resection. Scand J Gastroenterol 2023; 58: 684-92. ArticlePubMed
- 24. Fletcher CD, Berman JJ, Corless C, et al. Diagnosis of gastrointestinal stromal tumors: a consensus approach. Hum Pathol 2002; 33: 459-65. ArticlePubMed
- 25. Kumar R, Indrayan A. Receiver operating characteristic (ROC) curve for medical researchers. Indian Pediatr 2011; 48: 277-87. ArticlePubMedPDF
- 26. Hassanzad M, Hajian-Tilaki K. Methods of determining optimal cut-point of diagnostic biomarkers with application of clinical data in ROC analysis: an update review. BMC Med Res Methodol 2024; 24: 84.ArticlePubMedPMCPDF
- 27. van Buuren S, Groothuis-Oudshoorn K. mice: multivariate imputation by chained equations in R. J Stat Softw 2011; 45: 1-67. ArticlePMC
- 28. Hosmer DW, Lemesbow S. Goodness of fit tests for the multiple logistic regression model. Commun Stat Theory Methods 1980; 9: 1043-69. Article
- 29. Brier GW. Verification of forecasts expressed in terms of probability. Mon Weather Rev 1950; 78: 1-3. Article
- 30. Wong NA, Young R, Malcomson RD, et al. Prognostic indicators for gastrointestinal stromal tumours: a clinicopathological and immunohistochemical study of 108 resected cases of the stomach. Histopathology 2003; 43: 118-26. ArticlePubMedPDF
- 31. Dematteo RP, Gold JS, Saran L, et al. Tumor mitotic rate, size, and location independently predict recurrence after resection of primary gastrointestinal stromal tumor (GIST). Cancer 2008; 112: 608-15. ArticlePubMed
- 32. Li J, Zhu N, Wang C, et al. Preoperative albumin-to-globulin ratio and prognostic nutritional index predict the prognosis of colorectal cancer: a retrospective study. Sci Rep 2023; 13: 17272.ArticlePubMedPMCPDF
- 33. Roberts WS, Delladio W, Price S, Murawski A, Nguyen H. The efficacy of albumin-globulin ratio to predict prognosis in cancer patients. Int J Clin Oncol 2023; 28: 1101-11. ArticlePubMedPDF
- 34. Sun J, Mei Y, Zhu Q, et al. Relationship of prognostic nutritional index with prognosis of gastrointestinal stromal tumors. J Cancer 2019; 10: 2679-86. ArticlePubMedPMC
- 35. Wang F, Tao T, Yu H, et al. Prognostic value of Onodera's nutritional index for intermediate- and high-risk gastrointestinal stromal tumors treated with or without tyrosine kinase inhibitors. World J Surg Oncol 2021; 19: 227.ArticlePubMedPMCPDF
- 36. Yilmaz A, Mirili C, Bilici M, Tekin SB. A novel predictor in patients with gastrointestinal stromal tumors: systemic immune-inflammation index (SII). J BUON 2019; 24: 2127-35. PubMed
- 37. Lin Y, Wang M, Jia J, et al. Development and validation of a prognostic nomogram to predict recurrence in high-risk gastrointestinal stromal tumour: a retrospective analysis of two independent cohorts. EBioMedicine 2020; 60: 103016.ArticlePubMedPMC
- 38. Zhao Z, Yin XN, Wang J, Chen X, Cai ZL, Zhang B. Prognostic significance of hemoglobin, albumin, lymphocyte, platelet in gastrointestinal stromal tumors: a propensity matched retrospective cohort study. World J Gastroenterol 2022; 28: 3476-87. ArticlePubMedPMC
- 39. Zhao JL, Wang MY, Lv YZ, Zhou YJ. Prognostic value of inflammatory markers in predicting recurrence-free survival in gastrointestinal stromal tumor patients: a nomogram-based approach. World J Gastrointest Oncol 2025; 17: 94956.ArticlePubMedPMC
- 40. Lu Z, Li R, Cao X, et al. Assessment of systemic inflammation and nutritional indicators in predicting recurrence-free survival after surgical resection of gastrointestinal stromal tumors. Front Oncol 2021; 11: 710191.ArticlePubMedPMC
- 41. Ding P, Wu J, Wu H, et al. Inflammation and nutritional status indicators as prognostic indicators for patients with locally advanced gastrointestinal stromal tumors treated with neoadjuvant imatinib. BMC Gastroenterol 2023; 23: 23.ArticlePubMedPMCPDF
- 42. Feng F, Tian Y, Liu S, et al. Combination of PLR, MLR, MWR, and tumor size could significantly increase the prognostic value for gastrointestinal stromal tumors. Medicine (Baltimore) 2016; 95: e3248. ArticlePubMedPMC
- 43. Wojtukiewicz MZ, Sierko E, Hempel D, Tucker SC, Honn KV. Platelets and cancer angiogenesis nexus. Cancer Metastasis Rev 2017; 36: 249-62. ArticlePubMedPMCPDF
- 44. Labelle M, Begum S, Hynes RO. Direct signaling between platelets and cancer cells induces an epithelial-mesenchymal-like transition and promotes metastasis. Cancer Cell 2011; 20: 576-90. ArticlePubMedPMC
- 45. Mandel J, Casari M, Stepanyan M, Martyanov A, Deppermann C. Beyond hemostasis: platelet innate immune interactions and thromboinflammation. Int J Mol Sci 2022; 23: 3868.ArticlePubMedPMC
- 46. Xiong S, Dong L, Cheng L. Neutrophils in cancer carcinogenesis and metastasis. J Hematol Oncol 2021; 14: 173.ArticlePubMedPMCPDF
- 47. Christoffersson G, Vagesjo E, Vandooren J, et al. VEGF-A recruits a proangiogenic MMP-9-delivering neutrophil subset that induces angiogenesis in transplanted hypoxic tissue. Blood 2012; 120: 4653-62. ArticlePubMedPMCPDF
- 48. Chen DS, Mellman I. Oncology meets immunology: the cancer-immunity cycle. Immunity 2013; 39: 1-10. ArticlePubMedPMC
- 49. Olingy CE, Dinh HQ, Hedrick CC. Monocyte heterogeneity and functions in cancer. J Leukoc Biol 2019; 106: 309-22. ArticlePubMedPDF
- 50. Amin MB, Edge SB, Greene FL, et al. AJCC cancer staging manual [Internet]. Cham: Springer International Publishing, 2017 [cited 2022 Dec 18]. Available from: https://link.springer.com/book/9783319406176.
- 51. Geng Y, Shao Y, Zhu D, et al. Systemic immune-inflammation index predicts prognosis of patients with esophageal squamous cell carcinoma: a propensity score-matched analysis. Sci Rep 2016; 6: 39482.ArticlePubMedPMCPDF
- 52. Jiang W, Chen Y, Huang J, et al. Systemic immune-inflammation index predicts the clinical outcome in patients with nasopharyngeal carcinoma: a propensity score-matched analysis. Oncotarget 2017; 8: 66075-86. ArticlePubMedPMC
REFERENCES
Figure & Data
References
Citations

 PubReader
 ePub Link
-
 Cite this Article
- Cite this Article
-
- Close
- Download Citation
- Close
 XML Download
- Figure
-
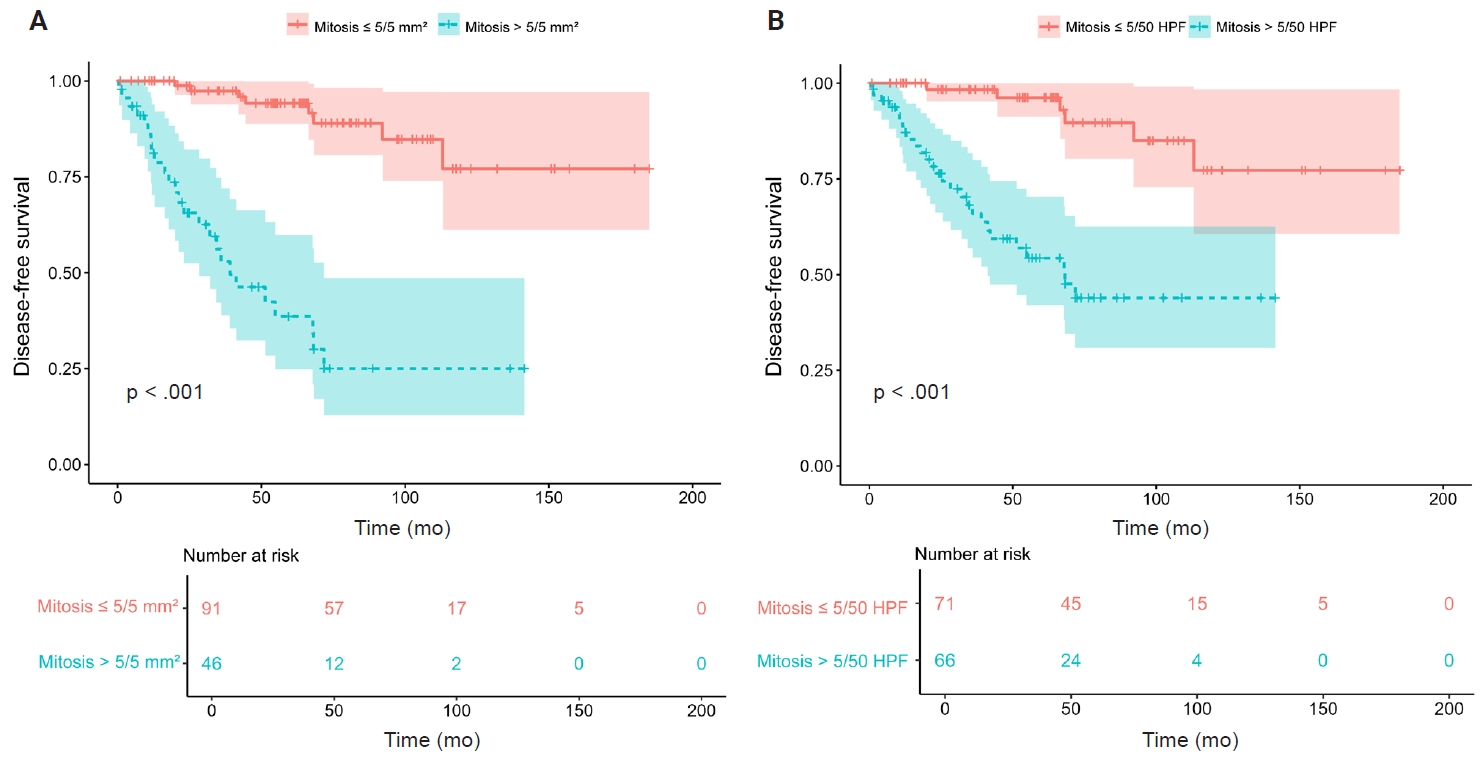
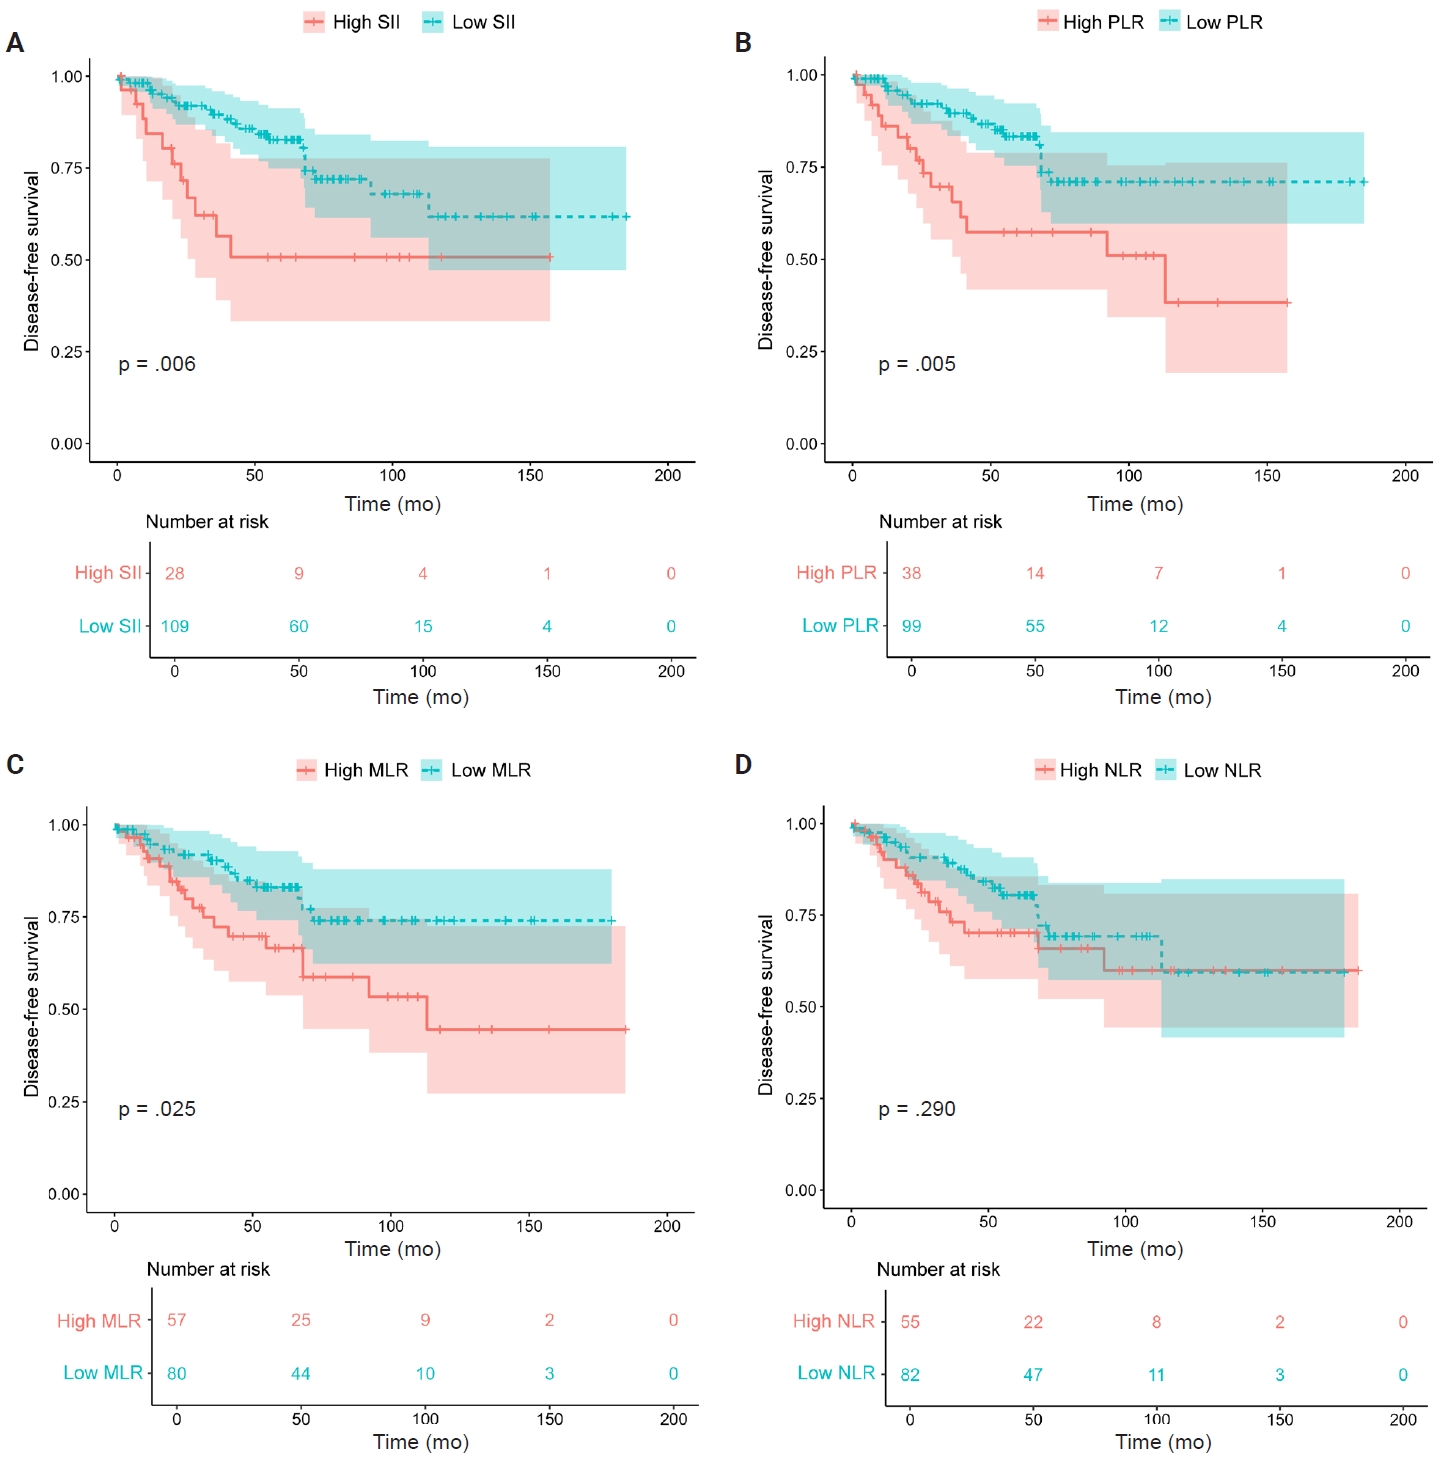
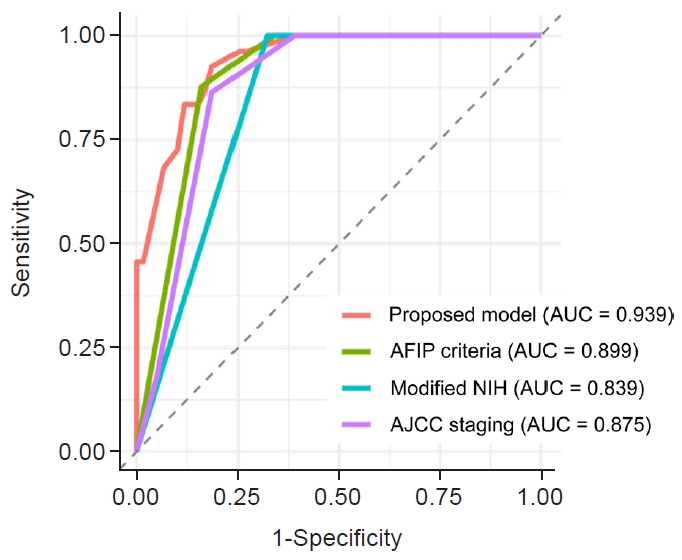
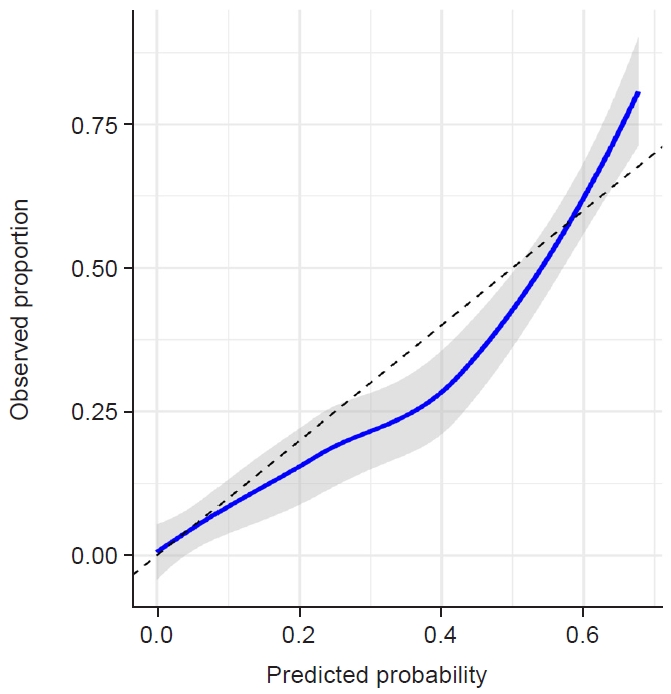
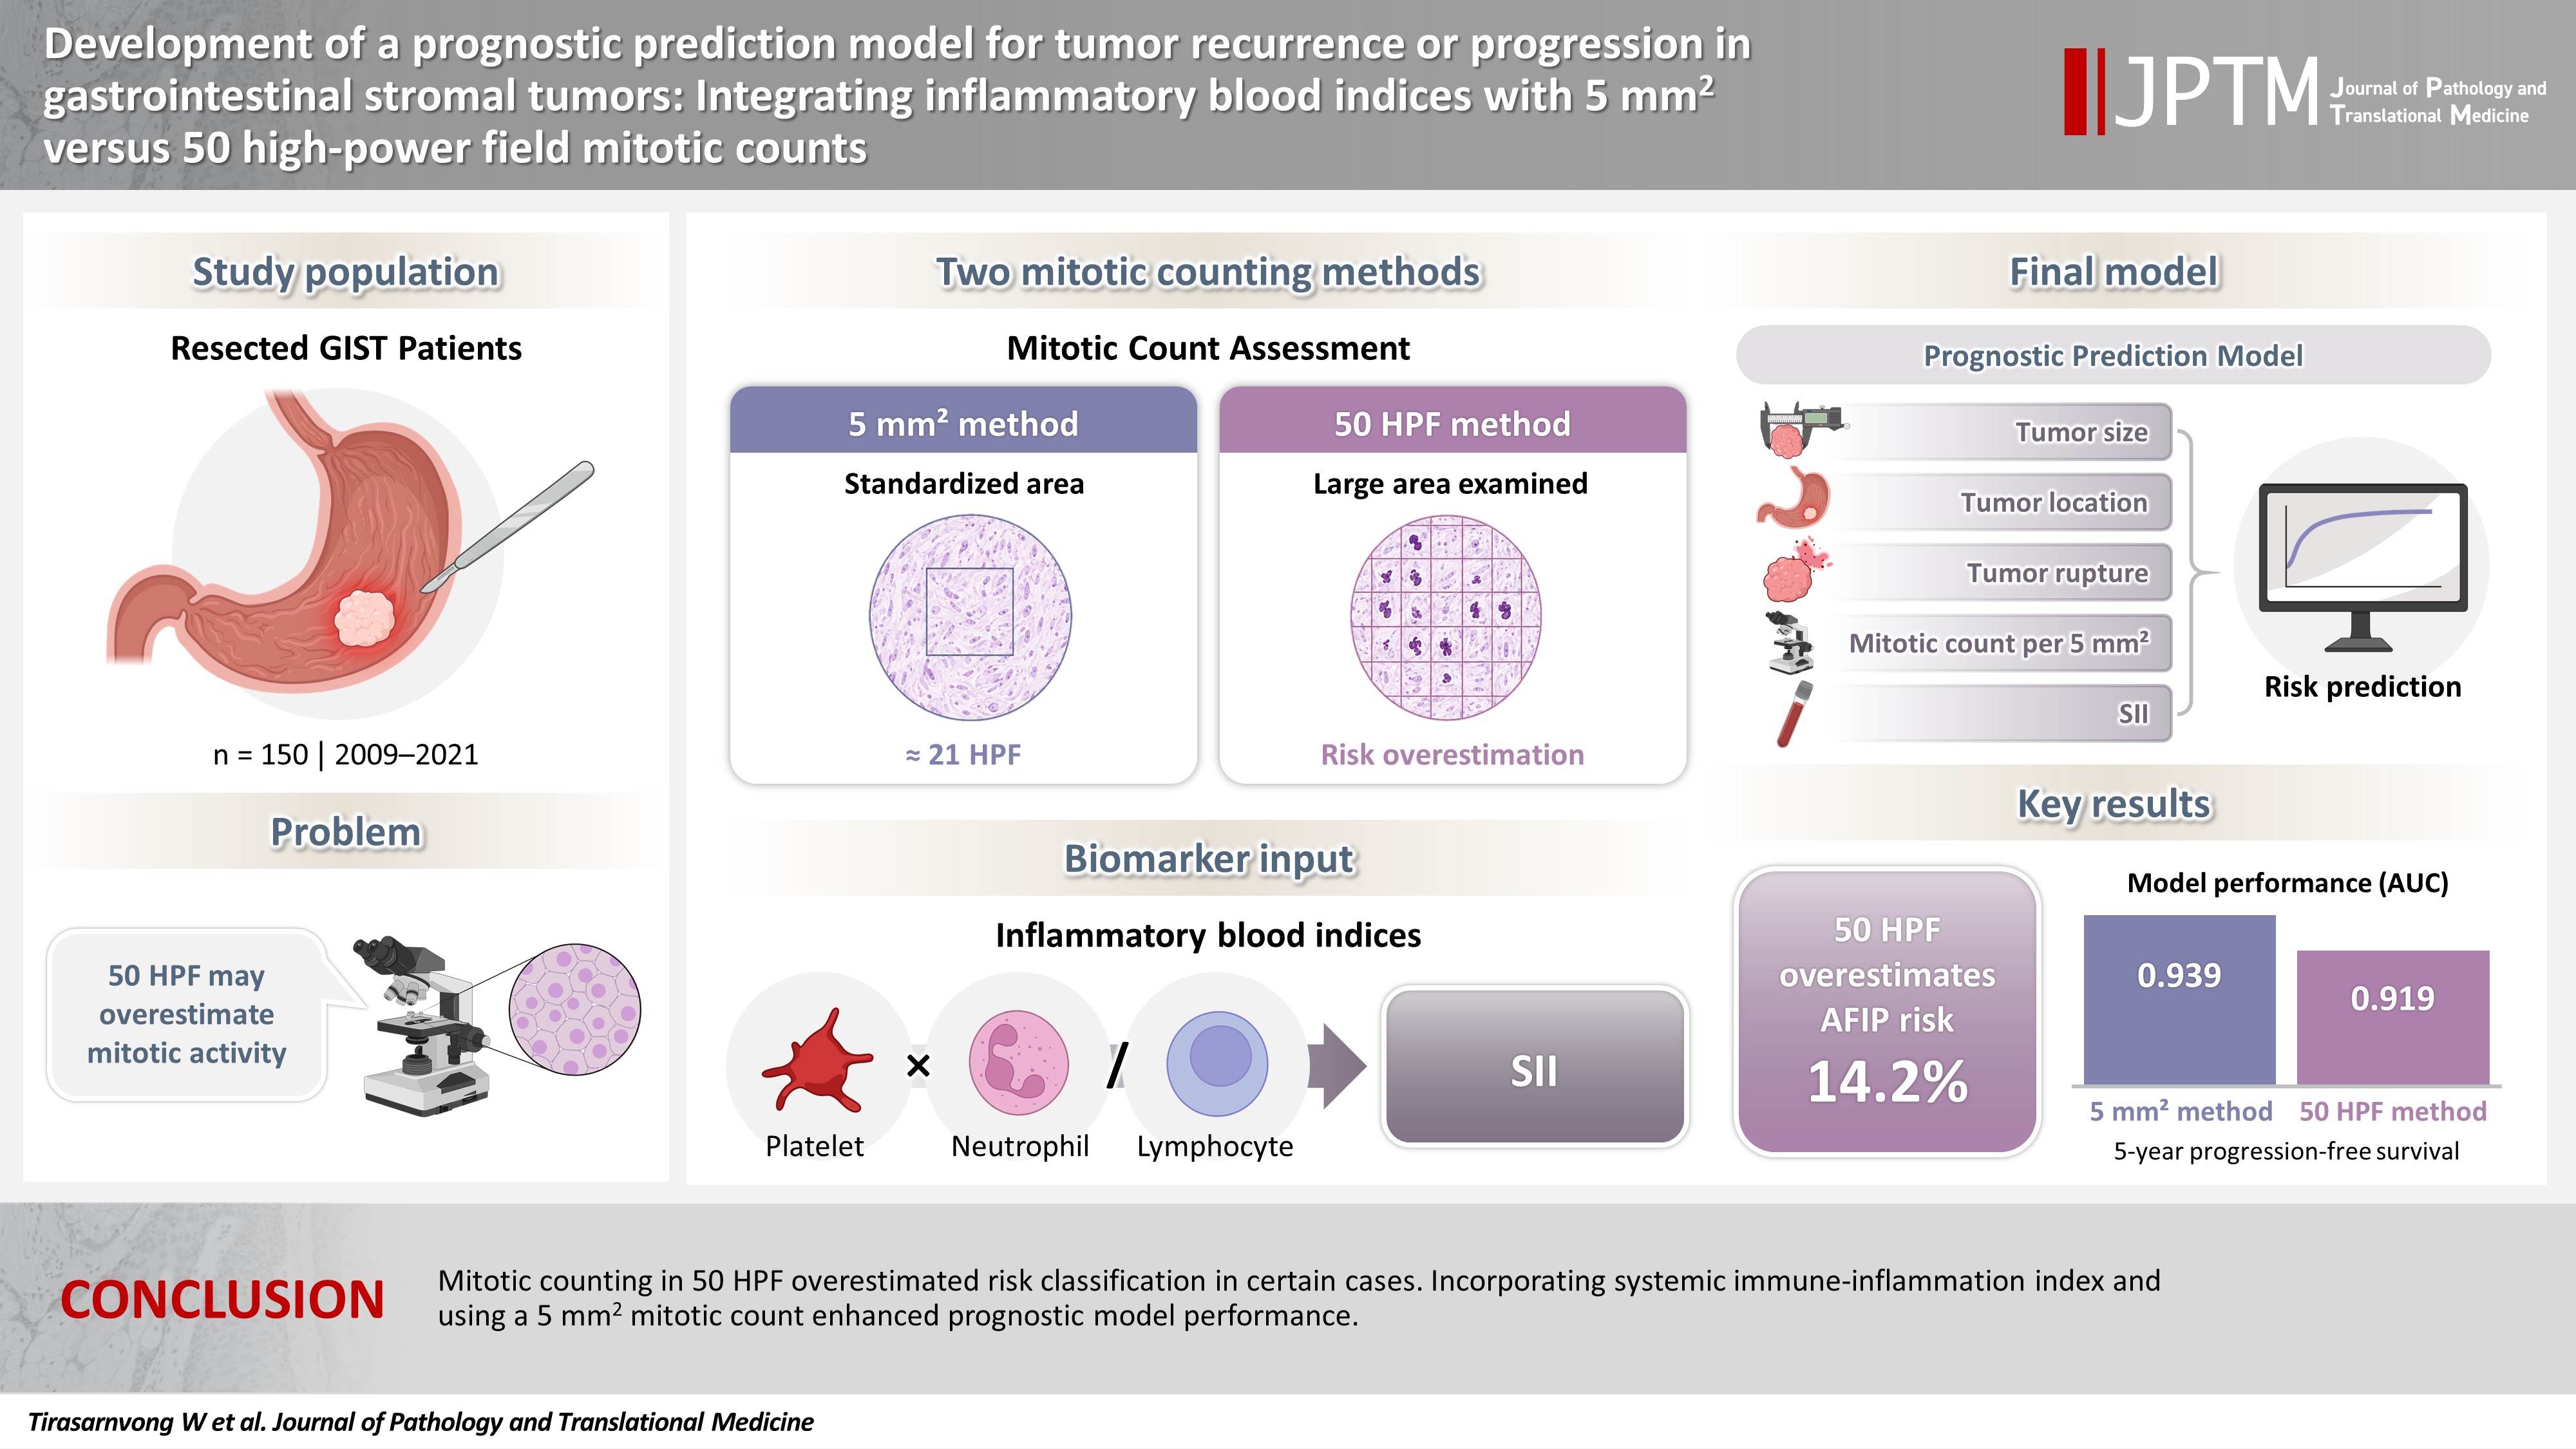
Fig. 1.
Fig. 2.
Fig. 3.
Fig. 4.
Graphical abstract
| Variable | No. (%) |
|---|---|
| Tumor location | |
| Gastric | 82 (54.7) |
| Non-gastric | 68 (45.3) |
| PNI | |
| Low (≤53.2) | 90 (60.0) |
| High (>53.2) | 33 (22.0) |
| Unknown | 27 (18.0) |
| HALP | |
| Low (≤45.3) | 91 (60.7) |
| High (>45.3) | 32 (21.3) |
| Unknown | 27 (18.0) |
| SII | |
| Low (≤1,358.6) | 114 (76.0) |
| High (>1,358.6) | 36 (24.0) |
| PLR | |
| Low (≤16.5) | 104 (69.3) |
| High (>16.5) | 46 (30.7) |
| NLR | |
| Low (≤2.8) | 86 (57.3) |
| High (>2.8) | 64 (42.7) |
| MLR | |
| Low (≤0.23) | 85 (56.7) |
| High (>0.23) | 65 (43.3) |
| Tumor rupture | |
| Absent | 127 (84.7) |
| Present | 23 (15.3) |
| Tumor size (cm) | |
| ≤5 | 59 (39.3) |
| >5 | 91 (60.7) |
| Mitotic count per 5 mm2 | |
| ≤5 | 94 (62.7) |
| >5 | 56 (37.3) |
| Mitotic count per 50 HPF | |
| ≤5 | 72 (48.0) |
| >5 | 78 (52.0) |
| Tumor necrosis | |
| Absent | 104 (69.3) |
| Present | 46 (30.7) |
| Histologic subtype | |
| Spindle | 127 (84.7) |
| Epithelioid | 3 (2.0) |
| Mixed | 20 (13.3) |
| Ulceration | |
| Absent | 81 (54.0) |
| Present | 59 (39.3) |
| Unknown | 10 (6.7) |
| Mucosal invasion | |
| Absent | 131 (87.3) |
| Present | 19 (12.7) |
| Muscle invasion | |
| Absent | 50 (33.3) |
| Present | 85 (56.7) |
| Unknown | 15 (10.0) |
| Serosal involvement | |
| Absent | 19 (12.7) |
| Present | 121 (80.7) |
| Unknown | 10 (6.7) |
| Mitosis per 5 mm2 | Mitosis per 50 HPF | ||||
|---|---|---|---|---|---|
| None | Very low | Low | Moderate | High | |
| None | 12 | 0 | 0 | 0 | 0 |
| Very low | 0 | 13 | 0 | 6 | 0 |
| Low | 0 | 0 | 28 | 0 | 11 |
| Moderate | 0 | 0 | 0 | 20 | 3 |
| High | 0 | 0 | 0 | 0 | 48 |
| Variable | Univariate analysis | Multivariable analysis | ||
|---|---|---|---|---|
| HR (95% CI) | p-value | HR (95% CI) | p-value | |
| Tumor location | ||||
| Gastric | 1 | 1 | ||
| Non-gastric | 0.65 (0.32–1.32) | .233 | 0.72 (0.30–1.70) | .455 |
| Tumor rupture | ||||
| Absence | 1 | 1 | ||
| Presence | 4.90 (2.36–10.18) | <.001 | 1.98 (0.83–4.72) | .122 |
| Tumor size (cm) | ||||
| ≤5 | 1 | 1 | ||
| >5 | 37.97 (5.18–278.40) | <.001 | 18.83 (2.49–142.27) | .004 |
| Mitosis (5 mm2) | ||||
| ≤5 | 1 | 1 | ||
| >5 | 10.98 (4.90–24.58) | <.001 | 6.50 (2.75–15.33) | <.001 |
| Mitosis (50 HPF) | ||||
| ≤5 | 1 | - | - | |
| >5 | 7.45 (3.04–18.25) | <.001 | ||
| PNI | ||||
| Low | 1 | - | - | |
| High | 0.86 (0.41–1.80) | .686 | ||
| HALP | ||||
| Low | 1 | - | - | |
| High | 1.16 (0.52–2.58) | .713 | ||
| SII | ||||
| Low | 1 | 1 | ||
| High | 2.65 (1.28–5.48) | .009 | 1.89 (0.88–4.08) | .103 |
| PLR | ||||
| Low | 1 | 1 | ||
| High | 2.60 (1.31–5.18) | .007 | 2.20 (1.05–4.59) | .036 |
| NLR | ||||
| Low | 1 | - | - | |
| High | 1.45 (0.73–2.88) | .293 | ||
| MLR | ||||
| Low | 1 | 1 | ||
| High | 2.17 (1.09–4.33) | .028 | 0.72 (0.33–1.58) | .418 |
| Model | Original model (AUC, 95% CI) | Validation set (AUC, 95% CI) | ||
|---|---|---|---|---|
| 5 mm2 | 50 HPF | 5 mm2 | 50 HPF | |
| Size + mitosis + site + rupture | 0.920 (0.867–0.974) | 0.910 (0.855–0.966) | 0.921 (0.860–0.970) | 0.912 (0.850–0.957) |
| Size + mitosis + site + rupture + SII | 0.939 (0.894–0.983) | 0.919 (0.867–0.971) | 0.939 (0.889–0.979) | 0.921 (0.861–0.964) |
| AFIP classification |
0.899 (0.841–0.956) | 0.874 (0.814–0.934) | 0.897 (0.834–0.952) | 0.873 (0.809–0.934) |
| AFIP classification |
0.916 (0.861–0.972) | 0.890 (0.826–0.954) | 0.916 (0.858–0.966) | 0.890 (0.819–0.942) |
| Modified NIH classification | 0.839 (0.779–0.899) | 0.814 (0.752–0.875) | 0.839 (0.785–0.898) | 0.813 (0.750–0.868) |
| Modified NIH classification + SII | 0.876 (0.814–0.937) | 0.853 (0.786–0.920) | 0.877 (0.819–0.936) | 0.854 (0.785–0.916) |
| 8th edition AJCC staging | 0.875 (0.808–0.943) | 0.849 (0.778–0.920) | 0.884 (0.815–0.949) | 0.845 (0.770–0.913) |
| 8th edition AJCC staging + SII | 0.908 (0.852–0.965) | 0.875 (0.808–0.942) | 0.908 (0.851–0.963) | 0.876 (0.809–0.929) |
PNI, prognostic nutritional index; HALP, hemoglobin, albumin, lymphocyte, and platelet; SII, systemic immune-inflammation index; PLR, platelet-to-lymphocyte ratio; NLR, neutrophil-to-lymphocyte ratio; MLR, monocyte-to-lymphocyte ratio.
Data are presented as the number of cases. AFIP, Armed Forces Institute of Pathology; HPF, high-power fields.
DFS, disease-free survival; HR, hazard ratio; CI, confidence interval; HPF, high-power fields; PNI, prognostic nutritional index; HALP, hemoglobin, albumin, lymphocyte, and platelet; SII, systemic immune-inflammation index; PLR, platelet-to-lymphocyte ratio; NLR, neutrophil-to-lymphocyte ratio; MLR, monocyte-to-lymphocyte ratio. The results of PLR and MLR in multivariable analysis were analyzed separately due to the strong correlation between the SII, PLR and MLR. The other variables included in both multivariable analyses were similar, as shown in this table.
DFS/PFS, disease-free survival/progression-free survival; AUC, area under the curve; CI, confidence interval; HPF, high-power fields; SII, systemic immune-inflammation index; AFIP, Armed Forces Institute of Pathology; NIH, National Institutes of Health; AJCC, American Joint Committee on Cancer. AFIP risk grouping was feasible in 141 patients.


