 E-submission
Articles
- Page Path
- HOME > J Pathol Transl Med > Volume 46(4); 2012 > Article
-
Original Article
The Histologic Cut-off Point for Adjacent and Remote Non-neoplastic Liver Parenchyma of Hepatocellular Carcinoma in Chronic Hepatitis B Patients - Hae Yoen Jung1, Soo Hee Kim2, Jin Jing1, Jae Moon Gwak1, Chul Ju Han3, Ja-June Jang1, Kyoung-Bun Lee1,4
-
Korean Journal of Pathology 2012;46(4):349-358.
DOI: https://doi.org/10.4132/KoreanJPathol.2012.46.4.349
Published online: August 23, 2012
1Department of Pathology, Seoul National University College of Medicine, Seoul, Korea.
2Department of Pathology, National Cancer Center Korea, Goyang, Korea.
3Department of Internal Medicine, Korea Institute of Radiological and Medical Sciences, Seoul, Korea.
4Department of Pathology, Seoul National University Hospital, Seoul National University College of Medicine, Seoul, Korea.
- Corresponding Author: Kyoung-Bun Lee, M.D. Department of Pathology, Seoul National University Hospital, 101 Daehak-ro, Jongno-gu, Seoul 110-744, Korea. Tel: +82-2-2072-2699, Fax: +82-2-743-5530, azirang@chol.com, azi1003@snu.ac.kr
© 2012 The Korean Society of Pathologists/The Korean Society for Cytopathology
This is an Open Access article distributed under the terms of the Creative Commons Attribution Non-Commercial License (http://creativecommons.org/licenses/by-nc/3.0) which permits unrestricted non-commercial use, distribution, and reproduction in any medium, provided the original work is properly cited.
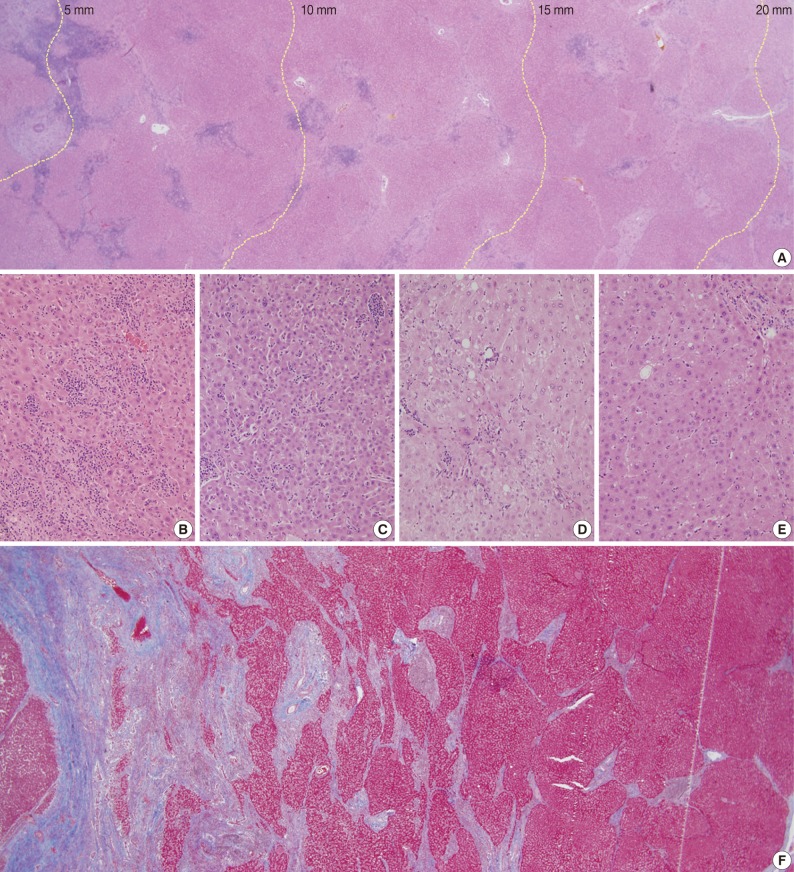
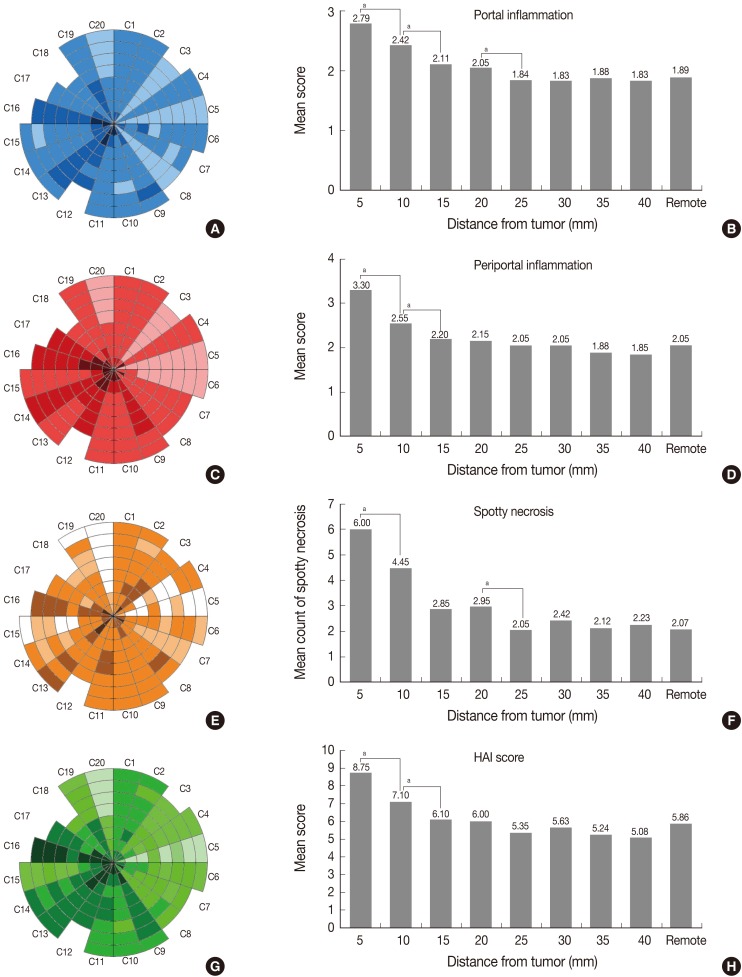
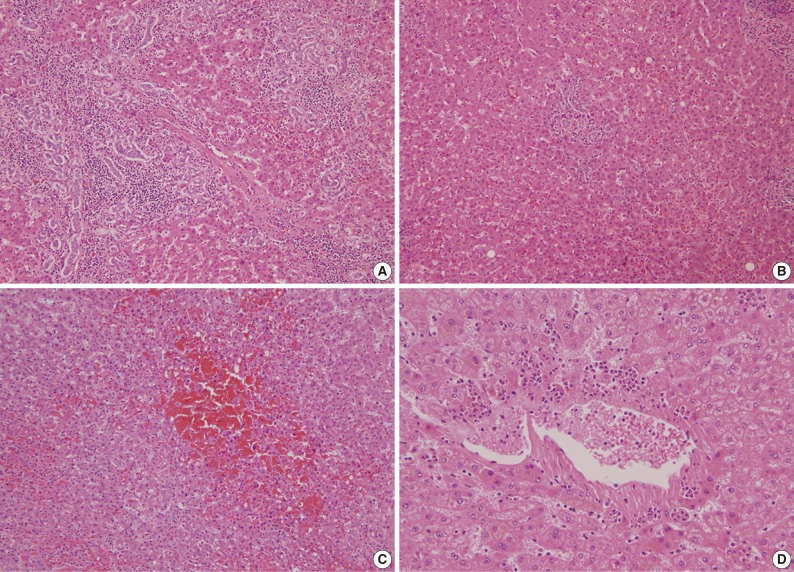
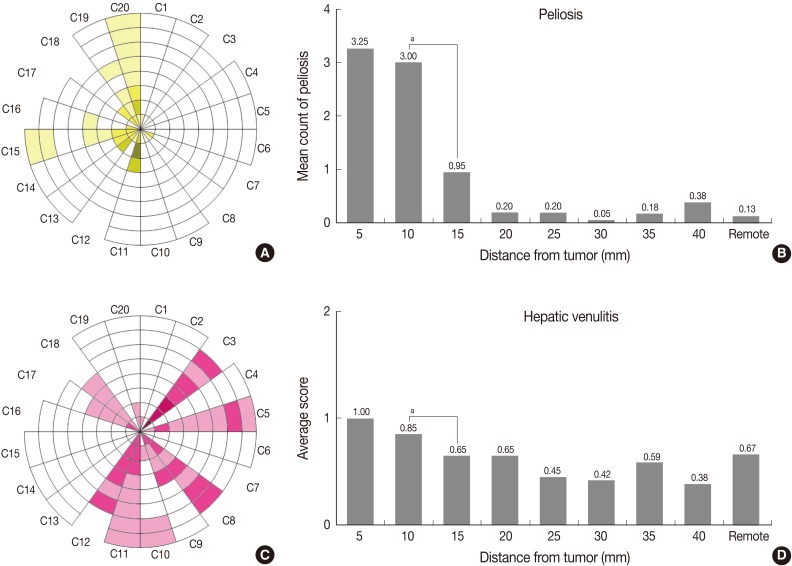
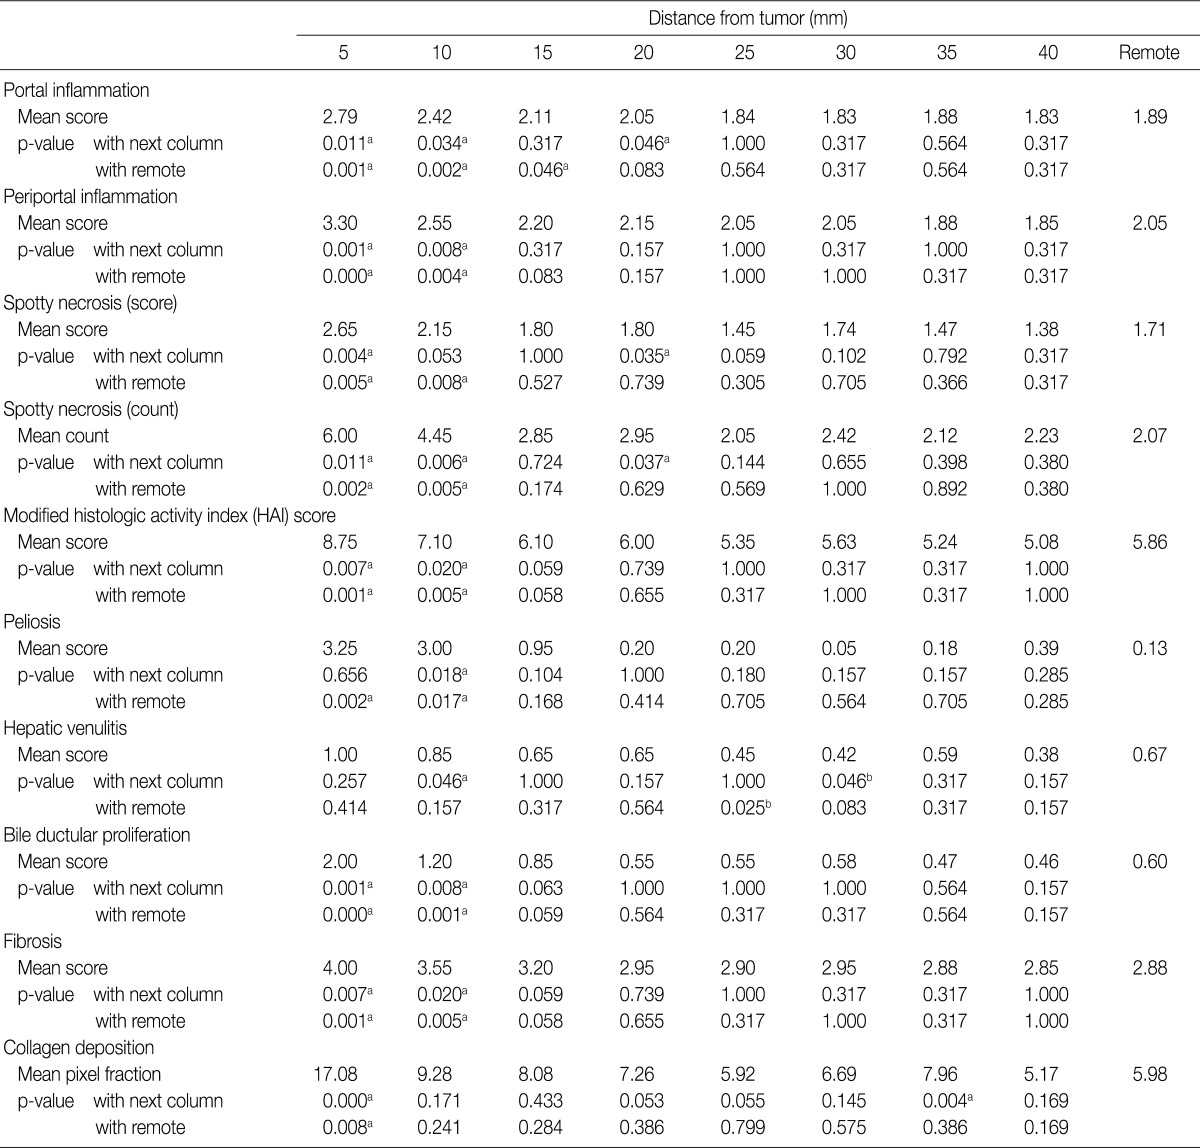
Figure & Data
References
Citations
- Multi-omics profiling reveals cholic acid-mediated immunosuppression driven by peritumoral ductular reactions in hepatocellular carcinoma
Qianhui Xu, Hang Chen, Ganggang Wang, Xiaodong Wang, JieYi Shi, Yifei Cheng, Yanan Xu, Sainan Ma, Siqi Guo, Xiyang Liu, Qiang Gao, Guohe Song
Cancer Letters.2026; 646: 218393. CrossRef - Does very high alpha-fetoprotein affect very early hepatocellular carcinoma receiving hepatectomy?
Hong-Shiue Chou, Chen-Fang Lee, Hao-Chien Hung, Yin Lai, Jin-Chiao Lee, Yu-Chao Wang, Chih-Hsien Cheng, Tsung-Han Wu, Ting-Jung Wu, Kun-Ming Chan, Wei-Chen Lee
Langenbeck's Archives of Surgery.2025;[Epub] CrossRef - Evaluation of the effects of dimethyl fumarate on transforming growth factor beta levels in the liver of rats with bile duct ligation-induced cholestasis
Hannaneh Vossoughi, Pejman Mortazavi, Mahsa Ale-Ebrahim, Razieh Hosseini
Toxicology Reports.2025; 15: 102115. CrossRef - Peritumoral histopathologic findings in patients with chronic viral hepatitis‐associated hepatocellular carcinoma
Burcin Pehlivanoglu, Anil Aysal, Cihan Agalar, Tufan Egeli, Mucahit Ozbilgin, Tarkan Unek, Tugba Unek, Ilhan Oztop, Ozgul Sagol
APMIS.2022; 130(6): 346. CrossRef - Prognostic value of non-invasive fibrosis indices post-curative resection in hepatitis-B-associated hepatocellular carcinoma patients
Ting-Ting Zhang, Si-Si Ye, Jun Liang, Li Bai
Experimental Biology and Medicine.2020; 245(8): 703. CrossRef - Evaluation of Peritumoral Fibrosis in Metastatic Colorectal Adenocarcinoma to the Liver Using Digital Image Analysis
Kevin M Waters, Tricia R Cottrell, Sepideh Besharati, Qingfeng Zhu, Robert A Anders
American Journal of Clinical Pathology.2019; 151(2): 226. CrossRef - Fibrosis-4 Model Influences Results of Patients with Hepatocellular Carcinoma Undergoing Hepatectomy
Haiqing Wang, Aixiang Liu, Wentao Bo, Xielin Feng, Yong Hu, Lang Tian, Hui Zhang, Xiaoli Tang, Lixia Zhang
BioMed Research International.2018; 2018: 1. CrossRef - Forns index predicts recurrence and death in patients with hepatitis B‐related hepatocellular carcinoma after curative resection
Won‐Mook Choi, Jeong‐Hoon Lee, Hongkeun Ahn, Hyeki Cho, Young Youn Cho, Minjong Lee, Jeong‐ju Yoo, Yuri Cho, Dong Hyeon Lee, Yun Bin Lee, Eun Ju Cho, Su Jong Yu, Nam‐Joon Yi, Kwang‐Woong Lee, Yoon Jun Kim, Jung‐Hwan Yoon, Kyung‐Suk Suh, Chung Yong Kim, Hy
Liver International.2015; 35(8): 1992. CrossRef - Renal Histologic Parameters Influencing Postoperative Renal Function in Renal Cell Carcinoma Patients
Myoung Ju Koh, Beom Jin Lim, Kyu Hun Choi, Yon Hee Kim, Hyeon Joo Jeong
Korean Journal of Pathology.2013; 47(6): 557. CrossRef
 PubReader
 Cite this Article


Fig. 1
Fig. 2
Fig. 3
Fig. 4
Fig. 5

ap<0.05; the grade of this column is higher than the next column or the remote parenchyma; bp<0.05; the grade of this column is lower than the next column or the remote parenchyma.

