Articles
- Page Path
- HOME > J Pathol Transl Med > Volume 51(2); 2017 > Article
-
Original Article
GLUT1 as a Prognostic Factor for Classical Hodgkin’s Lymphoma: Correlation with PD-L1 and PD-L2 Expression - Young Wha Koh, Jae-Ho Han, Seong Yong Park1, Dok Hyun Yoon2, Cheolwon Suh2, Jooryung Huh3
-
Journal of Pathology and Translational Medicine 2017;51(2):152-158.
DOI: https://doi.org/10.4132/jptm.2016.11.03
Published online: February 21, 2017
Department of Pathology, Ajou University School of Medicine, Suwon, Korea
1Department of Thoracic and Cardiovascular Surgery, Ajou University School of Medicine, Suwon, Korea
2Department of Oncology, Asan Medical Center, University of Ulsan College of Medicine, Seoul, Korea
3Department of Pathology, Asan Medical Center, University of Ulsan College of Medicine, Seoul, Korea
- Corresponding Author Jooryung Huh, MD Department of Pathology, Asan Medical Center, University of Ulsan College of Medicine, 88 Olympic-ro 43-gil, Songpa-gu, Seoul 05505, Korea Tel: +82-2-3010-4553 Fax: +82-2-472-7898 E-mail: jrhuh@amc.seoul.kr
© 2017 The Korean Society of Pathologists/The Korean Society for Cytopathology
This is an Open Access article distributed under the terms of the Creative Commons Attribution Non-Commercial License (http://creativecommons.org/licenses/by-nc/4.0/) which permits unrestricted noncommercial use, distribution, and reproduction in any medium, provided the original work is properly cited.
Figure & Data
References
Citations

- Transcriptomic and miRNA Signatures of ChAdOx1 nCoV-19 Vaccine Response Using Machine Learning
Jinting Lin, Qinglan Ma, Lei Chen, Wei Guo, Kaiyan Feng, Tao Huang, Yu-Dong Cai
Life.2025; 15(6): 981. CrossRef - Metabolic Reprogramming and Potential Therapeutic Targets in Lymphoma
Yuyang Pang, Tingxun Lu, Zijun Y. Xu-Monette, Ken H. Young
International Journal of Molecular Sciences.2023; 24(6): 5493. CrossRef - Peptide-based PROTAC degrader of FOXM1 suppresses cancer and decreases GLUT1 and PD-L1 expression
Kun Wang, Xiaoyong Dai, Albert Yu, Chunyan Feng, Kewei Liu, Laiqiang Huang
Journal of Experimental & Clinical Cancer Research.2022;[Epub] CrossRef - TIMP-1 Dependent Modulation of Metabolic Profiles Impacts Chemoresistance in NSCLC
Wei Xiao, Pankaj Ahluwalia, Lan Wang, John Howard, Ravindra Kolhe, Amyn M. Rojiani, Mumtaz V. Rojiani
Cells.2022; 11(19): 3036. CrossRef - Hypoxia-related tumor environment correlated with immune infiltration and therapeutic sensitivity in diffuse large B-cell lymphoma
Chen Liu, Lin Liu
Frontiers in Genetics.2022;[Epub] CrossRef - Non-invasive measurement of PD-L1 status and prediction of immunotherapy response using deep learning of PET/CT images
Wei Mu, Lei Jiang, Yu Shi, Ilke Tunali, Jhanelle E Gray, Evangelia Katsoulakis, Jie Tian, Robert J Gillies, Matthew B Schabath
Journal for ImmunoTherapy of Cancer.2021; 9(6): e002118. CrossRef - Tumor immunity is related to 18F‐FDG uptake in thymic epithelial tumor
Hisao Imai, Kyoichi Kaira, Kosuke Hashimoto, Hiroyuki Nitanda, Ryo Taguchi, Akitoshi Yanagihara, Tetsuya Umesaki, Ou Yamaguchi, Atsuto Mouri, Tomonori Kawasaki, Masanori Yasuda, Kunihiko Kobayashi, Hirozo Sakaguchi, Ichiei Kuji, Hiroshi Kagamu
Cancer Medicine.2021; 10(18): 6317. CrossRef - Transcutaneous Carbon Dioxide Decreases Immunosuppressive Factors in Squamous Cell Carcinoma In Vivo
Nanae Yatagai, Takumi Hasegawa, Rika Amano, Izumi Saito, Satomi Arimoto, Daisuke Takeda, Yasumasa Kakei, Masaya Akashi, Peter J. Oefner
BioMed Research International.2021;[Epub] CrossRef - Current Role of Functional Imaging in the Management of Lymphoma
Bruce D. Cheson, Michel Meignan
Current Oncology Reports.2021;[Epub] CrossRef - Diagnostic value of 18F-FDG-PET to predict the tumour immune status defined by tumoural PD-L1 and CD8+tumour-infiltrating lymphocytes in oral squamous cell carcinoma
Maria Togo, Takehiko Yokobori, Kimihiro Shimizu, Tadashi Handa, Kyoichi Kaira, Takaaki Sano, Mariko Tsukagoshi, Tetsuya Higuchi, Satoshi Yokoo, Ken Shirabe, Tetsunari Oyama
British Journal of Cancer.2020; 122(11): 1686. CrossRef - Role of the tumor microenvironment in PD-L1/PD-1-mediated tumor immune escape
Xianjie Jiang, Jie Wang, Xiangying Deng, Fang Xiong, Junshang Ge, Bo Xiang, Xu Wu, Jian Ma, Ming Zhou, Xiaoling Li, Yong Li, Guiyuan Li, Wei Xiong, Can Guo, Zhaoyang Zeng
Molecular Cancer.2019;[Epub] CrossRef - Fluorodeoxyglucose uptake is associated with low tumor-infiltrating lymphocyte levels in patients with small cell lung cancer
Norimitsu Kasahara, Kyoichi Kaira, Koichi Yamaguchi, Hiroaki Masubuchi, Hiroaki Tsurumaki, Kenichiro Hara, Yasuhiko Koga, Reiko Sakurai, Tetsuya Higuchi, Tadashi Handa, Tetsunari Oyama, Takehiko Yokobori, Kimihiro Shimizu, Takayuki Asao, Takeshi Hisada
Lung Cancer.2019; 134: 180. CrossRef - MYC Expression and Metabolic Redox Changes in Cancer Cells: A Synergy Able to Induce Chemoresistance
Barbara Marengo, Ombretta Garbarino, Andrea Speciale, Lorenzo Monteleone, Nicola Traverso, Cinzia Domenicotti
Oxidative Medicine and Cellular Longevity.2019; 2019: 1. CrossRef - Sustain, Adapt, and Overcome—Hypoxia Associated Changes in the Progression of Lymphatic Neoplasia
Orsolya Matolay, Gábor Méhes
Frontiers in Oncology.2019;[Epub] CrossRef - Correlation of tumor-related immunity with 18F-FDG-PET in pulmonary squamous-cell carcinoma
Norimitsu Kasahara, Kyoichi Kaira, Pinjie Bao, Tetsuya Higuchi, Yukiko Arisaka, Bilguun Erkhem-Ochir, Noriaki Sunaga, Yoichi Ohtaki, Toshiki Yajima, Takayuki Kosaka, Tetsunari Oyama, Takehiko Yokobori, Takayuki Asao, Masahiko Nishiyama, Yoshito Tsushima,
Lung Cancer.2018; 119: 71. CrossRef - High Serum Level of Soluble Programmed Death Ligand 1 is Associated With a Poor Prognosis in Hodgkin Lymphoma
Xiaofang Guo, Juan Wang, Jietian Jin, Hao Chen, Zijun Zhen, Wenqi Jiang, Tongyu Lin, Huiqiang Huang, Zhongjun Xia, Xiaofei Sun
Translational Oncology.2018; 11(3): 779. CrossRef - Hodgkin lymphoma and imaging in the era of anti-PD-1/PD-L1 therapy
Margarita Kirienko, Martina Sollini, Arturo Chiti
Clinical and Translational Imaging.2018; 6(6): 417. CrossRef - New developments in the pathology of malignant lymphoma: a review of the literature published from January to April 2017
J. Han van Krieken
Journal of Hematopathology.2017; 10(1): 25. CrossRef - Programmed cell death ligands expression in phaeochromocytomas and paragangliomas: Relationship with the hypoxic response, immune evasion and malignant behavior
David J. Pinato, James R. Black, Sebastian Trousil, Roberto E. Dina, Pritesh Trivedi, Francesco A. Mauri, Rohini Sharma
OncoImmunology.2017; 6(11): e1358332. CrossRef
 PubReader
 ePub Link
-
 Cite this Article
- Cite this Article
-
- Close
- Download Citation
- Close
- Figure


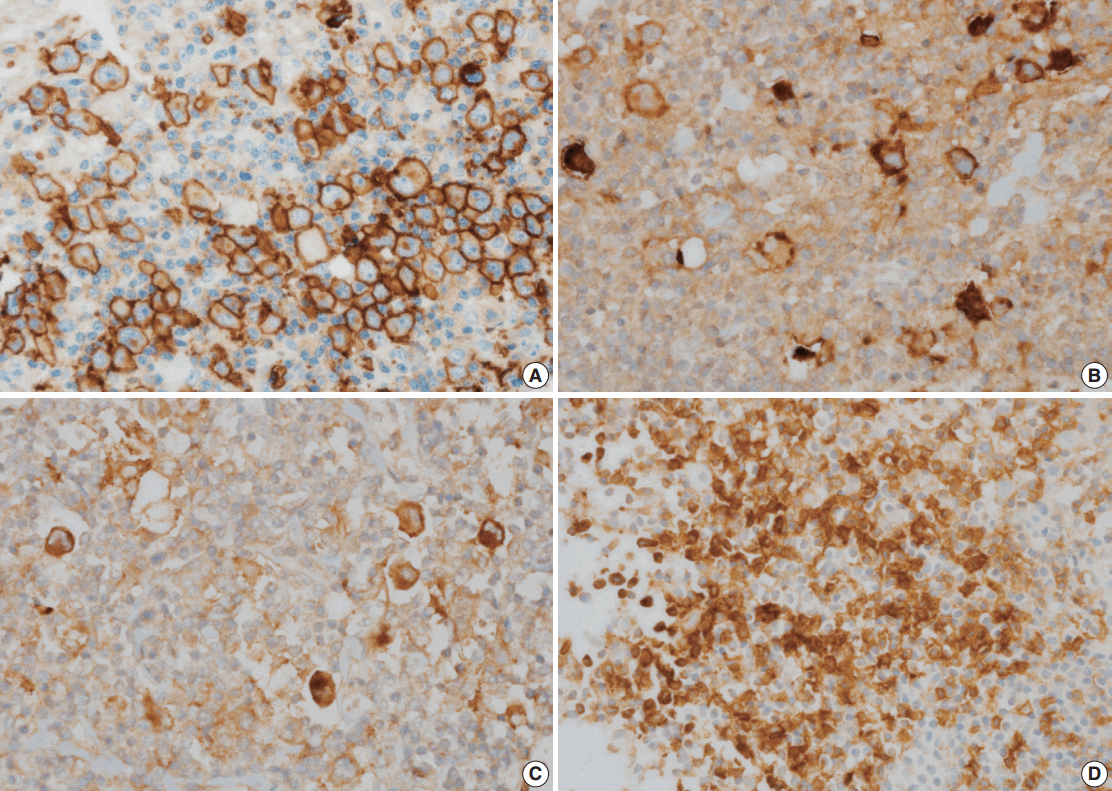
Fig. 1.
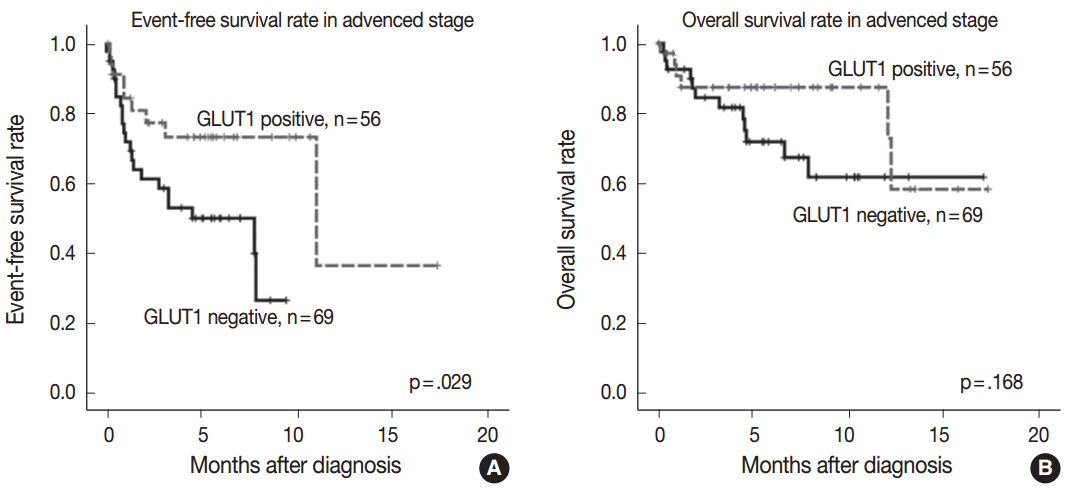
Fig. 2.
| Characteristics at diagnosis | No. of patients (%) |
|---|---|
| Age, median (range, yr) | 39 (15–78) |
| Male gender | 74 (59.2) |
| Histologic subtype | |
| Nodular sclerosis | 83 (66.4) |
| Mixed cellularity | 27 (21.6) |
| Lymphocyte-rich | 6 (4.8) |
| Lymphocyte-depleted | 3 (2.4) |
| Not classifiable | 6 (4.8) |
| Ann Arbor stage | |
| I | 26 (20.8) |
| II | 41 (32.8) |
| III | 29 (23.2) |
| IV | 29 (23.2) |
| Stage (limited vs advanced) | |
| Limited | 48 (38.4) |
| Advanced | 77 (61.6) |
| B symptoms present | 41 (32.8) |
| International Prognostic Score ≥ 3 (high-risk) | 49 (39.2) |
| EBER positivity | 49 (39.2) |
| Primary treatment | |
| Chemotherapy | 95 (76.0) |
| Chemoradiotherapy | 30 (24.0) |
| Characteristic | GLUT1 expression |
p-value | |
|---|---|---|---|
| Low (< 20%) (n = 69) | High (≥ 20%) (n = 56) | ||
| Age (yr) | .858 |
||
| <45 | 38 (55.1) | 32 (57.1) | |
| ≥45 | 31 (44.9) | 24 (42.9) | |
| Gender | .276 |
||
| Male | 44 (63.8) | 30 (53.6) | |
| Female | 25 (36.2) | 26 (46.4) | |
| Disease subtype | .182 |
||
| Nodular sclerosis | 43 (62.3) | 40 (71.4) | |
| Mixed cellularity | 14 (20.3) | 13 (23.2) | |
| Lymphocyte-rich | 6 (8.7) | 0 | |
| Lymphocyte-depleted | 2 (2.9) | 1 (1.8) | |
| Not classifiable | 4 (5.8) | 2 (3.6) | |
| B symptom | .184 |
||
| Absent | 50 (72.5) | 34 (60.7) | |
| Present | 19 (27.5) | 22 (39.3) | |
| Ann Arbor stage | .586 |
||
| Limited | 28 (40.6) | 20 (35.7) | |
| Advanced | 41 (59.4) | 36 (64.3) | |
| IPS | .467 |
||
| < 3 | 44 (63.8) | 32 (57.1) | |
| ≥ 3 | 25 (36.2) | 24 (42.9) | |
| EBER | .467 |
||
| Negative | 44 (63.8) | 32 (57.1) | |
| Positive | 25 (36.2) | 24 (42.9) | |
| Primary treatment | .674 |
||
| Chemotherapy | 51 (73.9) | 44 (78.6) | |
| Chemoradiotherapy | 18 (26.1) | 12 (21.4) | |
| Characteristic | GLUT1 expression |
p-value | |
|---|---|---|---|
| Low (< 20%) (n = 69) | High (≥ 20%) (n = 56) | ||
| PD-L1 expression in HRS cells | .004 |
||
| Low (< 20%) | 19 (33.3) | 4 (8.9) | |
| High (≥ 20%) | 38 (66.7) | 41 (91.1) | |
| PD-L2 expression in HRS cells | .299 |
||
| Low (< 20%) | 54 (94.7) | 36 (80.0) | |
| High (≥ 20%) | 3 (5.3) | 9 (20.0) | |
| PD-1 expression in peritumoral microenvironment | .198 |
||
| Low (< 20%) | 57 (82.6) | 51 (91.1) | |
| High (≥ 20%) | 12 (17.4) | 5 (8.9) | |
| Covariate | HR | 95% CI | p-value |
|
|---|---|---|---|---|
| Univariate analysis | ||||
| Age | < 45 yr vs ≥ 45 yr | 3.22 | 1.47–7.05 | .003 |
| Sex | Female vs male | 1.52 | 0.72–3.20 | .271 |
| B symptoms | (–) vs (+) | 1.85 | 0.86–3.96 | .112 |
| EBER | (–) vs (+) | 1.64 | 0.94–2.85 | .081 |
| Lymphopenia | (–) vs (+) | 1.32 | 0.31–5.55 | .706 |
| Leukocytosis | (–) vs (+) | 1.38 | 0.46–4.14 | .563 |
| Hypoalbuminemia | (–) vs (+) | 1.65 | 0.62–4.31 | .311 |
| Anemia | (–) vs (+) | 2.31 | 1.07–4.94 | .032 |
| GLUT1 expression | (-) vs (+) | 0.42 | 0.18–0.94 | .035 |
| Multivariate analysis | ||||
| Age | < 45 yr vs ≥ 45 yr | 2.47 | 1.08–5.61 | .031 |
| Anemia | (–) vs (+) | 1.92 | 0.86–4.24 | .107 |
| GLUT1 expression | (–) vs (+) | 0.46 | 0.20–1.05 | .068 |
EBER, Epstein-Barr virus–encoded RNA-1 and RNA-2 assessed by
Values are presented as number (%). GLUT1, glucose transporter 1; IPS, International Prognostic Score; EBER, Epstein-Barr virus-encoded RNA-1 and RNA-2 assessed by Chi-squared test by two-sided Pearson’s test; Chi-squared test by two-sided Fisher test.
Values are presented as number (%). GLUT1, glucose transporter type 1; PD-L1, programmed death ligand 1; PD-L2, programmed death ligand 2; PD-1, programmed death-1; HRS, Hodgkin/Reed–Sternberg. Chi-squared test by two-sided Pearson’s test.
HR, hazard ratio; CI, confidence interval; EBER, Epstein-Barr virus–encoded RNA-1 and RNA-2 assessed by Cox univariate analysis.

 E-submission


