Articles
- Page Path
- HOME > J Pathol Transl Med > Volume 52(6); 2018 > Article
-
Original Article
Multiplicity of Advanced T Category–Tumors Is a Risk Factor for Survival in Patients with Colorectal Carcinoma -
Hye Eun Park1
 , Seungyeon Yoo1, Jeong Mo Bae1
 , Seorin Jeong2, Nam-Yun Cho2, Gyeong Hoon Kang,1,2
-
Journal of Pathology and Translational Medicine 2018;52(6):386-395.
DOI: https://doi.org/10.4132/jptm.2018.10.02
Published online: November 14, 2018
1Department of Pathology, Seoul National University Hospital, Seoul National University College of Medicine, Seoul, Korea
2Laboratory of Epigenetics, Cancer Research Institute, Seoul National University College of Medicine, Seoul, Korea
- Corresponding Author Gyeong Hoon Kang, MD, PhD Department of Pathology, Seoul National University College of Medicine, 103 Daehak-ro, Jongno-gu, Seoul 03080, Korea Tel: +82-2-740-8263 Fax: +82-2-765-5600 E-mail: ghkang@snu.ac.kr
© 2018 The Korean Society of Pathologists/The Korean Society for Cytopathology
This is an Open Access article distributed under the terms of the Creative Commons Attribution Non-Commercial License (http://creativecommons.org/licenses/by-nc/4.0) which permits unrestricted non-commercial use, distribution, and reproduction in any medium, provided the original work is properly cited.
Figure & Data
References
Citations

- Reveal the Regulation Patterns of Prognosis-Related miRNAs and lncRNAs Across Solid Tumors in the Cancer Genome Atlas
Zuojing Yin, Qiming Wang, Xinmiao Yan, Lu Zhang, Kailin Tang, Zhiwei Cao, Tianyi Qiu
Frontiers in Cell and Developmental Biology.2020;[Epub] CrossRef - Whole-Slide Image Analysis Reveals Quantitative Landscape of Tumor–Immune Microenvironment in Colorectal Cancers
Seung-Yeon Yoo, Hye Eun Park, Jung Ho Kim, Xianyu Wen, Seorin Jeong, Nam-Yun Cho, Hwang Gwan Gwon, Kwangsoo Kim, Hye Seung Lee, Seung-Yong Jeong, Kyu Joo Park, Sae-Won Han, Tae-You Kim, Jeong Mo Bae, Gyeong Hoon Kang
Clinical Cancer Research.2020; 26(4): 870. CrossRef
 PubReader
 ePub Link
-
 Cite this Article
- Cite this Article
-
- Close
- Download Citation
- Close
- Figure


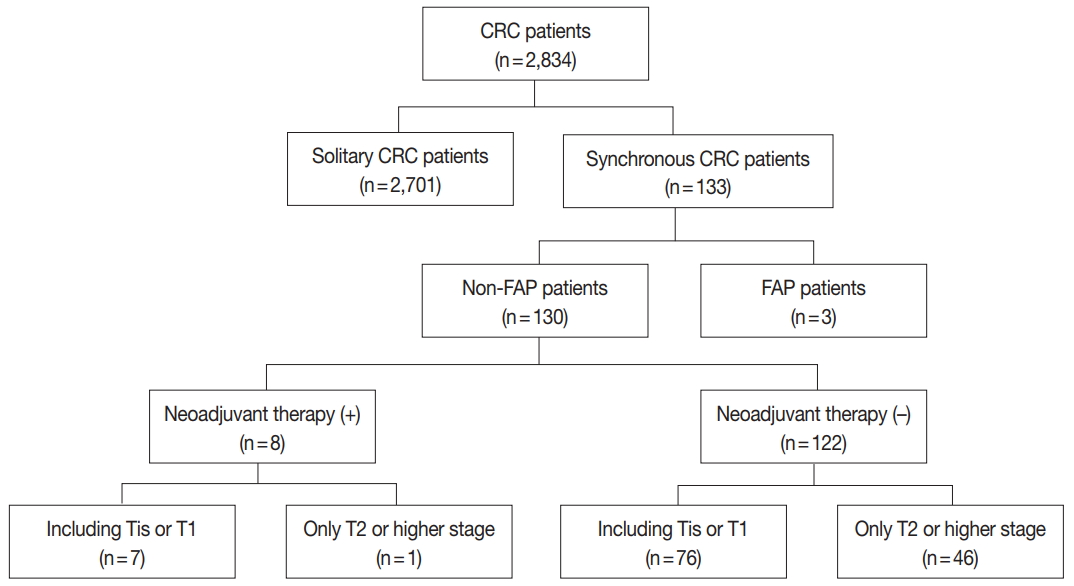
Fig. 1.
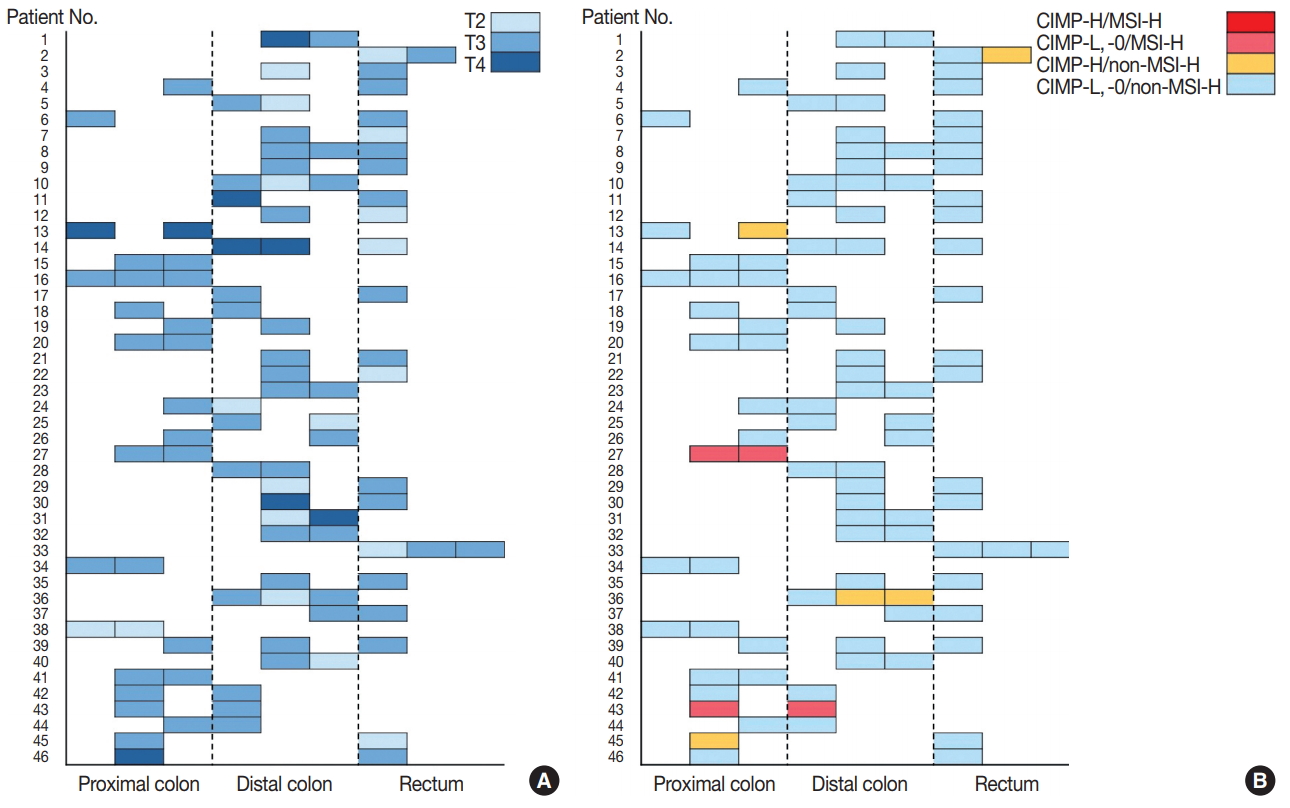
Fig. 2.
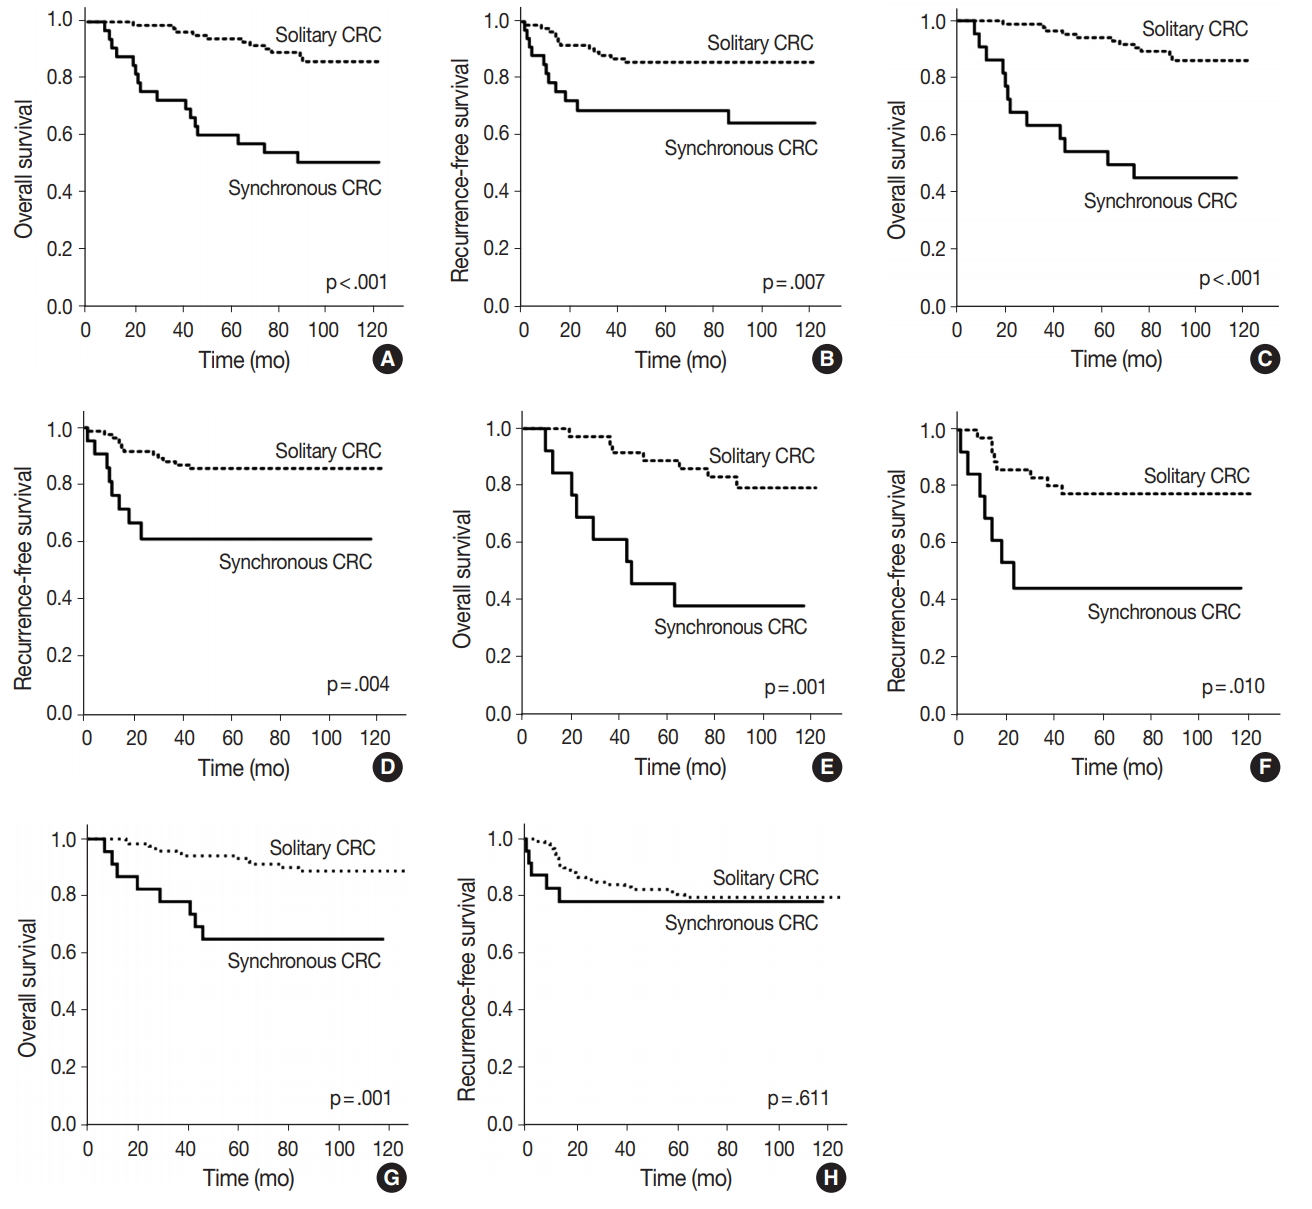
Fig. 3.
| Variable | Solitary CRCs (92 patients, 92 tumors) | Synchronous CRCs (46 patients, 99 tumors) | p-value |
|---|---|---|---|
| Age (yr) | 63.5 (33–82) | 66.0 (43–88) | .087 |
| Sex | .050 | ||
| Male | 59 (64.1) | 37 (80.4) | |
| Female | 33 (35.9) | 9 (19.6) | |
| Location | .247 | ||
| Proximal | 18 (19.6) | 29 (29.3) | |
| Distal | 48 (52.2) | 42 (42.4) | |
| Rectum | 26 (28.3) | 28 (28.3) | |
| Gross type | .114 | ||
| Polypoid | 11 (12.0) | 22 (22.2) | |
| Ulcerofungating | 61 (66.3) | 53 (53.5) | |
| Ulceroinfiltrative | 20 (21.7) | 24 (24.2) | |
| T category | .548 | ||
| T2 | 12 (13.0) | 18 (18.2) | |
| T3 | 73 (79.3) | 72 (72.7) | |
| T4 | 7 (7.6) | 9 (9.1) | |
| N category | .003 | ||
| N0 | 49 (53.3) | 12 (26.1) | |
| N1, N2 | 43 (46.7) | 34 (73.9) | |
| M category | .001 | ||
| M0 | 73 (79.3) | 23 (50.0) | |
| Synchronous M1 | 7 (7.6) | 12 (26.1) | |
| Metachronous M1 | 12 (13.0) | 11 (23.9) | |
| Stage | .003 | ||
| I | 9 (9.8) | 1 (2.2) | |
| II | 40 (43.5) | 11 (23.9) | |
| III | 36 (39.1) | 22 (47.8) | |
| IV | 7 (7.6) | 12 (26.1) | |
| Surgery | < .001 | ||
| Simple | 92 | 30 (65.2) | |
| Extensive | 0 | 16 (34.8) | |
| Chemotherapy | 1.000 | ||
| Treated | 80 (87.0) | 40 (87.0) | |
| Non-treated | 12 (13.0) | 6 (13.0) | |
| Differentiation | .722 |
||
| Well | 9 (9.8) | 9 (9.1) | |
| Moderately | 78 (84.8) | 87 (87.9) | |
| Poorly | 5 (5.4) | 3 (3.0) | |
| Lymphatic invasion | .068 | ||
| Absent | 73 (79.3) | 67 (67.7) | |
| Present | 19 (20.7) | 32 (32.3) | |
| Venous invasion | .086 | ||
| Absent | 86 (93.5) | 85 (85.9) | |
| Present | 6 (6.5) | 14 (14.1) | |
| Perineural invasion | .986 | ||
| Absent | 80 (87.0) | 86 (86.9) | |
| Present | 12 (13.0) | 13 (13.1) | |
| MSI | 0.740 |
||
| MSS/MSI-low | 87 (94.6) | 95 (96.0) | |
| MSI-high | 5 (5.4) | 4 (4.0) | |
| KRAS mutation | .908 | ||
| Wild type | 55 (59.8) | 60 (60.6) | |
| Mutant | 37 (40.2) | 39 (39.4) | |
| CIMP | .761 | ||
| CIMP-0, low | 86 (93.5) | 94 (94.9) | |
| CIMP-high | 6 (6.5) | 5 (5.1) |
| Variable | Total cases of CRC |
CRC cases with R0 resection |
CRC cases with non-extensive surgery |
|||
|---|---|---|---|---|---|---|
| Solitary CRC (n = 92) | SCRC (n = 46) | Solitary CRC (n = 85) | SCRC (n = 34) | Solitary CRC (n = 92) | SCRC (n = 30) | |
| Age (yr) | 63.5 (33–82) | 66.0 (43–88) | 63.0 (33–82) | 66.0 (48–79) | 63.5 (33–82) | 66.0 (43–88) |
| p-value | .087 | .150 | .168 | |||
| Sex | ||||||
| Male | 59 (64.1) | 37 (80.4) | 56 (65.9) | 25 (73.5) | 59 (64.1) | 24 (80.0) |
| Female | 33 (35.9) | 9 (19.6) | 29 (34.1) | 9 (26.5) | 33 (35.9) | 6 (20.0) |
| p-value | .050 | .419 | .106 | |||
| T category | ||||||
| T2 | 12 (13.0) | 18 (18.2) | 12 (14.1) | 13 (17.8) | 12 (13.0) | 13 (20.3) |
| T3 | 73 (79.3) | 72 (72.7) | 68 (80.0) | 52 (71.2) | 73 (79.3) | 42 (65.6) |
| T4 | 7 (7.6) | 9 (9.1) | 5 (5.9) | 8 (11.0) | 7 (7.6) | 9 (14.1) |
| p-value | .548 | .374 | .154 | |||
| N category | ||||||
| N0 | 49 (53.3) | 12 (26.1) | 49 (57.6) | 12 (35.3) | 49 (53.3) | 8 (26.7) |
| N1, N2 | 43 (46.7) | 34 (73.9) | 36 (42.4) | 22 (64.7) | 43 (46.7) | 22 (73.3) |
| p-value | .003 | .028 | .011 | |||
| M category | ||||||
| M0 | 73 (79.3) | 23 (50.0) | 73 (85.9) | 23 (67.6) | 73 (79.3) | 14 (46.7) |
| Synchronous M1 | 7 (7.6) | 12 (26.1) | - | - | 7 (7.6) | 8 (26.7) |
| Metachronous M1 | 12 (13.0) | 11 (23.9) | 12 (14.1) | 11 (32.4) | 12 (13.0) | 8 (26.7) |
| p-value | .001 | .023 | .002 | |||
| Lymphatic invasion | ||||||
| Absent | 73 (79.3) | 67 (67.7) | 69 (81.2) | 53 (72.6) | 73 (79.3) | 37 (57.8) |
| Present | 19 (20.7) | 32 (32.3) | 16 (18.8) | 20 (27.4) | 19 (20.7) | 27 (42.2) |
| p-value | .068 | .200 | .004 | |||
| Venous invasion | ||||||
| Absent | 86 (93.5) | 85 (85.9) | 81 (95.3) | 65 (89.0) | 86 (93.5) | 55 (85.9) |
| Present | 6 (6.5) | 14 (14.1) | 4 (4.7) | 8 (11.0) | 6 (6.5) | 9 (14.1) |
| p-value | .086 | .139 | .116 | |||
| Variable | Univariate |
Multivariate |
||
|---|---|---|---|---|
| HR | p-value | HR | p-value | |
| Age (≥ 65 yr/< 65 yr) | 4.088 (1.728–9.673) | .001 | 4.041 (1.703–9.587) | .002 |
| Sex (male/female) | 1.051 (0.472–2.347) | .902 | - | - |
| Multiplicity (synchronous/solitary) | 5.075 (2.350–10.960) | < .001 | 4.618 (2.126–10.030) | < .001 |
| T category (T3, 4/T2) | 3.487 (0.473–25.709) | .220 | - | - |
| N category (N1, 2/N0) | 3.617 (1.528–8.564) | .003 | 3.072 (1.291–7.309) | .011 |
| Vascular invasion (present/absent) | 2.373 (0.897–6.273) | .082 | - | .159 |
| Lymphatic invasion (present/absent) | 2.836 (1.326–6.065) | .007 | - | .122 |
| Perineural invasion (present/absent) | 1.617 (0.612–4.270) | .333 | - | - |
| Tumor location (including right colon/left colon only) | 0.907 (0.397–2.072) | .817 | - | - |
| Chemotherapy (treated/not-treated) | 1.088 (0.376–3.147) | .876 | - | - |
| Surgery (extensive/simple) | 1.837 (0.635–5.314) | .262 | - | - |
| MSI (MSI-H/MSS, MSI-L) | 0.045 (0.000–33.308) | .357 | - | - |
| KRAS (mutant/wild type) | 2.337 (1.049–5.204) | .038 | - | - |
| Variable | Univariate |
Multivariate |
||
|---|---|---|---|---|
| HR | p-value | HR | p-value | |
| Age (≥ 65 yr/< 65 yr) | 1.803 (0.791–4.114) | .161 | 2.163 (0.905–5.171) | .083 |
| Sex (male/female) | 1.672 (0.733–3.815) | .222 | - | - |
| Multiplicity (synchronous/solitary) | 2.939 (1.294–6.674) | .010 | - | .151 |
| T category (T3, 4/T2) | 2.993 (0.403–22.224) | .284 | - | - |
| N category (N1, 2/N0) | 4.378 (1.623–11.805) | .004 | 3.943 (1.457–10.670) | .007 |
| Vascular invasion (present/absent) | 3.658 (1.440–9.294) | .006 | 4.114 (1.527–11.081) | .005 |
| Lymphatic invasion (present/absent) | 3.096 (1.365–7.025) | .007 | - | .225 |
| Perineural invasion (present/absent) | 2.417 (0.952–6.136) | .063 | - | - |
| Tumor location (including right colon/left colon only) | 1.370 (0.509–3.690) | .534 | - | - |
| Chemotherapy (treated/not-treated) | 0.555 (0.130–2.369) | .427 | - | - |
| Surgery (extensive/simple) | 1.535 (0.456–5.169) | .489 | - | - |
| MSI (MSI-H/MSS, MSI-L) | 0.045 (0.000–63.182) | .401 | - | - |
| KRAS (mutant/wild type) | 1.776 (0.768–4.105) | .179 | - | - |
CRC, colorectal carcinoma; MSI, microsatellite instability; MSS, microsatellite-stable; CIMP, CpG island methylator phenotype. Fisher exact test.
Values are presented as median (range) or number (%).
HR, hazard ratio; MSI, microsatellite instability; MSI-H, MSI-high; MSS, microsatellite-stable; MSI-L, MSI-low.
HR, hazard ratio; MSI, microsatellite instability; MSI-H, MSI-high; MSS, microsatellite-stable; MSI-L, MSI-low.

 E-submission


