 E-submission
Articles
- Page Path
- HOME > J Pathol Transl Med > Volume 55(6); 2021 > Article
-
Original Article
Immunohistochemical expression of programmed death-ligand 1 and CD8 in glioblastomas -
Dina Mohamed El Samman1
 , Manal Mohamed El Mahdy1, Hala Sobhy Cousha1, Zeinab Abd El Rahman Kamar1, Khaled Abdel Karim Mohamed2, Hoda Hassan Abou Gabal1
 -
Journal of Pathology and Translational Medicine 2021;55(6):388-397.
DOI: https://doi.org/10.4132/jptm.2021.08.04
Published online: October 14, 2021
1Department of Pathology, Ain Shams University, Cairo, Egypt
2Department of Clinical Oncology, Ain Shams University, Cairo, Egypt
- Corresponding Author: Dina Mohamed El Samman, MSc, Department of Pathology, Faculty of Medicine, Ain Shams University, Abbassyia Square, Ramsis Street, Cairo 11566, Egypt Tel: +20-1123342337, +20-1147509744, Fax: +20-224346753, +20-224346041, E-mail: dina_elsamman@med.asu.edu.eg, dina.elsamman@yahoo.com
© 2021 The Korean Society of Pathologists/The Korean Society for Cytopathology
This is an Open Access article distributed under the terms of the Creative Commons Attribution Non-Commercial License (https://creativecommons.org/licenses/by-nc/4.0) which permits unrestricted non-commercial use, distribution, and reproduction in any medium, provided the original work is properly cited.
Abstract
-
Background
- Glioblastoma is the most aggressive primary malignant brain tumor in adults and is characterized by poor prognosis. Immune evasion occurs via programmed death-ligand 1 (PD-L1)/programmed death receptor 1 (PD-1) interaction. Some malignant tumors have responded to PD-L1/PD-1 blockade treatment strategies, and PD-L1 has been described as a potential predictive biomarker. This study discussed the expression of PD-L1 and CD8 in glioblastomas.
-
Methods
- Thirty cases of glioblastoma were stained immunohistochemically for PD-L1 and CD8, where PD-L1 expression in glioblastoma tumor tissue above 1% is considered positive and CD-8 is expressed in tumor infiltrating lymphocytes. The expression of each marker was correlated with clinicopathologic parameters. Survival analysis was conducted to correlate progression-free survival (PFS) and overall survival (OS) with PD-L1 and CD8 expression.
-
Results
- Diffuse/fibrillary PD-L1 was expressed in all cases (mean expression, 57.6%), whereas membranous PD-L1 was expressed in six of 30 cases. CD8-positive tumor-infiltrating lymphocytes (CD8+ TILs) had a median expression of 10%. PD-L1 and CD8 were positively correlated (p = .001). High PD-L1 expression was associated with worse PFS and OS (p = .026 and p = .001, respectively). Correlation of CD8+ TILs percentage with age, sex, tumor site, laterality, and outcomes were statistically insignificant. Multivariate analysis revealed that PD-L1 was the only independent factor that affected prognosis.
-
Conclusions
- PD-L1 expression in patients with glioblastoma is robust; higher PD-L1 expression is associated with lower CD8+ TIL expression and worse prognosis.
- This is a retrospective cohort study that included formalin-fixed paraffin-embedded (FFPE) tissue blocks from 30 patients with glioblastoma. Medical records were collected from the archives of the Clinical Oncology Department and the Pathology Laboratory of Ain Shams University Hospital from January 2017 to January 2020.
- The following inclusion criteria were used to select tumor tissue blocks for final analysis: (1) histopathological diagnosis of glioblastoma, (2) available paraffin-embedded tissue diagnostic biopsy data, and (3) available clinical follow-up data after initial diagnosis. Clinicopathologic variables of age, gender, tumor location, and tumor laterality were recorded. Survival indicators (OS and progression-free survival [PFS]) were identified using the follow-up data.
- The paraffin-embedded tissue blocks of 30 pretreatment glioblastoma cases were cut into sections with a thickness of 4 μm and subjected to the following.
- (1) Routine hematoxylin and eosin (H&E) staining: The H&E-stained slides of the tissue biopsies were prepared to confirm glioblastoma diagnosis based on the 2016 CNS WHO classification.
- (2) Assessment of isocitrate dehydrogenase 1 (IDH1) mutation: IDH1 mutation was evaluated by immunohistochemistry [5]. Anti IDH-1 (R-132 H) mouse monoclonal antibody (clone H09) from Dianova was used to identify IDH1 wild- and mutant-types in FFPE sections using a BenchMark Ventana (GX) automated immunostainer (Roche, Rotkreuz, Switzerland). Twenty-seven cases (90%) were negative for IDH1 mutation (IDH-1 wild), and three (10%) cases were positive (IDH1 mutant).
- (3) Immunohistochemical staining for PD-L1 and CD8: Regarding immunohistochemical staining, 4-μm paraffin-embedded tissue sections were prepared and stained using the Bench-Mark Ventana (GX) automated immunostainer. We first loaded the slides, antibodies, and ultra-view detection kit dispensers into the BenchMark instrument, we selected the standard pretreatment protocol CC1 in the automatic immunostainer device, and set the antibody incubation for 32 minutes at 37°C. When staining was complete, the slides were removed from the instrument, rinsed well with soap and water 10 times, and then washed with a buffer (reaction buffer concentrate [× 10] from Ventana [Ref 950-300, LOT G 24035]). The following primary antibodies were used: (1) PD-L1 NBP2-15791 rabbit/human polyclonal antibody from Novus Biological (Littleton, CO, USA) diluted to 1:200 and (2) CD8 C8/144B mouse monoclonal antibody from Cell Marque (Ref. 108-98, key code CMC 10829030, Darmstadt, Germany) diluted to 1:100.
- Non-neoplastic lymph node tissue sections were used as positive controls for PD-L1, and non-neoplastic spleen sections were used as positive controls for CD8. Control slides were obtained from the histopathology paraffin embedded tissue blocks archived in the Pathology Lab, Faculty of Medicine, Ain Shams University Hospitals, and the study was conducted. Slides were prepared and used as control slides. Both positive and negative control slides were included in each run. Neagtive control slides used are gliobalstoma tissue sections, primary antibodies were not applied on them, instead the buffer is used on it. Three runs were done, in each run a negative control slide was used. All specimens were reviewed independently using light microscopy in at least five areas (400 × magnification) by investigators who were blinded to immunohistology and clinical data.
- PD-L1 expression was recorded according to cellular localization and distribution of the immunohistochemical signal, whether diffuse/fibrillary or membranous, with a positivity cutoff value > 1%, according to Berghoff et al. [8]. Any PD-L1 expression in the slide > 1% is considered positive whereas any expression of PD-L1 on the slide ≤ 1% is considered negative. The extent of diffuse/fibrillary PD-L1 expression throughout the tumor tissue was scored semiquantitatively according to percentage of cells expressing PD-L1 in the non-necrotic tumor area: (1) no PD-L1–positive tumor areas, (2) ≤ 25%, (3) 26%–50%, (4) 51%–75%, and (5) > 75%. The patients were categorized further into high (PDL1 > 50%) and low (PD-L1 ≤ 50%) PD-L1 expression groups using the median value as a cutoff point (50%) [8].
- CD8+ TIL expression was evaluated quantitatively by examining each section using at least five high-power fields (× 40 objective and × 10 eyepiece) and the most abundant TILs to calculate the percentage of expression [17]: (1) Each slide was examined to detect the 5 hpfs (× 40) with the most abundant TIls, (2) In those 5 hpfs with most abundant TIls, TILs were calculated as a percentage against the tumor tissue background using the automated image analyzer mentioned in the methods, and (3) The median percentage out of those 5 hpfs was referred to as the percentage of CD8+ TILs for this case. Counting was conducted using the Leica Q Win V.3 program (Wetzlar, Germany), an image analyzer, installed on a computer in the Histology Department, Faculty of Medicine, Ain Shams University (CPU: Ryzen 4600H, Graphics: AMD Radeon Pro 5300 XT, RAM: 32 GB 2666MHz DDR4, Screen: 27-inch [diagonal] 5120 × 2880 Retina 5K display, Storage: 4TB SSD). The computer was connected to a Leica DM2500 microscope. Furthermore, the densities were scored at 200 ×–400 × magnification in predefined regions of interest within the glioblastoma (intra-tumoral) and the perivascular region. The percentage of TILs in each case was recorded from the median field. The patients were categorized further into high (CD8+ TILs > 10%) and low (CD8+ TILs ≤ 10%) CD8 infiltration groups using the median value as a cutoff point (10%) [17]. Semiquantitative evaluation criteria were used to describe TIL infiltration density as either sparse, moderate, or dense [18].
- Statistical analysis
- The collected data were revised, coded, tabulated, and input into a PC using the SPSS ver. 20 for Windows (IBM Corp., Armonk, NY, USA). Suitable analyses were conducted according to the type of data obtained for each parameter. Parametric numerical data were expressed as mean ± standard deviation (SD) and range, whereas nonparametric numerical data were expressed as median and interquartile range (IQR). Nonnumerical data were expressed as frequency and percentage. Mann-Whitney U test was used to assess the statistical significance of differences in nonparametric variables between the two study groups. Fisher’s exact test was used to examine the relationship between two qualitative variables when the expected count was less than 5 in more than 20% of cells. Correlation analysis using Pearson’s method was used to assess the strength of the association between two quantitative variables. The correlation coefficient (r) defines the strength (magnitude) and direction (positive or negative) of the linear relationship between two variables. Spearman’s method was used as a nonparametric measure of rank correlation where the correlation coefficient (rs) defined the strength (magnitude) and direction (positive or negative) of the relationship between two variables. Very weak, weak, moderate, strong, and very strong correlations were defined as r or rs values of 0–0.19, 0.2–0.39, 0.40–0.59, 0.6–0.79, and 0.8–1, respectively. The endpoints of this study were disease-free survival and OS. PFS was calculated as the time between initial biopsy and disease progression or last follow-up. OS was calculated as the time between initial biopsy and death or last follow-up. Patients who were deceased at the time of data cutoff were censored at the last date the patient was known to be alive. Survival distributions were estimated using the Kaplan-Meier method. Correlations of OS and PFS to clinical parameters, PD-L1 and CD-8 expression were done using log-rank test and Kaplan-Meier curves. The Cox regression was used for modeling the time to a specified event, considering the values of other given variables. Univariate and multivariable analyses were conducted using Cox’s proportional hazards model. Statistical significance was set at p < .05, and p = .01 was defined as highly significant.
MATERIALS AND METHODS
- Clinical characteristics of patients
- We studied 30 patients with histopathologically diagnosed grade IV glioblastoma according to the 2016 WHO criteria. Their ages ranged from 29 to 75 years (mean, 50.9); 22 were male (73.3%), and eight (26.7%) were female. Regarding tumor location and laterality as determined via magnetic resonance imaging (MRI), 13/30 cases (44.8%) were located in the right hemisphere, 15/30 (51.7%) in the left hemisphere, and 1/30 (3.4%) crossed the midline, appearing bilateral. On MRI, the sites of glioblastoma included all lobes (frontal, parietal, occipital, and temporal), most frequently in the frontal and parietal lobes (20% and 16.7%, respectively). Thalamic and parasagittal sites were seen. Some cases were bridging into more than one lobe, including the frontoparietal, parieto-occipital, temporofrontal, temporo-occipital, and temporoparietal lobes.
- PD-L1 expression
- All 30 cases (100%) demonstrated positive PD-L1 staining in tumor cells in a diffuse/fibrillary pattern, with a mean value of 57.6% and a median of 50%. Among the PD-L1–positive cases, five (16.7%) had ≤ 25% positive staining of the tumor cells, 10 (33.3%) had 26%–50% positive staining, five (16.7%) had 51%–75% positive staining, and the remaining 10 (33.3%) had > 75% positive staining. The median was used to categorize further the cases into high (PD-L1 > 50%) and low (PD-L1 ≤ 50%) PD-L1 expression groups. Lastly, six cases showed positive membranous expression alongside the diffuse/fibrillary expression, as illustrated in Fig. 1.
- CD8 expression
- The percentage of CD8+ TILs ranged from 1% to 40% (mean, 14.33% ± 12.5%; median [IQR], 10% [5%–10%]). The low infiltration group (CD8+ TIL ≤ 10%) represented 56.66% of all cases (n = 17), whereas the high infiltration group (CD8+ TIL > 10%) represented 43.33% of all cases (n = 13), as illustrated in Fig. 1. The CD8+ TILs were classified semiquantitatively as either sparsely (12 cases, 40%), moderately (11 cases, 36.7%), or densely (7 cases, 23.33%) stained. Regarding the distribution of CD8+ TILs, the majority of cases (20 cases, 66.7%) was perivascular, eight cases (26.7%) were intra-tumoral, and the remaining two cases (23.3%) were both perivascular and intra-tumoral.
- Correlations between PD-L1, CD8 expression, and clinical characteristics
- No statistical significance was detected regarding the effect of age, sex, or laterality on PD-L1 (p = .273, p = .682, and p = .464, respectively) (Table 1) or CD8 (p = .713, p > .99, and p = .122, respectively) (Table 2) expression. PD-L1 expression was significantly associated with the proportion of CD8+ TILs (p = .001), with a moderate inverse correlation according to Spearman’s method (rs = –0.573).
- Survival analyses
- From the date of diagnosis to January 2020, 26 of 30 (86.7%) patients did not survive; only 4 (13.3%) patients were alive by the end of the study. The PFS had a mean of 10 months and a median of 7 months (95% confidence interval [CI], 7.5 to 12.5; SD, ± 7.03), whereas the mean OS of patients with glioblastoma was 18 months, and the median OS was 13 months (95% CI, 14 to 21).
- Correlations between clinical characteristics and survival
- Patients younger than 53 years (the median age in our study) had a mean PFS of 9.21 months (95% CI, 5.89 to 12.51) and a mean OS of 18.47 months (95% CI, 13.50 to 23.40), whereas patients 53 years and older had a mean PFS of 10.80 months (95% CI, 6.94 to 14.66) and a mean OS of 16.87 months (95% CI, 11.56 to 22.17).
- Males had a mean PFS of 11.90 months (95% CI, 8.89 to 14.90) and a mean OS of 18.97 months (95% CI, 14.80 to 23.12), whereas females had a mean PFS of 4.75 months (95% CI, 3.15 to 6.35) and a mean OS of 13.6 months (95% CI, 7.34 to 19.90).
- Patients with tumors arising in the left cerebral hemisphere had a mean PFS of 10.69 months (95% CI, 6.49 to 14.89) and a mean OS of 19 months (95% CI, 13.60 to 24.50), whereas those with tumors arising in the right cerebral hemisphere had a mean PFS of 9.87 months (95% CI, 6.33 to 13.40) and a mean OS of 17.50 months (95% CI, 12.50 to 22.60).
- Sex was significantly correlated with PFS (p = .004), with worse prognosis in female patients. PFS was not correlated with age (p = .430) or laterality (p = .760). OS had no correlation with age (p = .690), sex (p = .317), or laterality (p = .647).
- PD-L1 expression and survival
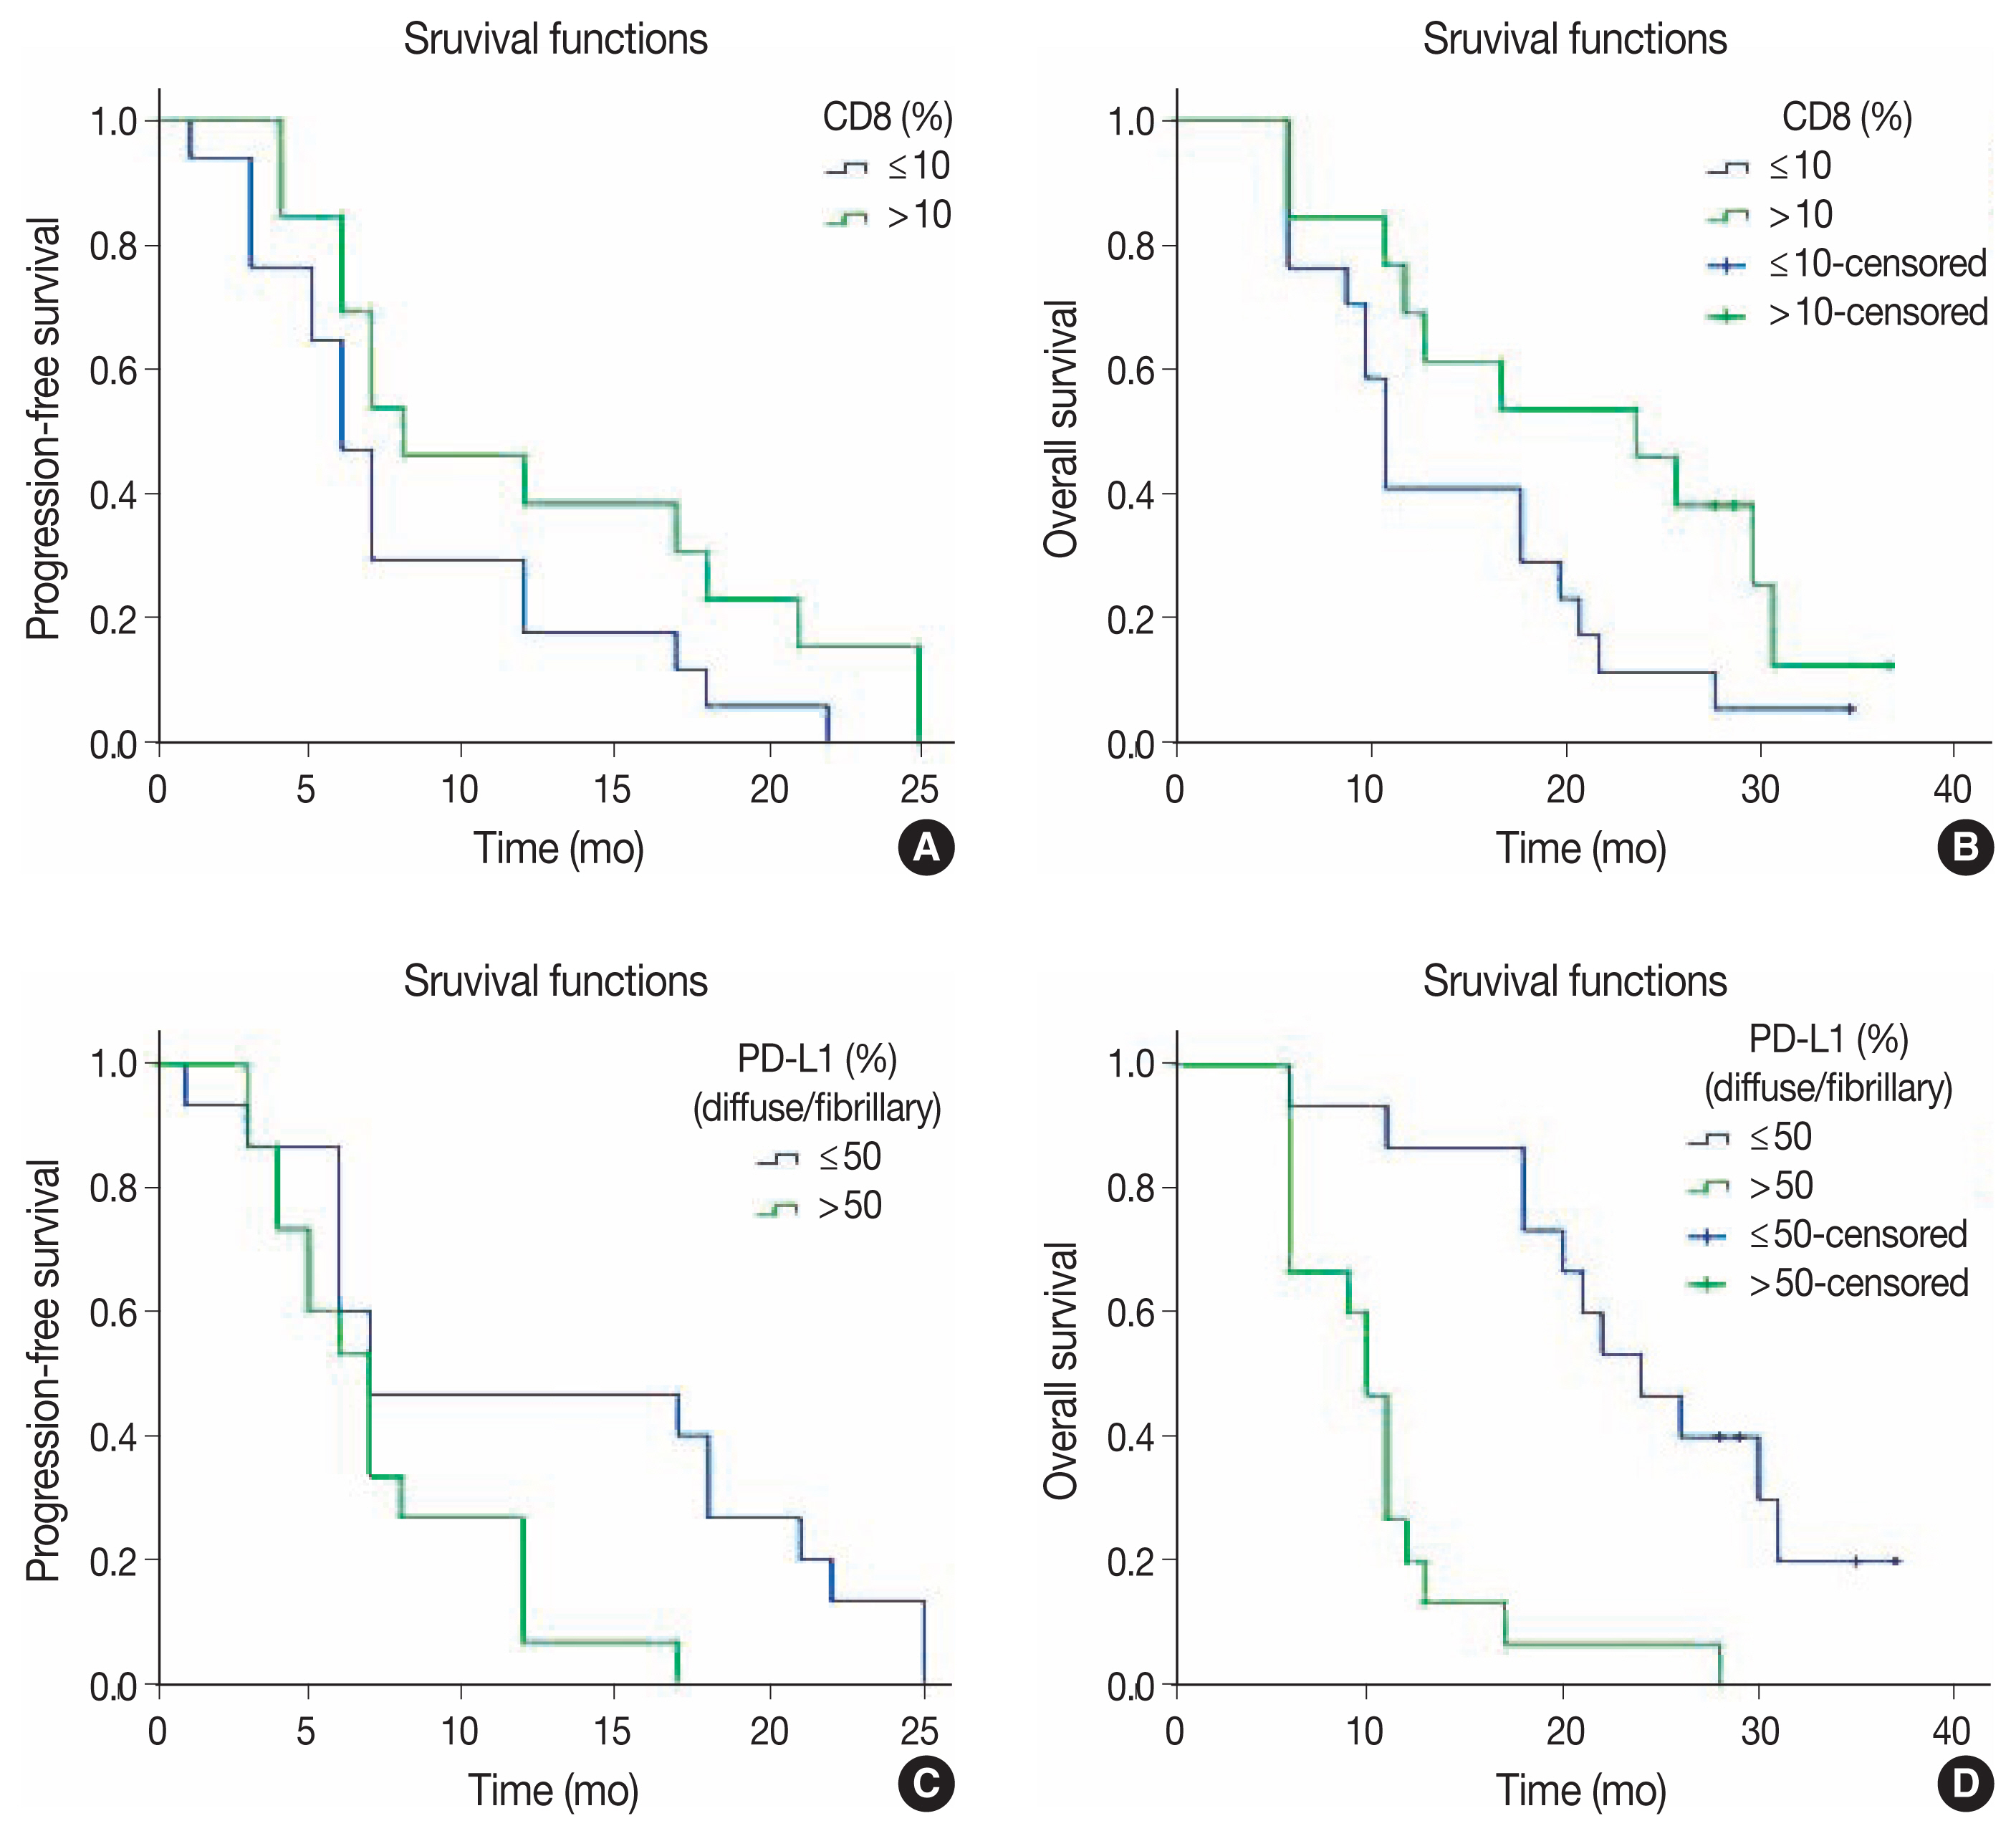
- Individuals with high tumor PD-L1 expression (PD-L1 > 50%) had shorter mean PFS (7.47 months; 95% CI, 5.40 to 9.50) and OS (10.8 months, 95% CI, 7.90 to 13.70), indicating worse prognosis. Those with low PD-L1 expression (PD-L1 ≤ 50%), on the other hand, had longer mean PFS (12.50 months; 95% CI, 8.24 to 16.80) and OS (24.60 months; 95% CI, 19.90 to 29.20). Thus, PD-L1 expression had a significant correlation with PFS and OS (p = .026 and p=.001, respectively), denoting worse prognosis in the high expression group, as demonstrated in Fig. 2.
- CD8 immunohistochemical expression and survival
- The low infiltration group (CD8+ TIL ≤ 10%) had shorter mean PFS (8.24 months; 95% CI, 5.40 to 11) and OS (14.59 months; 95% CI, 10.67 to 18.50) compared to the high infiltration group (CD8+ TIL > 10%), which had longer mean PFS (12 months; 95% CI, 8 to 16.59) and OS (21 months; 95% CI, 15.57 to 27). However, the proportion of CD8+ TILs was not significantly correlated with either PFS or OS (p = .093 and p = .066, respectively), as demonstrated in Table 3 and Fig. 2.
- Multivariate analysis of clinical characteristics and PD-L1 and CD8 expression
- Multivariate analyses were performed using Cox regression to determine the variables that were independently predictive of PFS and OS. PD-L1 expression was the only factor with independent prognostic significance (hazard ratio, 6.30; p = .001) for OS only; age, sex, and CD8+ TIL proportion were not statistically significant in terms of PFS and OS. This indicates that positive PD-L1 expression greater than 50% increased the risk of fatality by 6.3 times, as demonstrated in Table 4.
RESULTS
- Glioblastoma is the most common and aggressive primary malignant brain tumor in adults [19]. PD-L1 is expressed robustly in most glioblastoma cases, and clinical trials using PD-1/PD-L1-targeted immunotherapy have shown improved median OS in patients with glioblastoma [20]. Tumor immunology and immunotherapy are emerging trends in cancer therapy. Thus, studies on PD-L1 are relevant considering its role in glioblastoma, its effect on survival analysis, and its potential role in disease management. Moreover, analysis of immunological parameters, such as TILs, and their correlation with PD-L1 expression (representing the microenvironmental immune response to PD-L1 expression) is crucial for development of successful immunotherapies [21].
- We studied the expression of PD-L1 and CD8 within the context of survival analysis in glioblastoma cases. In our study, PD-L1 expression was detected in all glioblastoma cases, ranging from 20% to 90%. This was in accordance with Wintterle et al. [22], Wilmotte et al. [23], Berghoff et al. [8], and Nduom et al. [3], who also reported high PD-L1 expression in glioblastoma cases (100%, 85.2%, 88%, and 95%, respectively). On the other hand, Yao et al. [24], Avril et al. [25], Liu et al. [4], and Zeng et al. [26] reported weaker PD-L1 expression in glioblastoma (75%, 76.5%, 45%, and 50% respectively). Xue et al. [2] emphasized that the positive rate of PD-L1 expression varied by study and ranged from 6.1% to 100%. Pooled analysis demonstrated an overall positive percentage of PD-L1 protein expression (44.72%) [2].
- In our study, positive PD-L1 membranous staining was apparent in 36.7% of all cases (n = 11). This was in agreement with Berghoff et al. [8] and Nduom et al. [3]; the former found strong membranous PD-L1 immunostaining in 44 of 117 cases (37.6%), whereas the latter reported a higher percentage of PD-L1 membranous expression (60.6%), which might be attributed to their larger sample size (n = 345). On the contrary, Garber et al. (2017) [27] reported a higher percentage of PD-L1 membranous expression (60.6%). Although the results of our study and some of the aforementioned studies seem numerically different, they are not necessarily conflicting as they all demonstrate that glioblastomas have high PD-L1 expression.
- The differences in results could be explained by the techniques used. For example, tissue microarray uses smaller tumor tissue samples (1 mm), which are more prone to sampling bias and false-negative cases than are studies using full slides, wherein non-sampled tumor parts in tissue microarray are interpreted as false negatives regarding PD-L1 expression. Generally, the difference in PD-L1 expression across studies can be attributed to variability in the methodology of PD-L1 assessment, utilized antibodies, immunohistochemical staining protocols, sample size, methods of preparing the tumor tissues, and diagnostic standards (e.g., expression patterns and positivity cutoffs). Therefore, further research to establish uniform standards is necessary.
- All glioblastoma cases investigated herein showed CD8+ TIL expression (mean, 14.3%; median, 10%; range, 1%–40%), and we used the median as a cutoff value to categorize the cases into low and high infiltration groups, similar to Han et al. [17], who reported a median of 3.4% and used it for categorization. Both studies used the same quantitative evaluation protocol, examining each section using at least five high-power fields with the most abundant TILs to record the median expression and, thus, categorize cases into two groups. However, in our study, we used an automated image analyzer that recorded the percentage of TILs, whereas Han et al. [17] manually counted the number of TILs. Our sample size was smaller (30 cases) than that of Han et al. [17] (90 cases).
- The low infiltration group represented 56.66% of all cases, while the high infiltration group represented 43.3% of all cases. TILs were detected in all cases, and the majority was of sparse density and perivascular in distribution. This finding is in line with the findings of Yang et al. [28], Rutledge et al. [29], Han et al. [17], and Berghoff et al. [8]. This observation regarding the distribution of TILs in glioblastoma suggests that TILs do not migrate easily into the immunosuppressive tumor microenvironment but instead arrest mainly in the perivascular space. The lower total number of TILs in our study and in the study of Han et al. [17] compared to that of other tumors, such as ovarian cancer [21] and breast cancer [30], could be related to the blood–brain barrier or the specific local microenvironment.
- The expression of PD-L1 and CD8+ TIL showed a significant, moderate, inverse correlation (rs = –0.573, p = .001). This can be interpreted according to the findings of Avril et al. [25], who explained that PD-L1 produced by glioma cell lines affects the activation and recruitment of T-cells and decreases the production of lymphocytic interferon-γ and interleukins 2 and 10. According to Wintterle et al. [22], the expression of PD-L1 in malignant tumors inhibits CD4+ and CD8+ T-cells via PD-1.
- In our study, age, sex, and laterality were not correlated with either PD-L1 or the proportion of CD8+ TILs. This observation was in line with the findings of Berghoff et al. [8].
- The median OS in our study was 13 months, which is in line with the findings of Zeng et al. [26] and Xue et al. [2], who reported an OS of 12 and 14.6 months, respectively. The median PFS in our study was 7 months (95% CI, 7.5 to 12.5), whereas Ballmann et al. [31] reported a median PFS of 5.3 months (95% CI, 5.0 to 5.6).
- Cox regression analysis found no significant difference in OS in terms of age, sex, or laterality and no difference in PFS in terms of age or laterality. This is in concordance with Han et al. [17] but not with Berghoff et al. [8], who reported older age to be a negative prognostic indicator. On the other hand, we found female patients to have a significantly shorter PFS, but Han et al. [17] reported that sex was not correlated with either OS or PFS
- In our study, patients with high PD-L1 expression (> 50%) had shorter OS than those with low expression. This is in concordance with Liu et al. [4] and Nduom et al. [3].
- Multivariate analysis revealed that PD-L1 is an independent factor in relation to OS, which agrees with the results of Berghoff et al. [8] and Nduom et al. [3]. However, this contrasted with the findings of Preusser et al. [32], Zeng et al. [26], and Xue et al. [2]. The conflict in results with Zeng et al. [26] can be explained by their inclusion of glioma cases of all grades. This conflict needs to be studied further to confirm and determine the prognostic value of PD-L1 expression in glioblastoma prognosis. It should also be noted that PD-L1 was significantly correlated with PFS. However, the current literature lacks an explanation for this, and further studies are warranted.
- The effect of PD-L1 expression on survival can be explained by the need got PD-1 and its ligand, PD-L1, for immunosuppression of T-cells, tumor cells, and antigen-presenting cells (APCs). Their interaction leads to inhibition of early T-cell activation, abolishing their cytotoxic activity and hindering the production of inflammatory cytokines [33–35].
- Although the high CD8+ TIL infiltration group had longer OS and PFS than the low infiltration group, this was not statistically significant in our study. This is in accordance with Kim et al. [36] and Han et al. [17], who reported that CD8+ TILs alone could not predict effectively patient outcome in glioblastoma. They also concluded that CD8+ TILs might not be effective prognostic markers in gliomas because high-grade gliomas have multiple mechanisms of mediating immunosuppression, such as anergy stimulation by tumor APCs, antigen loss, cytokine immunosuppression, and T-cell apoptosis [37]. However, according to Han et al. (2014), the combination of high CD4+ TILs and low CD8+ TILs was significantly associated with shorter PFS and OS [17]. These results suggest that effective antitumor immunity requires an appropriate ratio of CD8/CD4+ TIL in gliomas. On the other hand, CD8+ TILs have a known favorable effect on the survival of patients with breast cancer [30], ovarian cancer [21], or colorectal cancer [33,38,39].
- Glioblastoma is an aggressive brain tumor with a poor prognosis. PD-L1 is expressed extensively in glioblastomas and can be considered a negative prognostic indicator and a predictive biomarker for the selection of patients for immunotherapy. Cases with high PD-L1+ expression (>50%) have a worse prognosis. The proportion of CD8+ TILs is lower in cases of high PD-L1 expression, indicating possible immune evasion of glioblastomas exerted by PD-L1. More research is needed in this field to provide more opportunities for patients with glioblastoma to benefit from immunotherapy using PD-L1 blockers.
DISCUSSION
Ethics Statement
All procedures performed in the current study were approved by the National Research Ethics Committee (FMASU MD 428/2017) in accordance with the 1964 Declaration of Helsinki and its later amendments. Informed consent was obtained from all participants included in this study.
Availability of Data and Material
All data generated or analyzed during the study are included in this published article (and its supplementary information files).
Code Availability
Not applicable.
Author Contributions
CConceptualization: DMES, MMEM, HSC, KAKM, HHAG. Formal analysis: DMES, MMEM, HHAG. Investigation: DME, MME, HHAG. Methodology: DMES, MMEM, HSC, KAKM, HHAG. Supervision: HSC, MMEM, KAKM, HHAG. Writing—original draft preparation: DMES, HHAG. Writing—review & editing: DMES, MMEM, HSC, KAKM, HHAG. Approval of final manuscript: all authors.
Conflicts of Interest
The authors declare that they have no potential conflicts of interest.
Funding Statement
No funding to declare.

| PD-L1, n (%) | Test of significance | ||||
|---|---|---|---|---|---|
|
|
|
||||
| Low expression group ≤ 50%a | High expression group > 50%a | χ2 | p-value | Significance | |
| Age (yr) | 1.2 | .273 | NS | ||
| < 53 | 9 (60.0) | 6 (40.0) | |||
| ≥ 53 | 6 (40.0) | 9 (60.0) | |||
| Sex | Fisher exact test | .682 | NS | ||
| Male | 12 (54.5) | 10 (45.5) | |||
| Female | 3 (37.5) | 5 (62.5) | |||
| Laterality | 0.54 | .464 | NS | ||
| Left | 6 (46.2) | 7 (53.8) | |||
| Right | 9 (60.0) | 6 (40.0) | |||
| CD8 | Test of significance | ||||
|---|---|---|---|---|---|
|
|
|
||||
| Low infiltration group ≤ 10%a | High infiltration group > 10%a | χ2 | p-value | Significance | |
| Age (yr) | 0.14 | .713 | NS | ||
| < 53 | 9 (60.0) | 6 (40.0) | |||
| ≥ 53 | 8 (53.3) | 7 (46.7) | |||
| Sex | Fisher exact test | > .99 | NS | ||
| Male | 12 (54.5) | 10 (45.5) | |||
| Female | 5 (62.5) | 3 (37.5) | |||
| Laterality | 2.39 | .122 | NS | ||
| Left | 9 (69.2) | 4 (30.8) | |||
| Right | 6 (40.0) | 9 (60.0) | |||
| PFS (mo) | OS (mo) | |||||
|---|---|---|---|---|---|---|
|
|
|
|||||
| Mean ± SE | 95% CI | p-value | Mean±SE | 95% CI | p-value | |
| Age (yr) | .432 | .690 | ||||
| < 53 | 9.20 ± 1.69 | 5.89–12.51 | 18.47 ± 2.51 | 13.54–23.39 | ||
| ≥ 53 | 10.80 ± 1.97 | 6.94–14.66 | 16.87 ± 2.71 | 11.56–22.17 | ||
| Sex | .004 | .317 | ||||
| Male | 11.90 ± 1.54 | 8.89–14.92 | 18.97 ± 2.12 | 14.82–23.12 | ||
| Female | 4.70 ± 0.82 | 3.15–6.35 | 13.63 ± 3.21 | 7.34–19.91 | ||
| Laterality | .760 | .647 | ||||
| Left | 10.69 ± 2.14 | 6.49–14.89 | 19.08 ± 2.78 | 13.63–24.52 | ||
| Right | 9.87 ± 1.80 | 6.33–13.40 | 17.57 ± 2.58 | 12.51–22.62 | ||
| PD-L1 | .026 | < .001 | ||||
| ≤ 50%a | 12.53 ± 2.19 | 8.24–16.83 | 24.57 ± 2.37 | 19.93–29.20 | ||
| > 50%a | 7.47 ± 1.05 | 5.41–9.53 | 10.80 ± 1.48 | 7.90–13.70 | ||
| CD8+ TILs | .093 | .066 | ||||
| ≤ 10%b | 8.24 ± 1.44 | 5.41–11.06 | 14.59 ± 2 | 10.67–18.50 | ||
| > 10%b | 12.30 ± 2.18 | 8.03–16.59 | 21.41 ± 2.98 | 15.57–27.26 | ||
PD-L1, programmed death-ligand 1; TILs, tumor-infiltrating lymphocytes; PFS, progression-free survival; OS, overall survival; SE, standard error; CI, confidence interval.
a50% is the cutoff point used to categorize PD-L1 expression into low and high expression groups;
b10% is the cutoff point used to categorize CD8 expression into low and high infiltration groups.
| Progression-free survival | Overall survival | |||||
|---|---|---|---|---|---|---|
|
|
|
|||||
| HR | 95% CI | p-value | HR | 95% CI | p-value | |
| Age ≥ 53 yr | 0.60 | 0.26–1.41 | .241 | 0.63 | 0.25–1.6 | .334 |
| Female sex | 2.56 | 0.93–7.07 | .069 | 1.25 | 0.47–3.28 | .653 |
| PD-L1 > 50%a | 1.82 | 0.68–4.83 | .232 | 6.30 | 2.22–17.91 | .001b |
| CD8 > 10%c | 0.63 | 0.27–1.49 | .295 | 0.53 | 0.2–1.4 | .203 |
- 1. Szopa W, Burley TA, Kramer-Marek G, Kaspera W. Diagnostic and therapeutic biomarkers in glioblastoma: current status and future perspectives. Biomed Res Int 2017; 2017: 8013575. ArticlePDF
- 2. Xue S, Hu M, Li P, et al. Relationship between expression of PD-L1 and tumor angiogenesis, proliferation, and invasion in glioma. Oncotarget 2017; 8: 49702-12. ArticlePubMedPMC
- 3. Nduom EK, Wei J, Yaghi NK, et al. PD-L1 expression and prognostic impact in glioblastoma. Neuro Oncol 2016; 18: 195-205. ArticlePubMed
- 4. Liu Y, Carlsson R, Ambjorn M, et al. PD-L1 expression by neurons nearby tumors indicates better prognosis in glioblastoma patients. J Neurosci 2013; 33: 14231-45. ArticlePubMedPMC
- 5. Louis DN, Ohgaki H, Wiestler OD, Cavenee WK. WHO classification of tumours of the central nervous system. Lyon: IARC Press, 2016.
- 6. Helal T, Salman M, Ezz-Elarab S. Pathology-based cancer registry 2001–2010. Cairo: Ain Shams Faculty of Medicine, 2015; 121.
- 7. Mokhtar N, Salama A, Badawy O, et al. Cancer pathology registry: a 12 year registry 2000–2011. Bethesda, MD: National Cancer Institue, 2011; 192-208.
- 8. Berghoff AS, Kiesel B, Widhalm G, et al. Programmed death ligand 1 expression and tumor-infiltrating lymphocytes in glioblastoma. Neuro Oncol 2015; 17: 1064-75. ArticlePubMed
- 9. Gatto F, Nielsen J. Systematic analysis of overall survival and interactions between tumor mutations and drug treatment. J Hematol Oncol 2016; 9: 15.ArticlePubMedPMC
- 10. Wainwright DA, Chang AL, Dey M, et al. Durable therapeutic efficacy utilizing combinatorial blockade against IDO, CTLA-4, and PD-L1 in mice with brain tumors. Clin Cancer Res 2014; 20: 5290-301. ArticlePubMedPMCPDF
- 11. Wang Y, Zhu C, Song W, Li J, Zhao G, Cao H. PD-L1 expression and CD8(+) T cell infiltration predict a favorable prognosis in advanced gastric cancer. J Immunol Res 2018; 2018: 4180517. ArticlePDF
- 12. Carbognin L, Pilotto S, Milella M, et al. Differential activity of nivolumab, pembrolizumab and MPDL3280A according to the tumor expression of programmed death-ligand-1 (PD-L1): sensitivity analysis of trials in melanoma, lung and genitourinary cancers. PLoS One 2015; 10: e0130142.ArticlePubMedPMC
- 13. Larkin J, Chiarion-Sileni V, Gonzalez R, et al. Combined nivolumab and ipilimumab or monotherapy in untreated melanoma. N Engl J Med 2015; 373: 23-34. PubMedPMC
- 14. Garon EB, Rizvi NA, Hui R, et al. Pembrolizumab for the treatment of non-small-cell lung cancer. N Engl J Med 2015; 372: 2018-28. PubMed
- 15. Topalian SL, Hodi FS, Brahmer JR, et al. Safety, activity, and immune correlates of anti-PD-1 antibody in cancer. N Engl J Med 2012; 366: 2443-54. PubMedPMC
- 16. Taube JM, Anders RA, Young GD, et al. Colocalization of inflammatory response with B7-h1 expression in human melanocytic lesions supports an adaptive resistance mechanism of immune escape. Sci Transl Med 2012; 4: 127ra37.ArticlePubMedPMC
- 17. Han S, Zhang C, Li Q, et al. Tumour-infiltrating CD4(+) and CD8(+) lymphocytes as predictors of clinical outcome in glioma. Br J Cancer 2014; 110: 2560-8. ArticlePubMedPMCPDF
- 18. Dahlin AM, Henriksson ML, Van Guelpen B, et al. Colorectal cancer prognosis depends on T-cell infiltration and molecular characteristics of the tumor. Mod Pathol 2011; 24: 671-82. ArticlePubMedPDF
- 19. McGranahan T, Therkelsen KE, Ahmad S, Nagpal S. Current state of Immunotherapy for treatment of glioblastoma. Curr Treat Options Oncol 2019; 20: 24.ArticlePubMedPMCPDF
- 20. Zhu P, Du XL, Lu G, Zhu JJ. Survival benefit of glioblastoma patients after FDA approval of temozolomide concomitant with radiation and bevacizumab: a population-based study. Oncotarget 2017; 8: 44015-31. ArticlePubMedPMC
- 21. Sato E, Olson SH, Ahn J, et al. Intraepithelial CD8+ tumor-infiltrating lymphocytes and a high CD8+/regulatory T cell ratio are associated with favorable prognosis in ovarian cancer. Proc Natl Acad Sci U S A 2005; 102: 18538-43. ArticlePubMedPMC
- 22. Wintterle S, Schreiner B, Mitsdoerffer M, et al. Expression of the B7-related molecule B7-H1 by glioma cells: a potential mechanism of immune paralysis. Cancer Res 2003; 63: 7462-7. PubMed
- 23. Wilmotte R, Burkhardt K, Kindler V, et al. B7-homolog 1 expression by human glioma: a new mechanism of immune evasion. Neuroreport 2005; 16: 1081-5. ArticlePubMed
- 24. Yao Y, Tao R, Wang X, Wang Y, Mao Y, Zhou LF. B7-H1 is correlated with malignancy-grade gliomas but is not expressed exclusively on tumor stem-like cells. Neuro Oncol 2009; 11: 757-66. ArticlePubMedPMC
- 25. Avril T, Saikali S, Vauleon E, et al. Distinct effects of human glioblastoma immunoregulatory molecules programmed cell death ligand-1 (PDL-1) and indoleamine 2,3-dioxygenase (IDO) on tumour-specific T cell functions. J Neuroimmunol 2010; 225: 22-33. ArticlePubMed
- 26. Zeng J, Zhang XK, Chen HD, Zhong ZH, Wu QL, Lin SX. Expression of programmed cell death-ligand 1 and its correlation with clinical outcomes in gliomas. Oncotarget 2016; 7: 8944-55. ArticlePubMedPMC
- 27. Garber ST, Hashimoto Y, Weathers SP, et al. Immune checkpoint blockade as a potential therapeutic target: surveying CNS malignancies. Neuro Oncol 2016; 18: 1357-66. ArticlePubMedPMC
- 28. Yang I, Han SJ, Sughrue ME, Tihan T, Parsa AT. Immune cell infiltrate differences in pilocytic astrocytoma and glioblastoma: evidence of distinct immunological microenvironments that reflect tumor biology. J Neurosurg 2011; 115: 505-11. ArticlePubMed
- 29. Rutledge WC, Kong J, Gao J, et al. Tumor-infiltrating lymphocytes in glioblastoma are associated with specific genomic alterations and related to transcriptional class. Clin Cancer Res 2013; 19: 4951-60. ArticlePubMedPDF
- 30. Mahmoud SM, Paish EC, Powe DG, et al. Tumor-infiltrating CD8+ lymphocytes predict clinical outcome in breast cancer. J Clin Oncol 2011; 29: 1949-55. ArticlePubMed
- 31. Ballman KV, Buckner JC, Brown PD, et al. The relationship between six-month progression-free survival and 12-month overall survival end points for phase II trials in patients with glioblastoma multiforme. Neuro Oncol 2007; 9: 29-38. ArticlePubMedPMC
- 32. Preusser M, Berghoff AS, Wick W, Weller M. Clinical Neuropathology mini-review 6-2015: PD-L1: emerging biomarker in glioblastoma? Clin Neuropathol 2015; 34: 313-21. ArticlePubMedPMC
- 33. Francisco LM, Salinas VH, Brown KE, et al. PD-L1 regulates the development, maintenance, and function of induced regulatory T cells. J Exp Med 2009; 206: 3015-29. ArticlePubMedPMCPDF
- 34. Cheng X, Veverka V, Radhakrishnan A, et al. Structure and interactions of the human programmed cell death 1 receptor. J Biol Chem 2013; 288: 11771-85. ArticlePubMedPMC
- 35. Romani M, Pistillo MP, Carosio R, Morabito A, Banelli B. Immune checkpoints and innovative therapies in glioblastoma. Front Oncol 2018; 8: 464.ArticlePubMedPMC
- 36. Kim YH, Jung TY, Jung S, et al. Tumour-infiltrating T-cell subpopulations in glioblastomas. Br J Neurosurg 2012; 26: 21-7. ArticlePubMed
- 37. Heimberger AB, Abou-Ghazal M, Reina-Ortiz C, et al. Incidence and prognostic impact of FoxP3+ regulatory T cells in human gliomas. Clin Cancer Res 2008; 14: 5166-72. ArticlePubMedPDF
- 38. Galon J, Costes A, Sanchez-Cabo F, et al. Type, density, and location of immune cells within human colorectal tumors predict clinical outcome. Science 2006; 313: 1960-4. ArticlePubMed
- 39. Pages F, Kirilovsky A, Mlecnik B, et al. In situ cytotoxic and memory T cells predict outcome in patients with early-stage colorectal cancer. J Clin Oncol 2009; 27: 5944-51. ArticlePubMed
REFERENCES
Figure & Data
References
Citations
- Dual biomarker role of PD-L1 and LC3B in glioblastoma: prognostic and therapeutic potential
Rana Fathy Torky, Rania Makboul, Dalia M. Badary, Wael M. A. El-Ghani, Ahmed El-Hakeem, Rabab M. H. El Ghorori
Neurosurgical Review.2026;[Epub] CrossRef - Pathological diagnosis of central nervous system tumours in adults: what's new?
Evert-Jan Kooi, Lukas Marcelis, Pieter Wesseling
Pathology.2025; 57(2): 144. CrossRef - Expression of Programmed Cell Death-Ligand 1 (PD-L1) in Astrocytic Tumors and Its Correlation With Histopathological Grade and Proliferative Index (Ki-67): A Cross-Sectional Study
Namita Singh, Ranjana Giri, Prita Pradhan, Diptiranjan Satapathy, Ipsita Debata
Cureus.2025;[Epub] CrossRef - Immune intrinsic escape signature stratifies prognosis, characterizes the tumor immune microenvironment, and identifies tumorigenic PPP1R8 in glioblastoma multiforme patients
Ran Du, Lijun Jing, Denggang Fu
Frontiers in Immunology.2025;[Epub] CrossRef - PD-L1 Clones and Their Relevance in Glioblastoma, IDH-Wildtype: A Comparative Analysis
Michal Hendrych, Frantisek Vana, Marketa Hermanova, Radek Lakomy, Tomas Kazda, Kvetoslava Matulova, Alena Kopkova, Martina Jelinkova, Radim Jancalek, Martin Smrcka, Vaclav Vybihal, Jiri Sana
Bratislava Medical Journal.2025; 126(9): 2233. CrossRef - Tumor-associated microenvironment, PD-L1 expression and their relationship with immunotherapy in glioblastoma, IDH-wild type: A comprehensive review with emphasis on the implications for neuropathologists
Giuseppe Broggi, Giuseppe Angelico, Jessica Farina, Giordana Tinnirello, Valeria Barresi, Magda Zanelli, Andrea Palicelli, Francesco Certo, Giuseppe Barbagallo, Gaetano Magro, Rosario Caltabiano
Pathology - Research and Practice.2024; 254: 155144. CrossRef - Immunophenotypic Profile of Adult Glioblastoma IDH-Wildtype Microenvironment: A Cohort Study
Sofia Asioli, Lidia Gatto, Uri Vardy, Claudio Agostinelli, Vincenzo Di Nunno, Simona Righi, Alicia Tosoni, Francesca Ambrosi, Stefania Bartolini, Caterina Giannini, Enrico Franceschi
Cancers.2024; 16(22): 3859. CrossRef - Analysis of PD-L1 and CD3 Expression in Glioblastoma Patients and Correlation with Outcome: A Single Center Report
Navid Sobhani, Victoria Bouchè, Giovanni Aldegheri, Andrea Rocca, Alberto D’Angelo, Fabiola Giudici, Cristina Bottin, Carmine Antonio Donofrio, Maurizio Pinamonti, Benvenuto Ferrari, Stefano Panni, Marika Cominetti, Jahard Aliaga, Marco Ungari, Antonio Fi
Biomedicines.2023; 11(2): 311. CrossRef - Immuno-PET Imaging of Tumour PD-L1 Expression in Glioblastoma
Gitanjali Sharma, Marta C. Braga, Chiara Da Pieve, Wojciech Szopa, Tatjana Starzetz, Karl H. Plate, Wojciech Kaspera, Gabriela Kramer-Marek
Cancers.2023; 15(12): 3131. CrossRef
 PubReader
 ePub Link
-
 Cite this Article
- Cite this Article
-
- Close
- Download Citation
- Close
- Figure
-
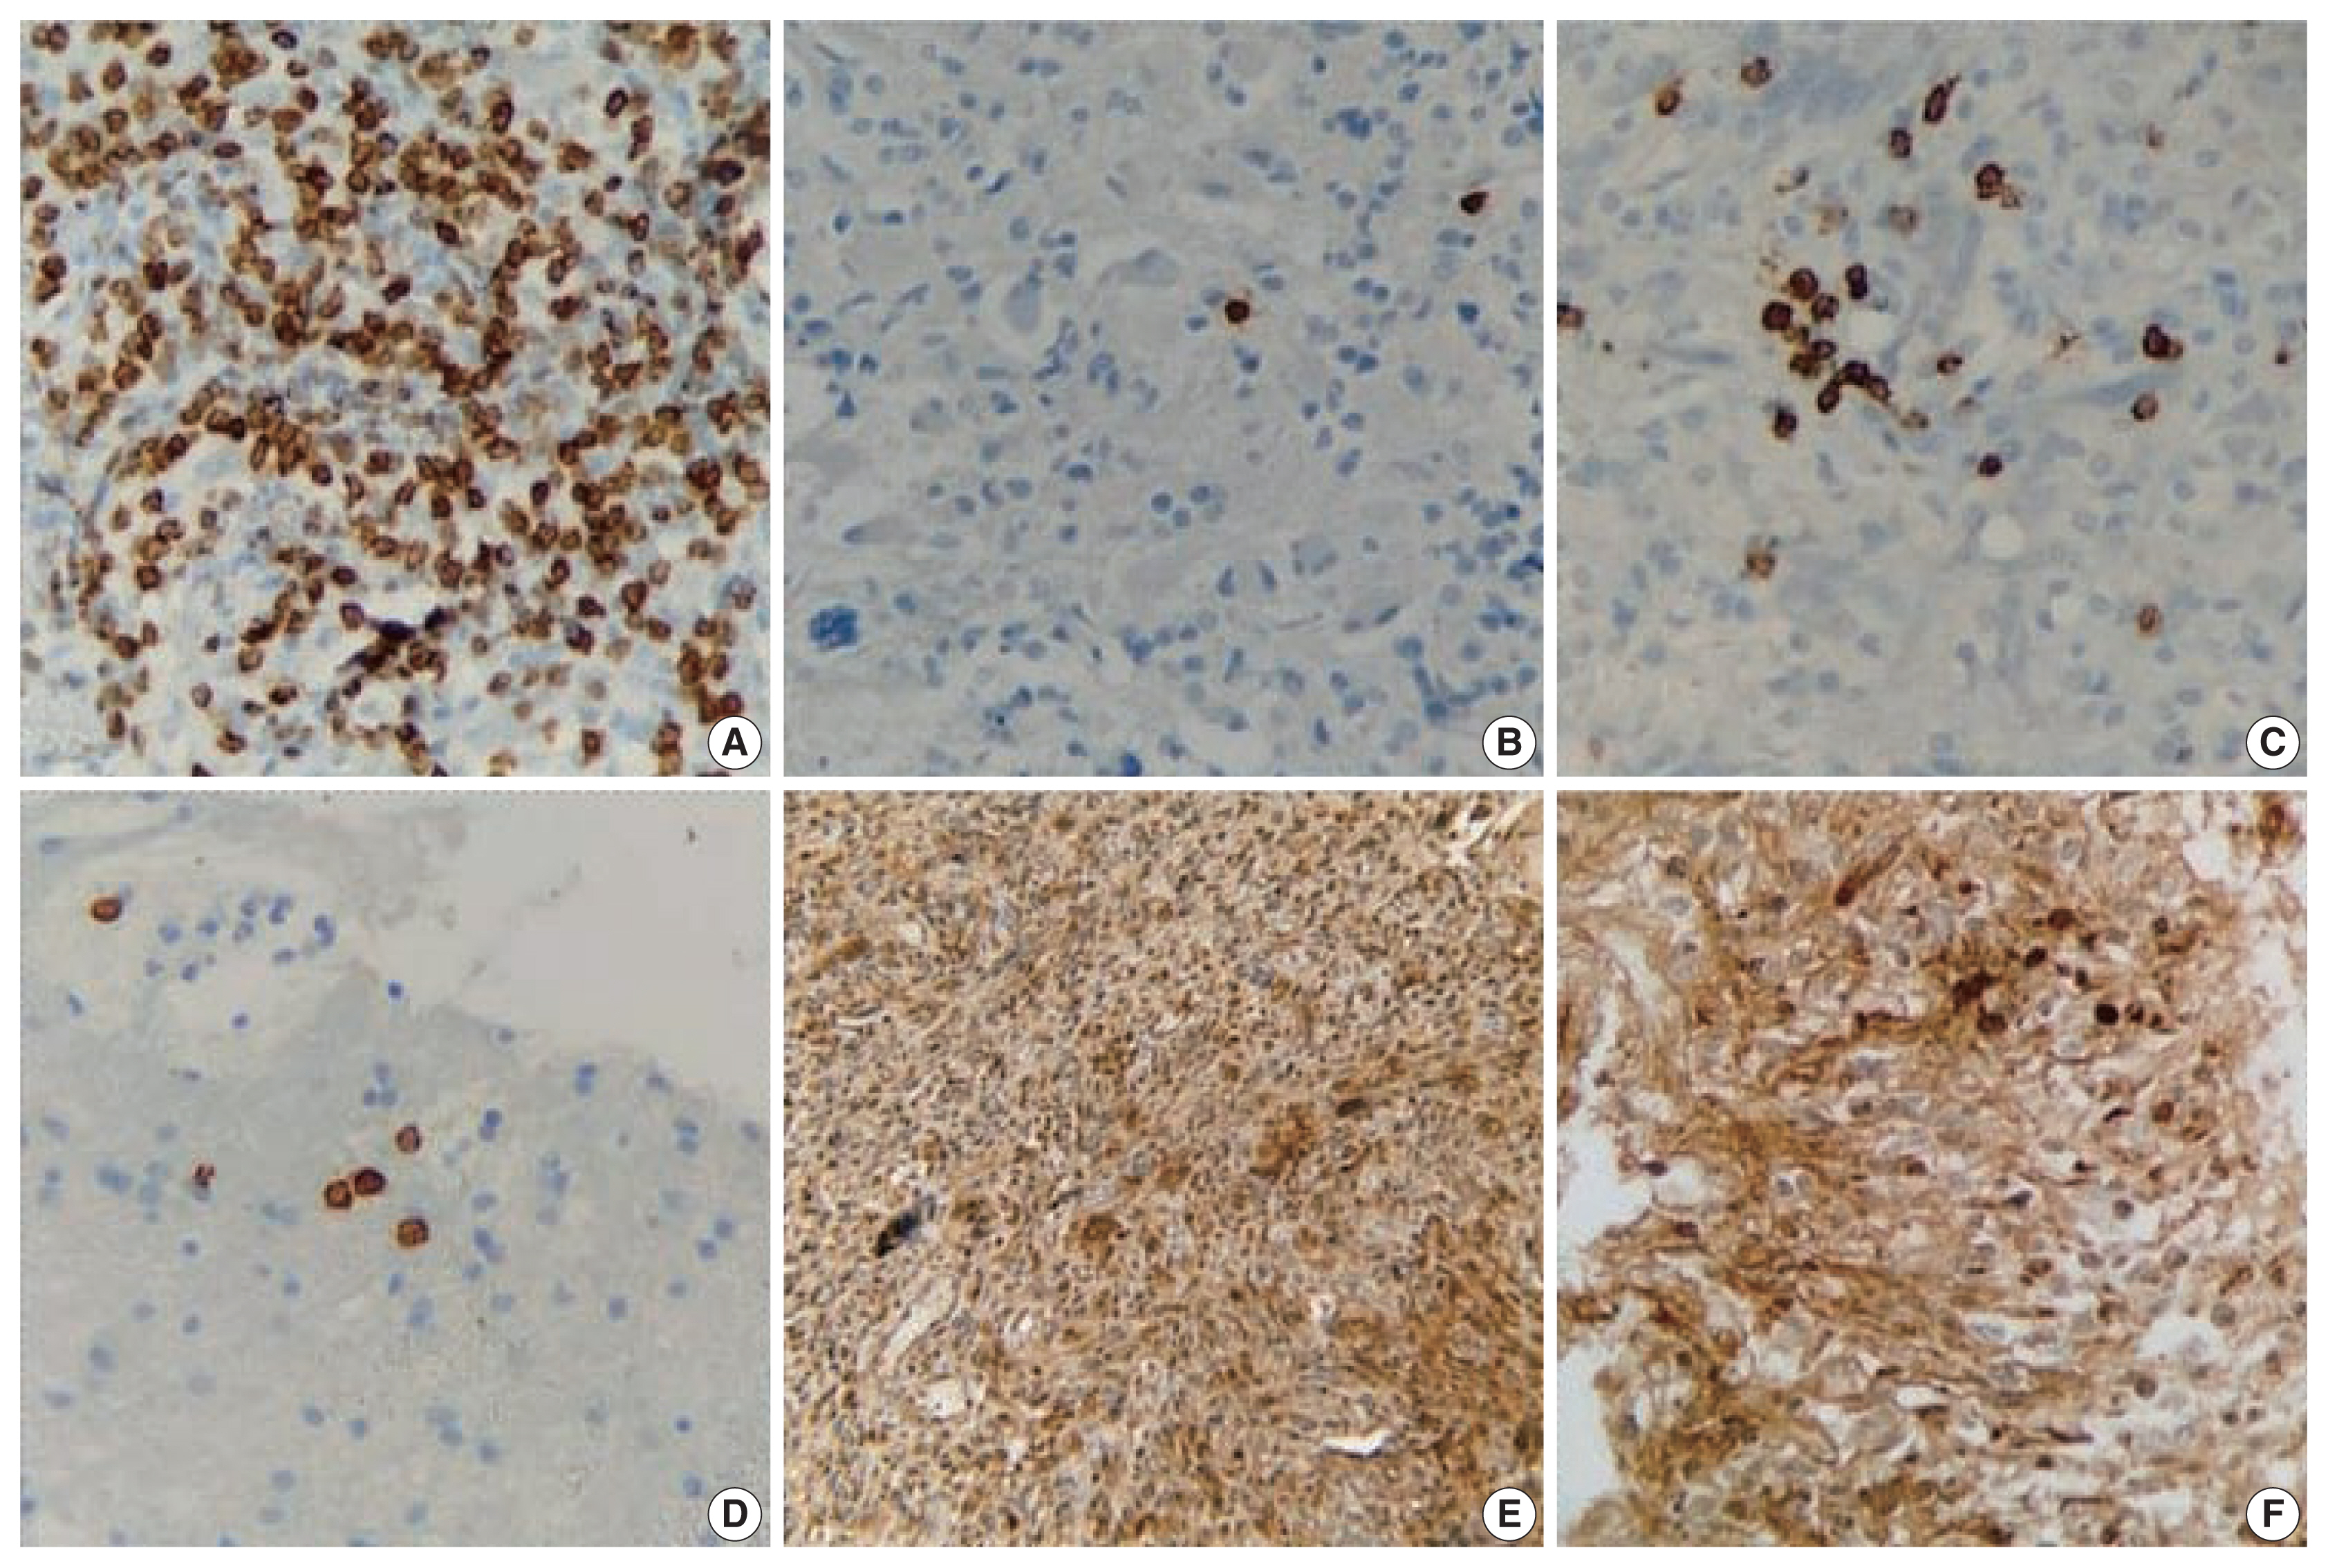
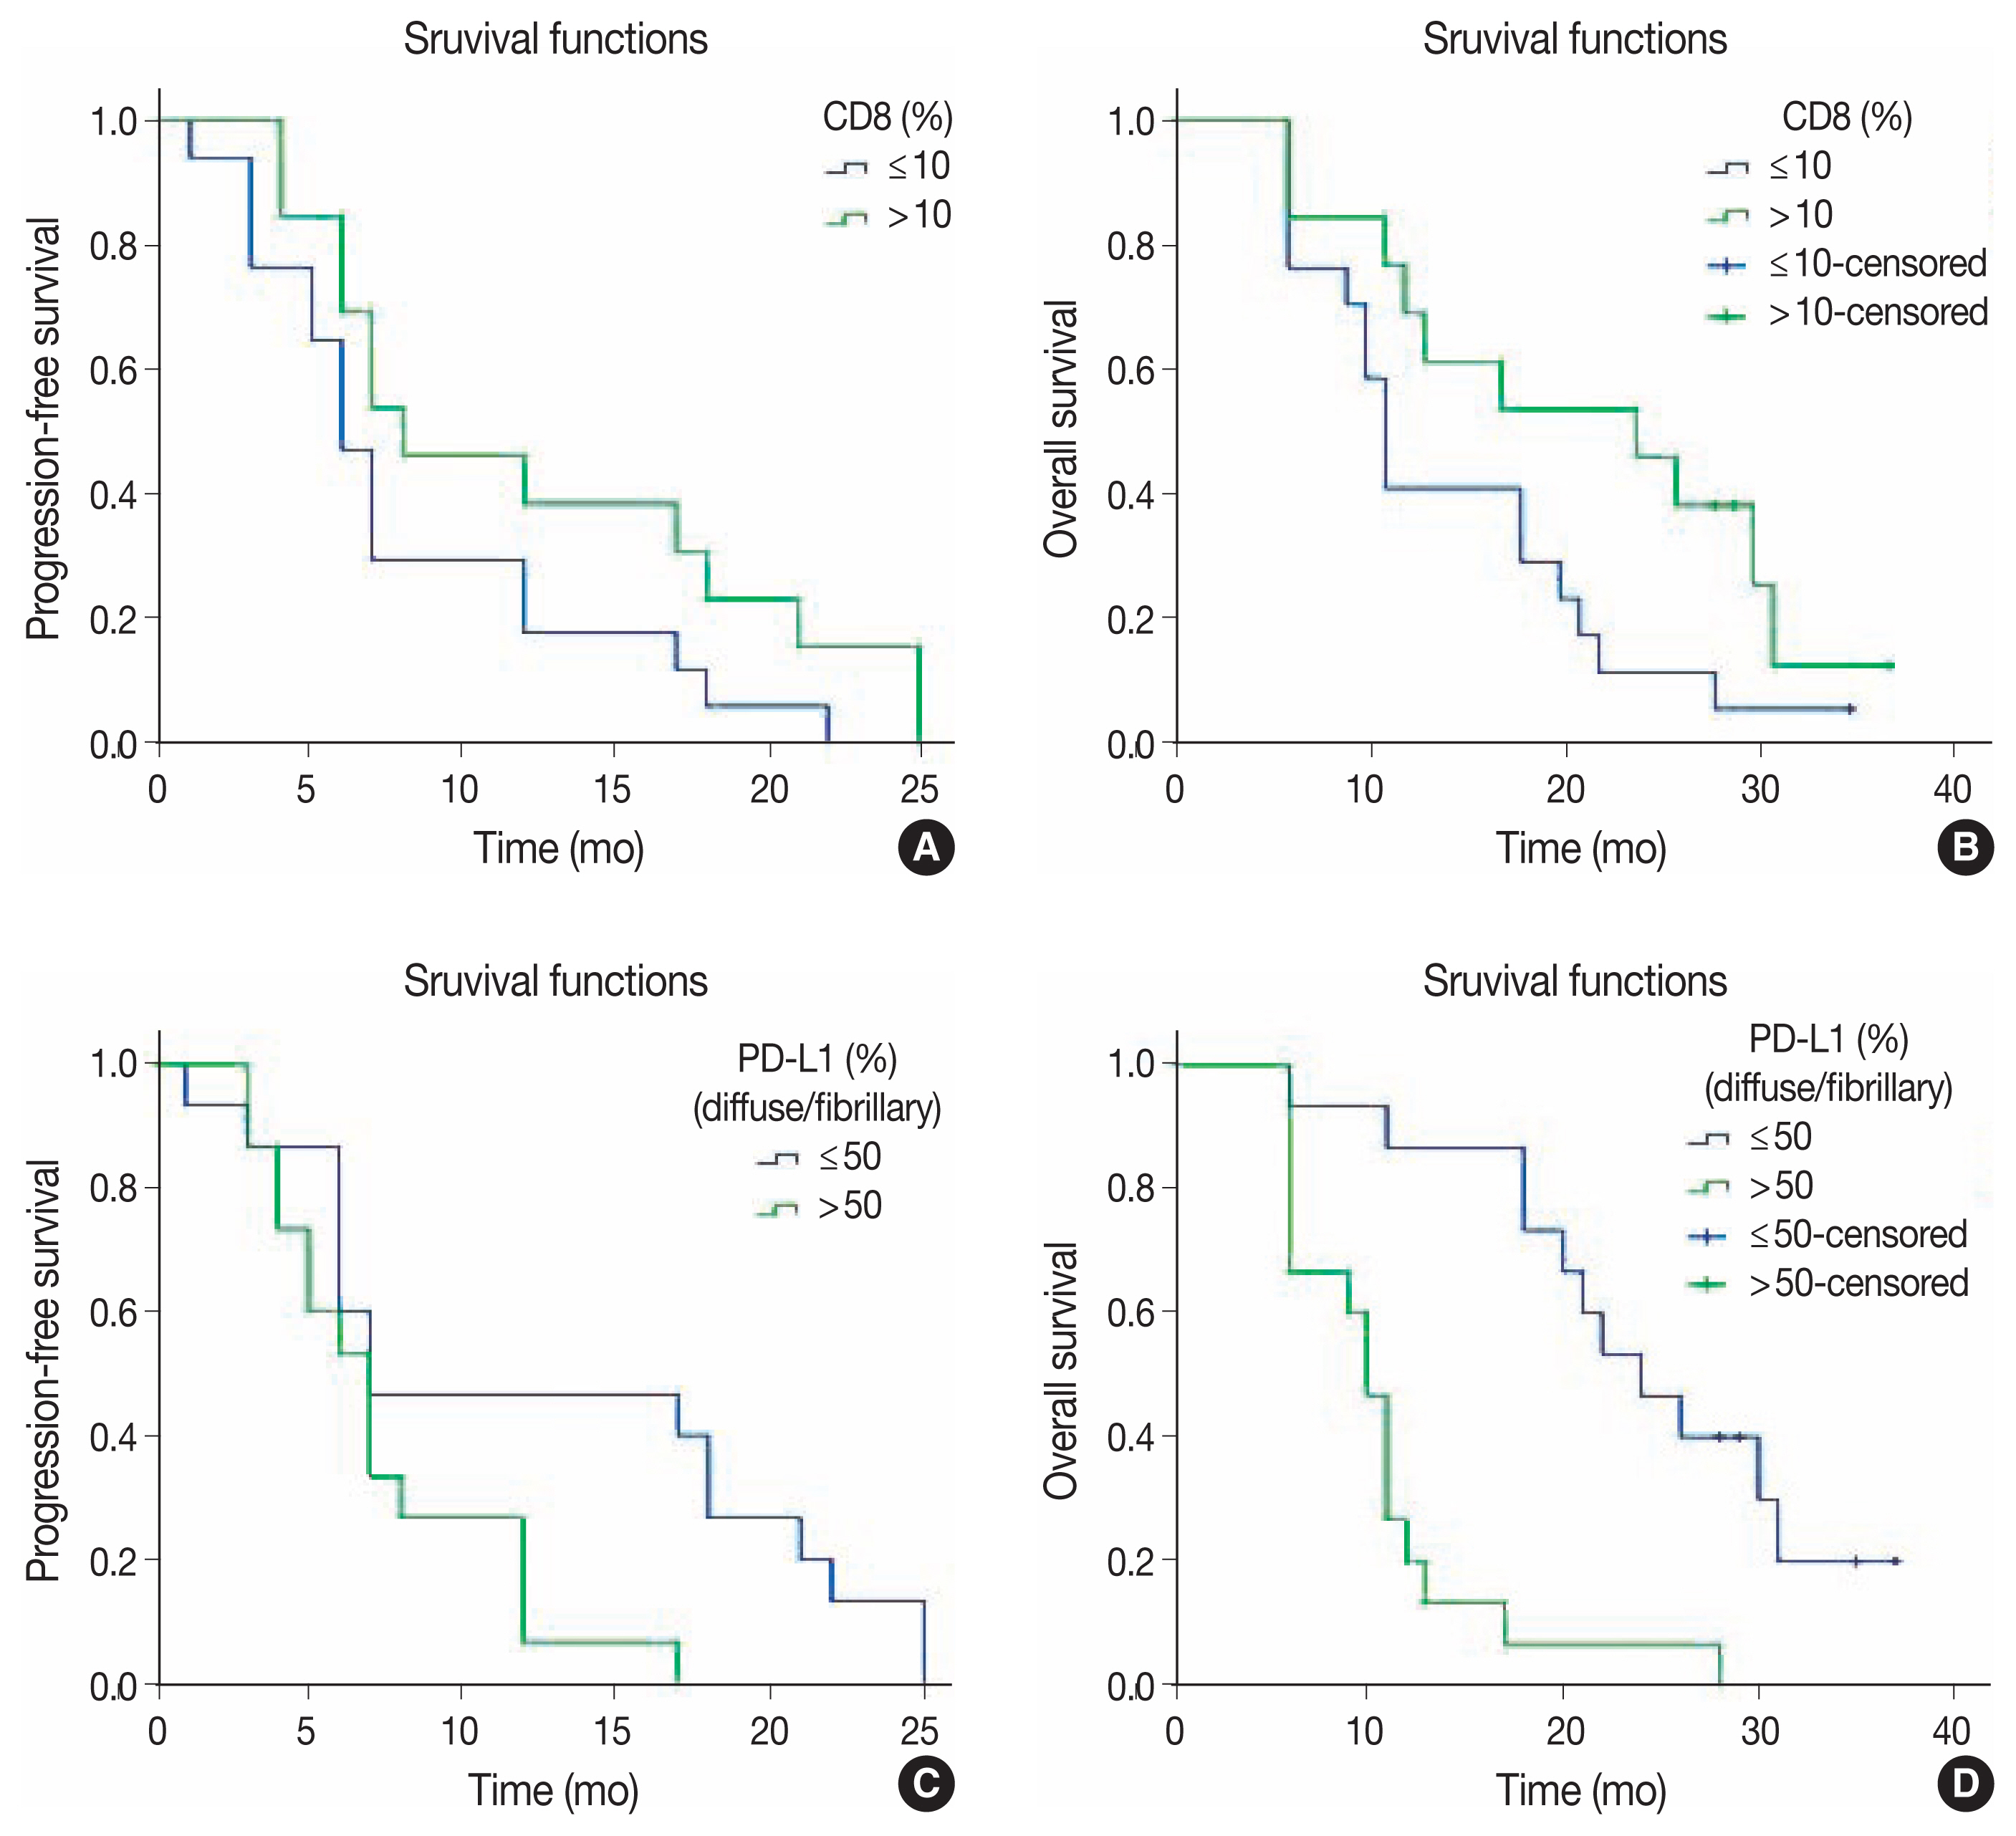


Fig. 1
Fig. 2
| PD-L1, n (%) | Test of significance | ||||
|---|---|---|---|---|---|
|
|
| ||||
| Low expression group ≤ 50% |
High expression group > 50% |
χ2 | p-value | Significance | |
| Age (yr) | 1.2 | .273 | NS | ||
| < 53 | 9 (60.0) | 6 (40.0) | |||
| ≥ 53 | 6 (40.0) | 9 (60.0) | |||
| Sex | Fisher exact test | .682 | NS | ||
| Male | 12 (54.5) | 10 (45.5) | |||
| Female | 3 (37.5) | 5 (62.5) | |||
| Laterality | 0.54 | .464 | NS | ||
| Left | 6 (46.2) | 7 (53.8) | |||
| Right | 9 (60.0) | 6 (40.0) | |||
| CD8 | Test of significance | ||||
|---|---|---|---|---|---|
|
|
| ||||
| Low infiltration group ≤ 10% |
High infiltration group > 10% |
χ2 | p-value | Significance | |
| Age (yr) | 0.14 | .713 | NS | ||
| < 53 | 9 (60.0) | 6 (40.0) | |||
| ≥ 53 | 8 (53.3) | 7 (46.7) | |||
| Sex | Fisher exact test | > .99 | NS | ||
| Male | 12 (54.5) | 10 (45.5) | |||
| Female | 5 (62.5) | 3 (37.5) | |||
| Laterality | 2.39 | .122 | NS | ||
| Left | 9 (69.2) | 4 (30.8) | |||
| Right | 6 (40.0) | 9 (60.0) | |||
| PFS (mo) | OS (mo) | |||||
|---|---|---|---|---|---|---|
|
|
| |||||
| Mean ± SE | 95% CI | p-value | Mean±SE | 95% CI | p-value | |
| Age (yr) | .432 | .690 | ||||
| < 53 | 9.20 ± 1.69 | 5.89–12.51 | 18.47 ± 2.51 | 13.54–23.39 | ||
| ≥ 53 | 10.80 ± 1.97 | 6.94–14.66 | 16.87 ± 2.71 | 11.56–22.17 | ||
| Sex | .004 | .317 | ||||
| Male | 11.90 ± 1.54 | 8.89–14.92 | 18.97 ± 2.12 | 14.82–23.12 | ||
| Female | 4.70 ± 0.82 | 3.15–6.35 | 13.63 ± 3.21 | 7.34–19.91 | ||
| Laterality | .760 | .647 | ||||
| Left | 10.69 ± 2.14 | 6.49–14.89 | 19.08 ± 2.78 | 13.63–24.52 | ||
| Right | 9.87 ± 1.80 | 6.33–13.40 | 17.57 ± 2.58 | 12.51–22.62 | ||
| PD-L1 | .026 | < .001 | ||||
| ≤ 50% |
12.53 ± 2.19 | 8.24–16.83 | 24.57 ± 2.37 | 19.93–29.20 | ||
| > 50% |
7.47 ± 1.05 | 5.41–9.53 | 10.80 ± 1.48 | 7.90–13.70 | ||
| CD8+ TILs | .093 | .066 | ||||
| ≤ 10% |
8.24 ± 1.44 | 5.41–11.06 | 14.59 ± 2 | 10.67–18.50 | ||
| > 10% |
12.30 ± 2.18 | 8.03–16.59 | 21.41 ± 2.98 | 15.57–27.26 | ||
| Progression-free survival | Overall survival | |||||
|---|---|---|---|---|---|---|
|
|
| |||||
| HR | 95% CI | p-value | HR | 95% CI | p-value | |
| Age ≥ 53 yr | 0.60 | 0.26–1.41 | .241 | 0.63 | 0.25–1.6 | .334 |
| Female sex | 2.56 | 0.93–7.07 | .069 | 1.25 | 0.47–3.28 | .653 |
| PD-L1 > 50% |
1.82 | 0.68–4.83 | .232 | 6.30 | 2.22–17.91 | .001 |
| CD8 > 10% |
0.63 | 0.27–1.49 | .295 | 0.53 | 0.2–1.4 | .203 |
PD-L1, programmed death-ligand 1; NS, not significant. 50% is the cutoff point used to categorize PD-L1 expression into low and high expression groups.
NS, not significant. 10% is the cutoff point used to categorize CD8 expression into low and high infiltration groups.
PD-L1, programmed death-ligand 1; TILs, tumor-infiltrating lymphocytes; PFS, progression-free survival; OS, overall survival; SE, standard error; CI, confidence interval. 50% is the cutoff point used to categorize PD-L1 expression into low and high expression groups; 10% is the cutoff point used to categorize CD8 expression into low and high infiltration groups.
HR, hazard ratio; CI, confidence interval; PD-L1, programmed death-ligand 1. 50% is the cutoff point used to categorize PD-L1 expression into low and high expression groups; Significant; 10% is the cutoff point used to categorize CD8 expression into low and high infiltration groups.

