Articles
- Page Path
- HOME > J Pathol Transl Med > Volume 55(6); 2021 > Article
-
Original Article
Immunohistochemical expression of programmed death-ligand 1 and CD8 in glioblastomas -
Dina Mohamed El Samman1
 , Manal Mohamed El Mahdy1
 , Hala Sobhy Cousha1
 , Zeinab Abd El Rahman Kamar1, Khaled Abdel Karim Mohamed2
 , Hoda Hassan Abou Gabal1
-
Journal of Pathology and Translational Medicine 2021;55(6):388-397.
DOI: https://doi.org/10.4132/jptm.2021.08.04
Published online: October 14, 2021
1Department of Pathology, Ain Shams University, Cairo, Egypt
2Department of Clinical Oncology, Ain Shams University, Cairo, Egypt
- Corresponding Author: Dina Mohamed El Samman, MSc, Department of Pathology, Faculty of Medicine, Ain Shams University, Abbassyia Square, Ramsis Street, Cairo 11566, Egypt Tel: +20-1123342337, +20-1147509744, Fax: +20-224346753, +20-224346041, E-mail: dina_elsamman@med.asu.edu.eg, dina.elsamman@yahoo.com
© 2021 The Korean Society of Pathologists/The Korean Society for Cytopathology
This is an Open Access article distributed under the terms of the Creative Commons Attribution Non-Commercial License (https://creativecommons.org/licenses/by-nc/4.0) which permits unrestricted non-commercial use, distribution, and reproduction in any medium, provided the original work is properly cited.
Figure & Data
References
Citations

- Pathological diagnosis of central nervous system tumours in adults: what's new?
Evert-Jan Kooi, Lukas Marcelis, Pieter Wesseling
Pathology.2025; 57(2): 144. CrossRef - Expression of Programmed Cell Death-Ligand 1 (PD-L1) in Astrocytic Tumors and Its Correlation With Histopathological Grade and Proliferative Index (Ki-67): A Cross-Sectional Study
Namita Singh, Ranjana Giri, Prita Pradhan, Diptiranjan Satapathy, Ipsita Debata
Cureus.2025;[Epub] CrossRef - Immune intrinsic escape signature stratifies prognosis, characterizes the tumor immune microenvironment, and identifies tumorigenic PPP1R8 in glioblastoma multiforme patients
Ran Du, Lijun Jing, Denggang Fu
Frontiers in Immunology.2025;[Epub] CrossRef - PD-L1 Clones and Their Relevance in Glioblastoma, IDH-Wildtype: A Comparative Analysis
Michal Hendrych, Frantisek Vana, Marketa Hermanova, Radek Lakomy, Tomas Kazda, Kvetoslava Matulova, Alena Kopkova, Martina Jelinkova, Radim Jancalek, Martin Smrcka, Vaclav Vybihal, Jiri Sana
Bratislava Medical Journal.2025; 126(9): 2233. CrossRef - Tumor-associated microenvironment, PD-L1 expression and their relationship with immunotherapy in glioblastoma, IDH-wild type: A comprehensive review with emphasis on the implications for neuropathologists
Giuseppe Broggi, Giuseppe Angelico, Jessica Farina, Giordana Tinnirello, Valeria Barresi, Magda Zanelli, Andrea Palicelli, Francesco Certo, Giuseppe Barbagallo, Gaetano Magro, Rosario Caltabiano
Pathology - Research and Practice.2024; 254: 155144. CrossRef - Immunophenotypic Profile of Adult Glioblastoma IDH-Wildtype Microenvironment: A Cohort Study
Sofia Asioli, Lidia Gatto, Uri Vardy, Claudio Agostinelli, Vincenzo Di Nunno, Simona Righi, Alicia Tosoni, Francesca Ambrosi, Stefania Bartolini, Caterina Giannini, Enrico Franceschi
Cancers.2024; 16(22): 3859. CrossRef - Analysis of PD-L1 and CD3 Expression in Glioblastoma Patients and Correlation with Outcome: A Single Center Report
Navid Sobhani, Victoria Bouchè, Giovanni Aldegheri, Andrea Rocca, Alberto D’Angelo, Fabiola Giudici, Cristina Bottin, Carmine Antonio Donofrio, Maurizio Pinamonti, Benvenuto Ferrari, Stefano Panni, Marika Cominetti, Jahard Aliaga, Marco Ungari, Antonio Fi
Biomedicines.2023; 11(2): 311. CrossRef - Immuno-PET Imaging of Tumour PD-L1 Expression in Glioblastoma
Gitanjali Sharma, Marta C. Braga, Chiara Da Pieve, Wojciech Szopa, Tatjana Starzetz, Karl H. Plate, Wojciech Kaspera, Gabriela Kramer-Marek
Cancers.2023; 15(12): 3131. CrossRef
 PubReader
 ePub Link
-
 Cite this Article
- Cite this Article
-
- Close
- Download Citation
- Close
- Figure


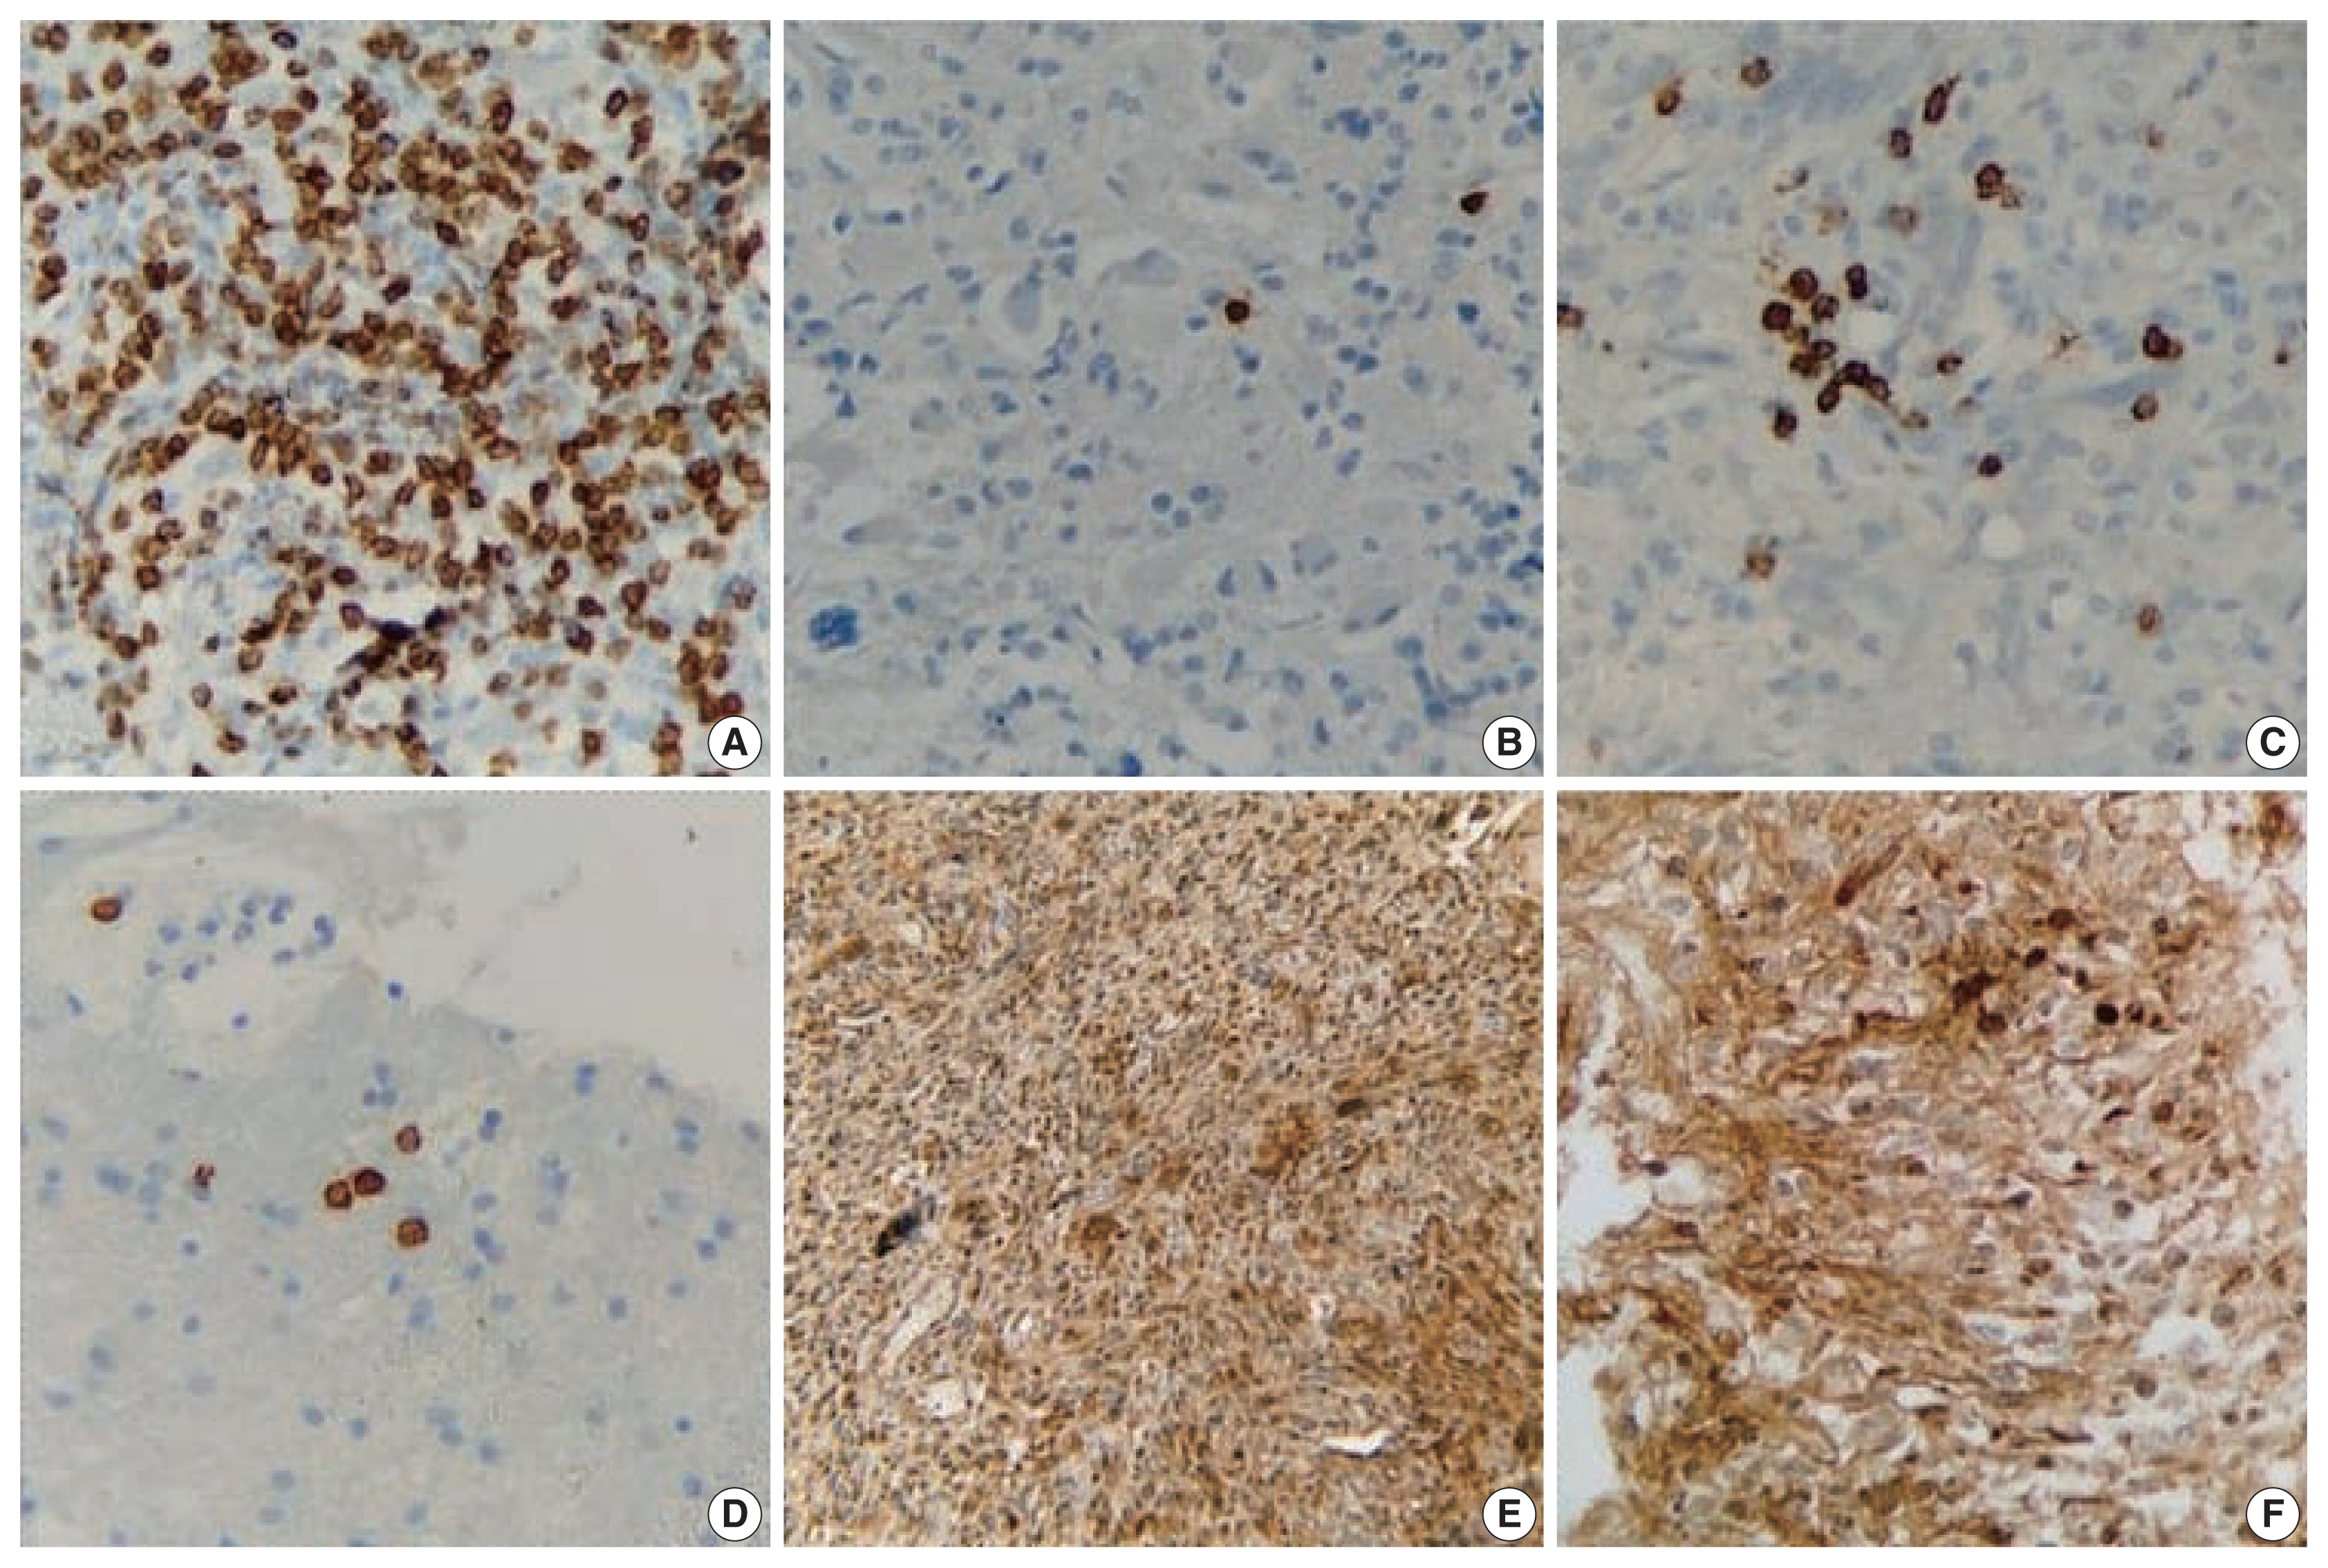
Fig. 1
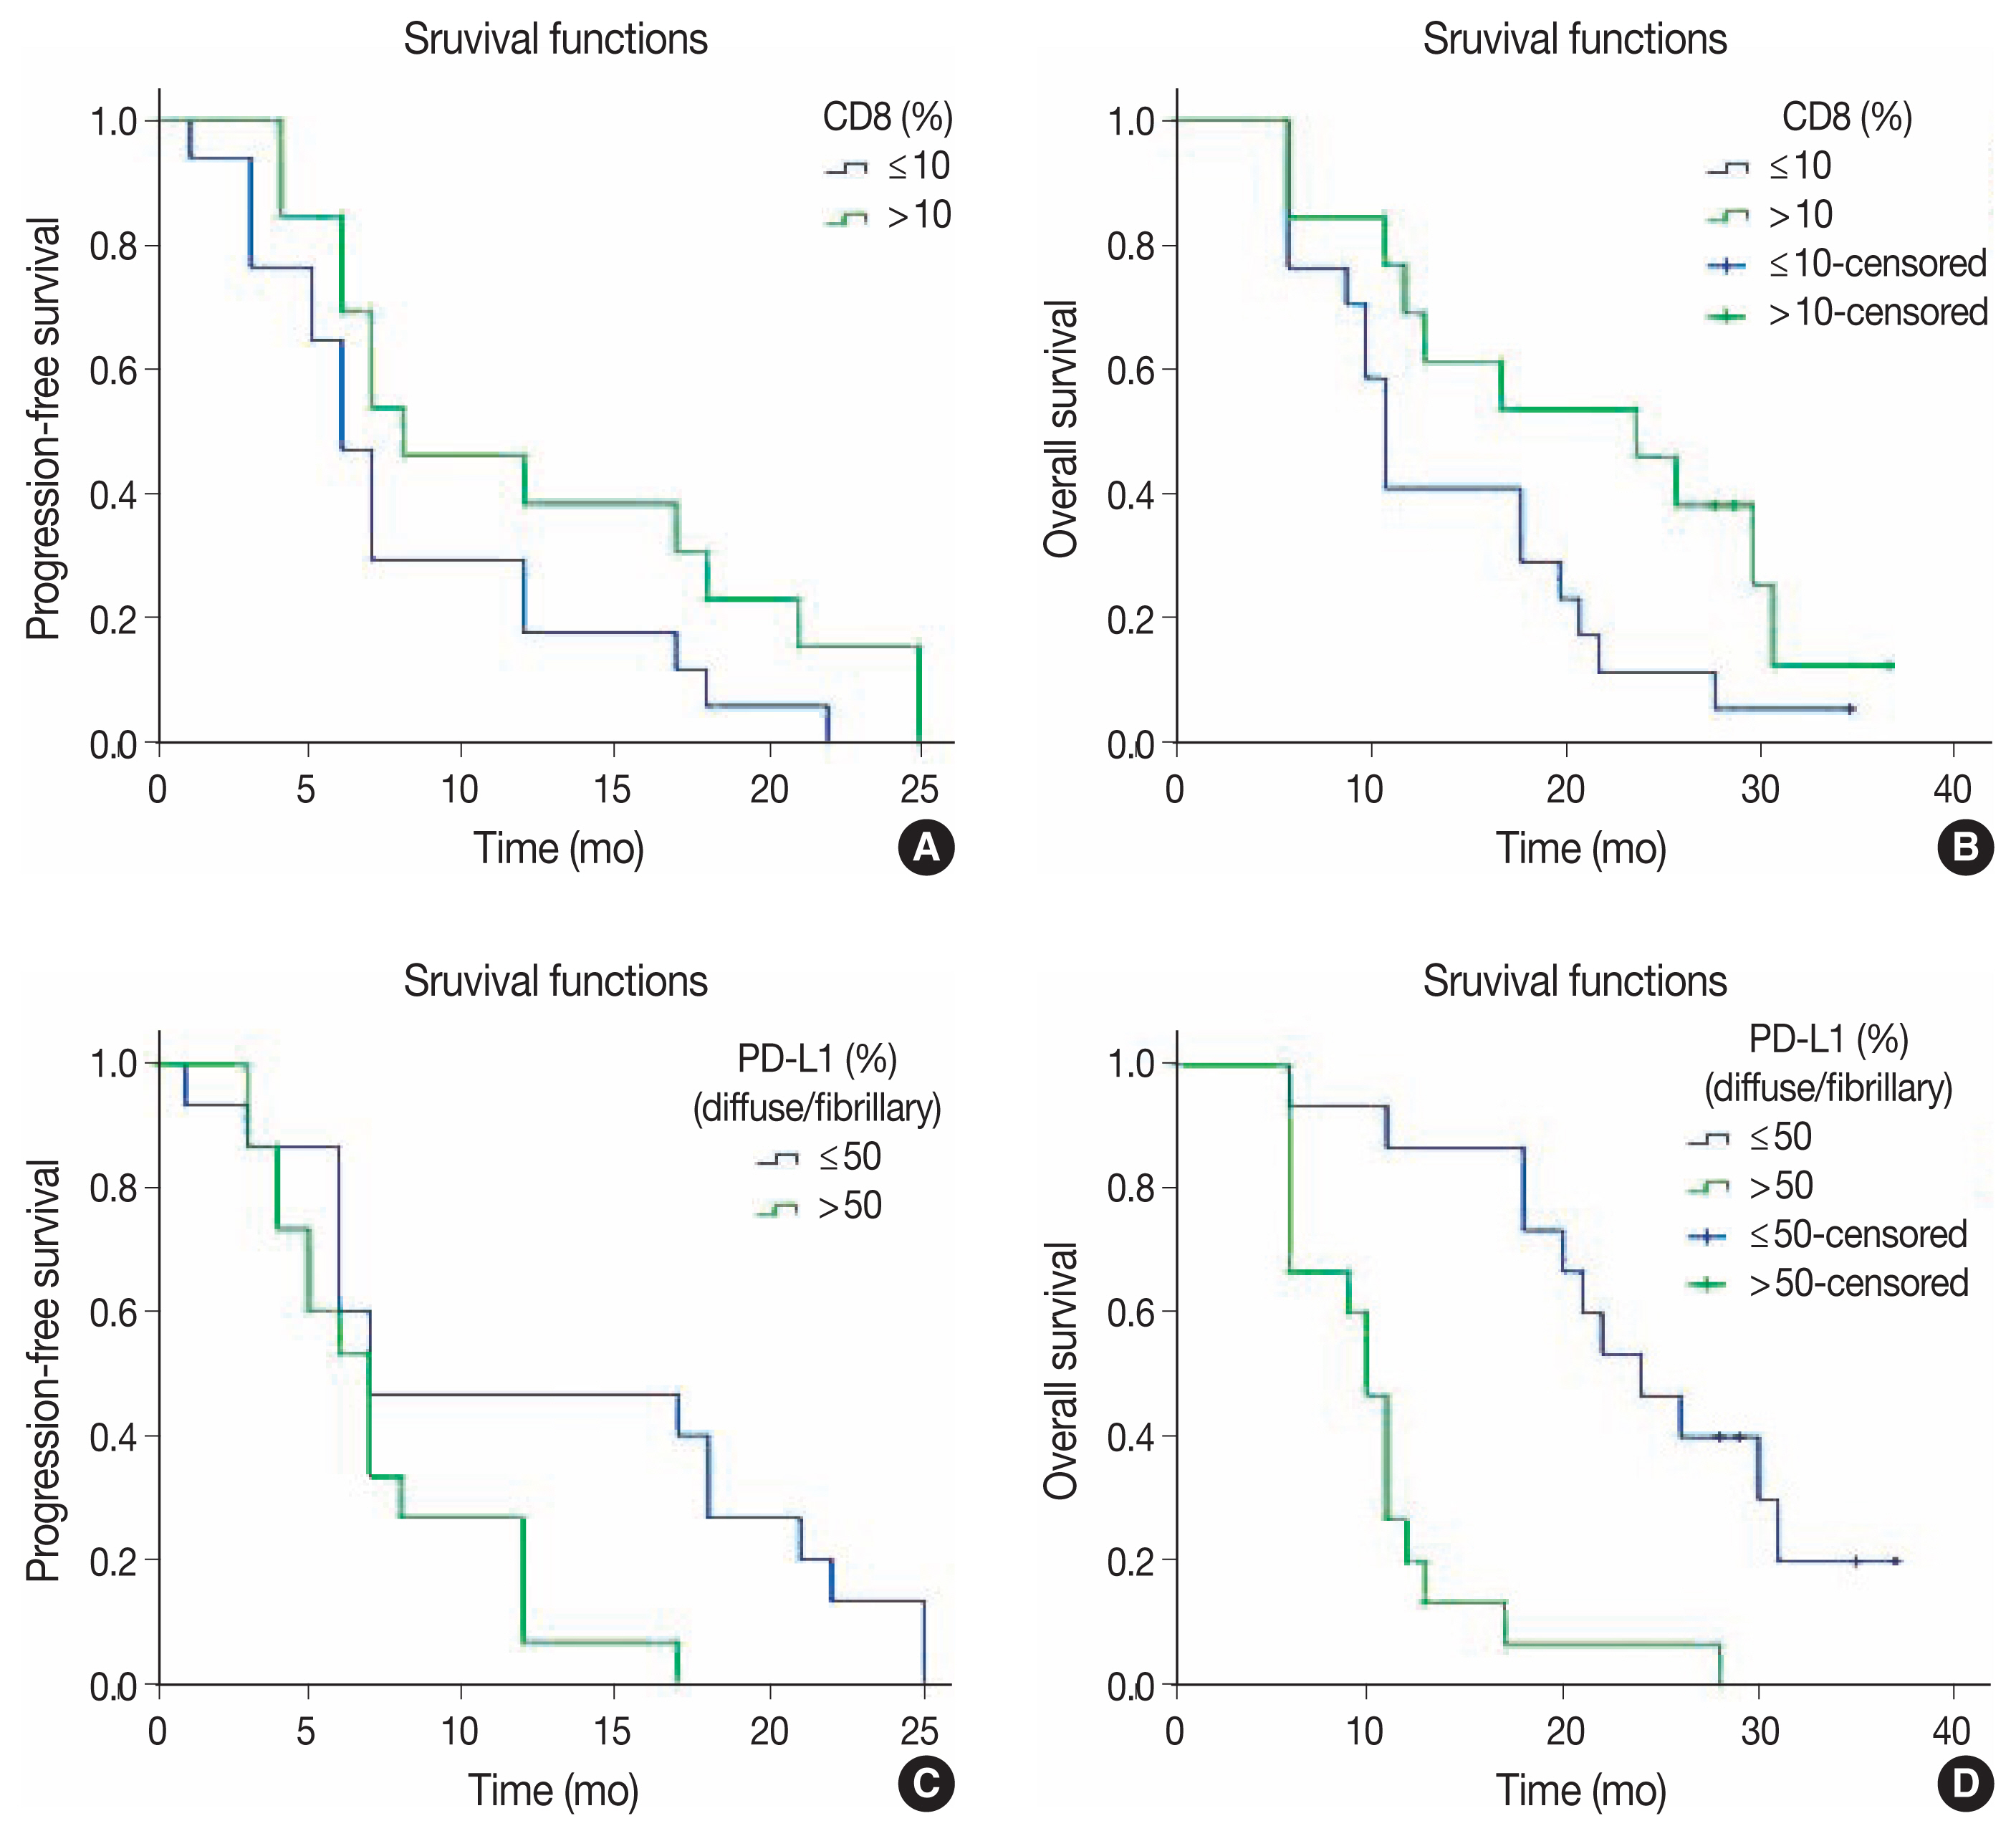
Fig. 2
| PD-L1, n (%) | Test of significance | ||||
|---|---|---|---|---|---|
|
|
| ||||
| Low expression group ≤ 50% |
High expression group > 50% |
χ2 | p-value | Significance | |
| Age (yr) | 1.2 | .273 | NS | ||
| < 53 | 9 (60.0) | 6 (40.0) | |||
| ≥ 53 | 6 (40.0) | 9 (60.0) | |||
| Sex | Fisher exact test | .682 | NS | ||
| Male | 12 (54.5) | 10 (45.5) | |||
| Female | 3 (37.5) | 5 (62.5) | |||
| Laterality | 0.54 | .464 | NS | ||
| Left | 6 (46.2) | 7 (53.8) | |||
| Right | 9 (60.0) | 6 (40.0) | |||
| CD8 | Test of significance | ||||
|---|---|---|---|---|---|
|
|
| ||||
| Low infiltration group ≤ 10% |
High infiltration group > 10% |
χ2 | p-value | Significance | |
| Age (yr) | 0.14 | .713 | NS | ||
| < 53 | 9 (60.0) | 6 (40.0) | |||
| ≥ 53 | 8 (53.3) | 7 (46.7) | |||
| Sex | Fisher exact test | > .99 | NS | ||
| Male | 12 (54.5) | 10 (45.5) | |||
| Female | 5 (62.5) | 3 (37.5) | |||
| Laterality | 2.39 | .122 | NS | ||
| Left | 9 (69.2) | 4 (30.8) | |||
| Right | 6 (40.0) | 9 (60.0) | |||
| PFS (mo) | OS (mo) | |||||
|---|---|---|---|---|---|---|
|
|
| |||||
| Mean ± SE | 95% CI | p-value | Mean±SE | 95% CI | p-value | |
| Age (yr) | .432 | .690 | ||||
| < 53 | 9.20 ± 1.69 | 5.89–12.51 | 18.47 ± 2.51 | 13.54–23.39 | ||
| ≥ 53 | 10.80 ± 1.97 | 6.94–14.66 | 16.87 ± 2.71 | 11.56–22.17 | ||
| Sex | .004 | .317 | ||||
| Male | 11.90 ± 1.54 | 8.89–14.92 | 18.97 ± 2.12 | 14.82–23.12 | ||
| Female | 4.70 ± 0.82 | 3.15–6.35 | 13.63 ± 3.21 | 7.34–19.91 | ||
| Laterality | .760 | .647 | ||||
| Left | 10.69 ± 2.14 | 6.49–14.89 | 19.08 ± 2.78 | 13.63–24.52 | ||
| Right | 9.87 ± 1.80 | 6.33–13.40 | 17.57 ± 2.58 | 12.51–22.62 | ||
| PD-L1 | .026 | < .001 | ||||
| ≤ 50% |
12.53 ± 2.19 | 8.24–16.83 | 24.57 ± 2.37 | 19.93–29.20 | ||
| > 50% |
7.47 ± 1.05 | 5.41–9.53 | 10.80 ± 1.48 | 7.90–13.70 | ||
| CD8+ TILs | .093 | .066 | ||||
| ≤ 10% |
8.24 ± 1.44 | 5.41–11.06 | 14.59 ± 2 | 10.67–18.50 | ||
| > 10% |
12.30 ± 2.18 | 8.03–16.59 | 21.41 ± 2.98 | 15.57–27.26 | ||
| Progression-free survival | Overall survival | |||||
|---|---|---|---|---|---|---|
|
|
| |||||
| HR | 95% CI | p-value | HR | 95% CI | p-value | |
| Age ≥ 53 yr | 0.60 | 0.26–1.41 | .241 | 0.63 | 0.25–1.6 | .334 |
| Female sex | 2.56 | 0.93–7.07 | .069 | 1.25 | 0.47–3.28 | .653 |
| PD-L1 > 50% |
1.82 | 0.68–4.83 | .232 | 6.30 | 2.22–17.91 | .001 |
| CD8 > 10% |
0.63 | 0.27–1.49 | .295 | 0.53 | 0.2–1.4 | .203 |
PD-L1, programmed death-ligand 1; NS, not significant. 50% is the cutoff point used to categorize PD-L1 expression into low and high expression groups.
NS, not significant. 10% is the cutoff point used to categorize CD8 expression into low and high infiltration groups.
PD-L1, programmed death-ligand 1; TILs, tumor-infiltrating lymphocytes; PFS, progression-free survival; OS, overall survival; SE, standard error; CI, confidence interval. 50% is the cutoff point used to categorize PD-L1 expression into low and high expression groups; 10% is the cutoff point used to categorize CD8 expression into low and high infiltration groups.
HR, hazard ratio; CI, confidence interval; PD-L1, programmed death-ligand 1. 50% is the cutoff point used to categorize PD-L1 expression into low and high expression groups; Significant; 10% is the cutoff point used to categorize CD8 expression into low and high infiltration groups.

 E-submission


