 E-submission
Articles
- Page Path
- HOME > J Pathol Transl Med > Volume 57(6); 2023 > Article
-
Original Article
Senescent tumor cells in colorectal cancer are characterized by elevated enzymatic activity of complexes 1 and 2 in oxidative phosphorylation -
Jun Sang Shin1,*
 , Tae-Gyu Kim2,*, Young Hwa Kim2,3, So Yeong Eom2, So Hyun Park2,3, Dong Hyun Lee3,4,5, Tae Jun Park3,4,5, Soon Sang Park3,4,5, Jang-Hee Kim2,3,5
 -
Journal of Pathology and Translational Medicine 2023;57(6):305-314.
DOI: https://doi.org/10.4132/jptm.2023.10.09
Published online: November 7, 2023
1Department of Surgery, Ajou University School of Medicine, Suwon, Korea
2Department of Pathology, Ajou University School of Medicine, Suwon, Korea
3Inflamm-Aging Translational Research Center, Ajou University Hospital, Suwon, Korea
4Department of Biochemistry and Molecular Biology, Ajou University School of Medicine, Suwon, Korea
5Department of Biomedical Sciences, Ajou University Graduate School of Medicine, Suwon, Korea
-
Corresponding Author: Soon Sang Park, MD, Department of Biochemistry and Molecular Biology, Ajou University School of Medicine, 206 World cup-ro, Yeongtong-gu, Suwon 16499, Korea Tel: +82-31-219-4443, Fax: +82-31-219-5059, E-mail: sspark9395@ajou.ac.kr
Corresponding Author: Jang-Hee Kim, MD, PhD, Department of Pathology, Ajou University School of Medicine, 206 World cup-ro, Yeongtong-gu, Suwon 16499, Korea Tel: +82-31-219-5925, Fax: +82-31-219-5934, E-mail: drjhk@ajou.ac.kr *These authors contributed equally to this work.
© 2023 The Korean Society of Pathologists/The Korean Society for Cytopathology
This is an Open Access article distributed under the terms of the Creative Commons Attribution Non-Commercial License (http://creativecommons.org/licenses/by-nc/4.0) which permits unrestricted non-commercial use, distribution, and reproduction in any medium, provided the original work is properly cited.
Abstract
-
Background
- Cellular senescence is defined as an irreversible cell cycle arrest caused by various internal and external insults. While the metabolic dysfunction of senescent cells in normal tissue is relatively well-established, there is a lack of information regarding the metabolic features of senescent tumor cells.
-
Methods
- Publicly available single-cell RNA-sequencing data from the GSE166555 and GSE178341 datasets were utilized to investigate the metabolic features of senescent tumor cells. To validate the single-cell RNA-sequencing data, we performed senescence-associated β-galactosidase (SA-β-Gal) staining to identify senescent tumor cells in fresh frozen colorectal cancer tissue. We also evaluated nicotinamide adenine dinucleotide dehydrogenase–tetrazolium reductase (NADH-TR) and succinate dehydrogenase (SDH) activity using enzyme histochemical methods and compared the staining with SA-β-Gal staining. MTT assay was performed to reveal the complex 1 activity of the respiratory chain in in-vitro senescence model.
-
Results
- Single-cell RNA-sequencing data revealed an upregulation in the activity of complexes 1 and 2 in oxidative phosphorylation, despite overall mitochondrial dysfunction in senescent tumor cells. Both SA-β-Gal and enzyme histochemical staining using fresh frozen colorectal cancer tissues indicated a high correlation between SA-β-Gal positivity and NADH-TR/SDH staining positivity. MTT assay showed that senescent colorectal cancer cells exhibit higher absorbance in 600 nm wavelength.
-
Conclusions
- Senescent tumor cells exhibit distinct metabolic features, characterized by upregulation of complexes 1 and 2 in the oxidative phosphorylation pathway. NADH-TR and SDH staining represent efficient methods for detecting senescent tumor cells in colorectal cancer.
- CRC sample preparation
- We obtained CRC tissue samples from pathological specimens of CRC patients who underwent surgery at Ajou University Hospital. An experienced pathologist sampled fresh tissues from both normal and tumor areas immediately after resection. We included patients who had not received chemotherapy or radiotherapy before surgery. Cases that failed to undergo any one of the three staining procedures for senescence and mitochondrial OXPHOS were previously excluded. Out of the 35 CRC cases, 28 met the inclusion criteria.
- Single-cell RNA-sequencing
- Publicly available CRC single-cell RNA-sequencing (scRNAseq) dataset, GSE166555 and GSE178341 were used for analysis [19,20]. Among patients, patient #8 and #C103 who markedly expressed CDKN2A was used for analysis to minimize the batch effect, respectively. CDKN2A– and CDKN2A+ cancer cells were analyzed and compared for further analysis. Detailed information about preprocessing steps and cancer cell extraction is described in our previous study [8].
- Senescence-associated β-galactosidase staining
- For senescence-associated β-galactosidase (SA-β-Gal) staining, representative fresh CRC tissue samples were immediately frozen at –20°C using a cryostat (Leica Biosystems, Nußloch, Germany) after being coated with OCT compound (Sakura Finetek, Torrance, CA, USA). Fresh frozen sections with a thickness of 6 μm were placed on slides. After fixation with phosphate buffer saline (PBS) buffer containing formaldehyde for 1 minute, the sections were incubated in a mixture containing 1 mg/mL of 5-bromo-4-chloro-3-indolyl-β-D-galactopyranoside (X-gal) (Bioneer, Daejeon, Korea), 40 mM citric acid/sodium phosphate buffer at pH 5.8, 5 mM potassium ferrocyanide, 5 mM potassium ferricyanide, 150 mM NaCl, and 2 mM MgCl2 at 37°C in an incubator for 14 hours. Following incubation, the slides were washed three times with PBS. Counterstaining was carried out with nuclear fast red solution at room temperature for approximately 5 minutes. After the counterstaining was complete, the slides were mounted using mounting solution (Sakura Finetek). All slides with SA-β-Gal staining were scanned at a minimum of 20× magnification using an Aperio AT2 slide scanner (Leica Biosystems).
- NADH-TR staining
- For NADH-TR staining, fresh frozen section slides were incubated in a mixture of nitro tetrazolium blue chloride solution (2 mg/mL NBT/0.05 M Tris buffer pH 7.6; Sigma-Aldrich, St. Louis, MO, USA) and reduced nicotinamide adenine dinucleotide solution (1.6 mg/mL; NADH/0.05 M Tris buffer pH 7.6; Sigma-Aldrich). The sections were then incubated at 37°C in an incubator for 2 hours. After incubation, the slides were washed three times with PBS and counterstained with nuclear fast red solution at room temperature for approximately 5 minutes. Once the counterstaining was complete, the slides were mounted using mounting solution (Sakura Finetek). All slides with NADH staining were scanned at a minimum of 20× magnification using an Aperio AT2 slide scanner (Leica Biosystems).
- SDH staining
- For SDH staining, fresh frozen section slides were incubated in a mixture containing 0.2 M phosphate buffer at pH 7.4, 0.1 M MgCl2, 0.2 M succinic acid (Sigma-Aldrich), and 2.4 mM nitro tetrazolium blue chloride (Sigma-Aldrich). The sections were incubated at 37°C in an incubator for 2 hours. After incubation, the slides were washed three times with PBS and counterstained with nuclear fast red solution at room temperature for approximately 5 minutes. Once the counterstaining was complete, the slides were mounted using mounting solution (Sakura Finetek). All slides with SDH staining were scanned at a minimum of 20× magnification using an Aperio AT2 slide scanner (Leica Biosystems).
- Evaluation of OXPHOS in CRC tissues
- To investigate senescent cells in CRC, we analyzed virtual slides of SA-β-Gal staining in CRC tissue sections. SA-β-Gal positivity was identified in cancer cells, stromal cells, and/or macrophages. We specifically assessed the percentages of SA-β-Gal positive cancer cell areas relative to the total cancer cell areas. For the analysis of OXPHOS in CRC, we examined virtual slides of NADH-TR and SDH staining in CRC tissue sections. We compared the intensity of purple-blue formazan pigments in cancer cells to that in normal epithelial cells or stromal cells and considered it positive if the intensity was similar or more intense. We also evaluated the percentages of positive cancer cell areas within the total cancer cell areas. Furthermore, we compared the patterns of positivity in SA-β-Gal, NADH-TR, and SDH staining in CRC tissue sections. We conducted further analysis to determine the association between the positivity of SA-β-Gal, NADH-TR, and SDH staining and clinicopathologic parameters of CRC patients.
- Cell culture and hydrogen peroxide treatment
- CRC cell lines SNU254 and SNU1544 were purchased from the Korean Cell Line Bank (KCLB, Seoul, Korea). The cells were maintained in RPMI supplemented with 10% fetal bovine serum. For the hydrogen peroxide treatment experiment, cells were treated with 100 μM and 200 μM H2O2/dimethyl sulfoxide solution. After treatment for the indicated times, cells were incubated at 37°C for 2 days. The cells were then washed with PBS buffer and subjected to measurement of hydrogen peroxide using live cell imaging microscopy.
- 3-(4,5-Dimethylthiazol-2-yl)-2,5-diphenyltetrazolium bromide (MTT) assay
- Control and hydrogen peroxide-treated SNU254 and SNU1544 cells were preincubated at a concentration of 1 × 10⁶ cells/mL in culture medium with 1 μg/mL actinomycin C1 for 3 hours at 37°C and 5% CO2. Cells were seeded at a concentration of 5 × 10⁴ cells/well in 100 μL culture medium containing 1 μg/mL actinomycin C1 into microplates. Cell cultures were incubated for 24 hours at 37°C with 5% CO2. After the incubation period, MTT labeling reagent (final concentration 0.5 mg/mL) was added to each well. The microplate was incubated for 4 hours in a humidified atmosphere. Solubilization solution was added into each well followed by overnight incubation in the incubator in a humidified atmosphere. Complete solubilization of the purple formazan crystals was checked and the absorbance of the samples was measured using a microplate reader. The wavelength to measure absorbance of the formazan product was 600 nm.
- Statistical analysis
- The statistical analysis was conducted using IBM SPSS ver. 25.0 (IBM Corp., Armonk, NY, USA). The Student independent t test or Fisher’s exact tests were used to analyze the parameters. A linear regression was performed in Prism 9 software (GraphPad Software, San Diego, CA, USA). A p-value of less than or equal to .05 was considered statistically significant. For adjusted p-values in gene set enrichment analysis (GSEA), the raw p-values were ranked in ascending order. The adjusted p-values are calculated for each gene set using the ranked raw p-values and the formula of the Benjamin-Hochberg procedure.
MATERIALS AND METHODS
- Metabolic features of senescent tumor cells
- To elucidate the metabolic features of senescent tumor cells, we employed scRNA-seq using the publicly available CRC dataset, GSE166555 [19]. To minimize the batch effect, we exclusively analyzed patients who exhibited marked expression of p16INK4A (CDKN2A), as described in our previous study. Among the 274 CDX2 and EPCAM double-positive cancer cells, 198 cells tested positive for CDKN2A, while 76 cells tested negative (Fig. 1A). To validate the senescence-related phenotype of CDKN2A-positive CRC cells, we conducted GSEA. GSEA clearly demonstrated that CDKN2A-positive cells exhibit senescent phenotypes (Fig. 1B). Numerous prior studies have already reported that mitochondrial dysfunction is a hallmark of senescence in primary cells from normal tissues [21-23]. However, it remains unknown in the context of senescent tumor cells. Similar to senescent cells from normal tissues, senescent tumor cells exhibit OXPHOS dysfunction (Fig. 1C). GSEA also revealed a significant upregulation of the electron transport from NADH to ubiquinone in senescent tumor cells (Fig. 1D). However, the electron transport from ubiquinol to cytochrome c was inhibited in senescent tumor cells (Fig. 1E). Furthermore, ATP synthesis was downregulated in senescent tumor cells (Fig. 1F). These findings were validated in another scRNA-seq dataset, GSE178341 (Supplementary Fig. S1) [20]. Therefore, it is highly suggested that the upregulation of complexes 1 and 2 of OXPHOS in senescent tumor cells is a result of a potential feedback loop caused by dysfunctions in the subsequent electron transport pathways (Fig. 1G).
- Patient characteristics according to the SA-β-Gal positivity
- To confirm the metabolic phenotype suggested by the scRNAseq results, we performed enzymatic histochemistry analysis using NADH-TR and SDH. NADH is a component of complex 1 of the electron transport chain, which is part of OXPHOS [24]. In contrast, SDH is a component of complex 2 of OXPHOS [24]. However, there was a challenge in performing p16INK4A immunostaining because it is typically performed on formalin-fixed paraffin-embedded (FFPE) CRC samples, while enzymatic histochemistry can only be conducted on fresh or frozen tissues. To address this issue, we employed SA-β-Gal staining, another standard senescence marker that can be utilized in frozen tissues. Previously, we had confirmed the correlation between p16INK4A and SA-β-Gal staining in CRC cells [7,8]. Therefore, following analysis was performed based on the SA-β-Gal staining rather than immunostaining. A wide variation in the number of SA-β-Gal– positive cells were observed among CRC samples. These cells were distributed not only in the cancerous epithelium but occasionally in the normal epithelium (Supplementary Fig. S2), but also in stromal fibroblasts, and macrophages [2,7]. In this study, SA-β-Gal–positive malignant epithelial cells were exclusively examined to analyze the traits of senescent tumor cells in each CRC sample. The proportion of SA-β-Gal staining ranged from less than 1% to more than 90% across the CRC cases. We divided the CRC samples into two groups based on the proportion of SA-β-Gal–positive cancer cells: a low SA-β-Gal group (less than 30%) and a high SA-β-Gal group (more than 30%). The clinicopathologic characteristics of patients according to the SA-β-Gal group were shown in Table 1. We did not find any significant associations between clinicopathologic characteristics and the low or high SA-β-Gal–positive groups.
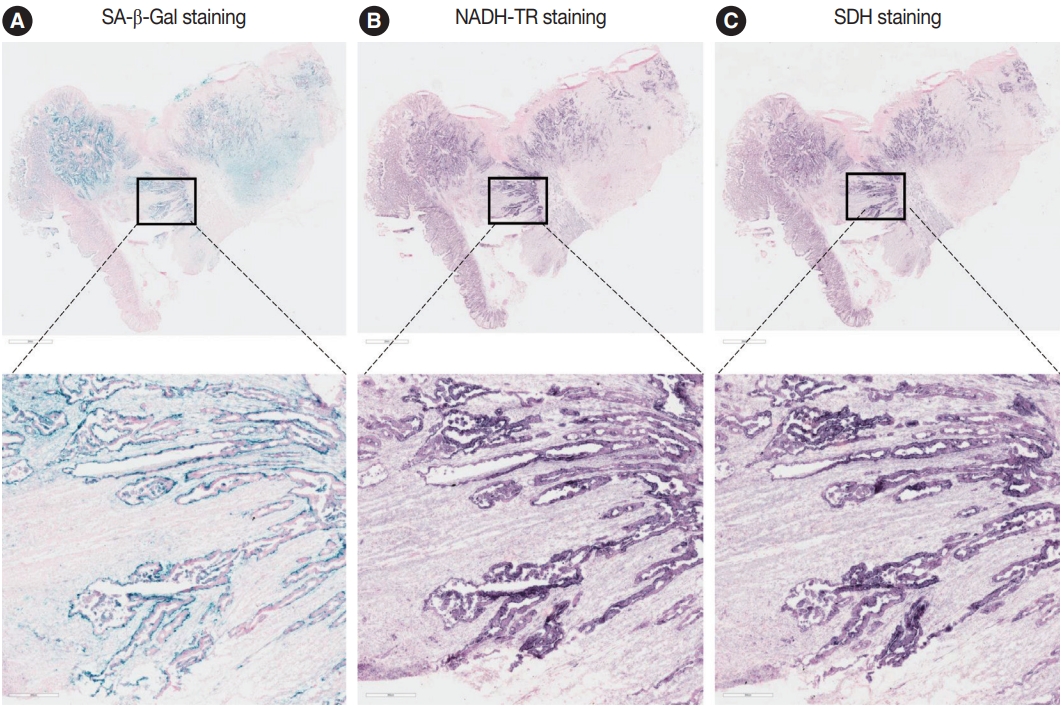
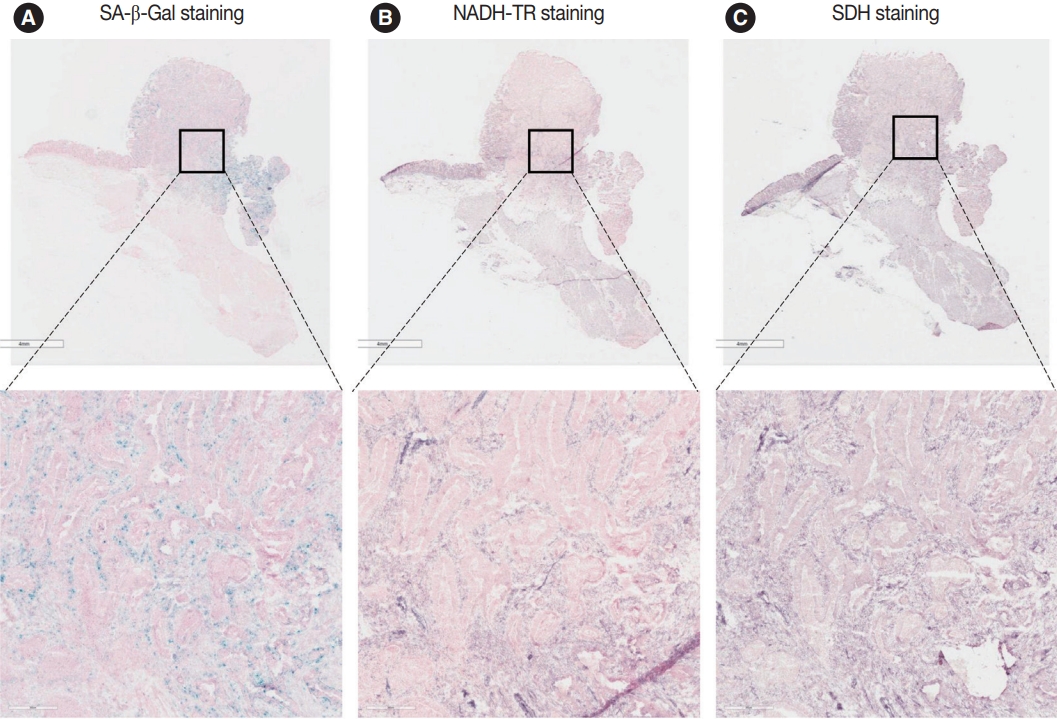
- NADH-TR and SDH staining in senescent tumor cells in vivo
- To assess the OXPHOS activity in senescent tumor cells, we conducted NADH-TR staining (Supplementary Fig. S3) and SDH staining (Supplementary Fig. S4) on consecutive fresh frozen CRC tissue sections. Additionally, we performed SA-β-Gal staining and enzymatic histochemical analysis on serial sections of frozen tissues. Our findings revealed a consistent correlation between SA-β-Gal staining and both NADH-TR and SDH staining. The intensity of NADH-TR and SDH staining was found to be higher in cancer tissues with high SA-β-Gal activity (Fig. 2). Conversely, cancer tissues with low SA-β-Gal activity exhibited lower NADH-TR and SDH staining intensity (Fig. 3). A linear regression analysis clearly showed that there is a positive correlation between SA-β-Gal and NADH-TR/SDH staining (Fig. 4), suggesting that complex 1 and 2 activities of OXPHOS in senescent tumor cells are upregulated despite of the mitochondrial dysfunctions.
- MTT assay in control and senescent tumor cells in vitro
- MTT is a widely used method for assessing the viability of cultured cells [25]. Additionally, MTT can be utilized to evaluate mitochondrial function. MTT is reduced to formazan, which strongly absorbs light in the visible range and has low solubility in water [26]. Notably, MTT can be directly reduced by complex I of the respiratory chain, providing a measure of complex I activity in the mitochondria [26]. To assess the complex I activity of senescent tumor cells in vitro, senescence in CRC cell lines SNU1544 and SNU254 was induced by hydrogen peroxide treatment, confirmed by SA-β-Gal staining (Supplementary Fig. S5A). The mRNA levels of representative SASPs were assessed, and SASPs were found to be increased in hydrogen peroxidetreated cancer cells (Supplementary Fig. S5B). MTT assays revealed an upregulation of complex I activity in senescent tumor cells in vitro (Supplementary Fig. S5C), which is consistent with in vivo findings.
RESULTS
- Cancer cells, owing to their rapid proliferation rate and heightened metabolic activity, employ distinctive energy production mechanisms to meet their energy requirements [27]. Warburg originally observed the phenomenon of markedly increased glucose uptake in cancer cells, now widely recognized as the ‘Warburg effect’ [28,29]. Although Warburg suggested that elevated glycolysis in cancer cells resulted from mitochondrial defects [29], recent studies have shown that the mitochondrial pathway in cancer cells may still be partially functional and contribute to energy production [30]. Consequently, mitochondrial metabolism remains an attractive target for cancer therapy, with numerous investigations exploring this avenue [31,32]. Nevertheless, a notable challenge in the development of agents targeting mitochondrial metabolism is the resemblance between the metabolic processes of cancer cells and cytotoxic T cells [32-34]. The use of these agents to target cancer cells may inadvertently lead to the elimination of cancer-fighting cytotoxic T cells, potentially exacerbating a prognosis [30,32]. Therefore, the pursuit of metabolism-targeting agents specific to cancer cells represents an emerging frontier in cancer treatment.
- Research into cancer metabolism has made significant progress in understanding non-senescent tumor cells [30]. However, the metabolic characteristics of senescent tumor cells remain less clear. Cellular senescence is widely recognized to be closely associated with mitochondrial dysfunction [35]. Although there is ongoing debate about whether cellular senescence induces mitochondrial dysfunction [36] or vice versa [37], it is evident that there is a positive correlation between cellular senescence and mitochondrial dysfunction [38]. Indeed, mitochondrial dysfunction has been observed in various cellular senescence models. Nelson and colleagues demonstrated a link between replicative senescence and mitochondrial dysfunction [39]. Moiseeva and colleagues reported a correlation between OIS and mitochondrial dysfunction [23]. Furthermore, Yoon et al. [21] revealed that the induction of senescence through iron chelation resulted in a reduction in complex 2 activity, preceding the onset of p27kip1-mediated cell cycle arrest in both Chang and normal liver cells. Likewise, senescence induced by transforming growth factor β1 in Mv1Lu lung epithelial cells involved the inhibition of complex 4, leading to the generation of mitochondrial reactive oxygen species [22]. To the best of our knowledge, this is the first study to analyze the metabolic features of senescent cancer cells in CRC. In our results, senescent tumor cells exhibited relatively more significant defects in OXPHOS compared to non-senescent tumor cells, as indicated by impaired electron transport to cytochrome c and reduced ATP production. This is the same line with the various studies based on multiple senescence models using normal cells [21-23]. However, intriguingly, there was a notable upregulation in the activity of electron transport from NADH to ubiquinone, a function typically associated with complex 1 [24]. While further direct evidence is required, these data suggest that electron transport from ubiquinone to complex 3 may be compromised in senescent tumor cells, leading to an upregulation in the gene expression of complex 1 and 2 as part of a potential feedback loop.
- NADH-TR and SDH staining are enzyme histochemical methods that are widely used to examine the oxidative activity of cells, particularly in muscle biopsy. These stains can reveal the oxidative capacity of muscle fibers and their architectural changes in some muscle disorders. NADH and SDH are components of complex 1 and 2 of the electron transport chain, respectively. By visualizing the activity of these enzymes, NADH-TR and SDH staining can provide valuable insights into the metabolic state of cells [40]. In addition to diagnosing muscle disorders, these methods can be applied to screen the OXPHOS status of cancer cells as well as senescent cells. OXPHOS is an important metabolic process not only in cells that drive cancer drug resistance [41], but also in senescent cells associated with the aging process [9]. Therefore, NADH-TR and SDH staining can be used to identify the metabolic state of these cells and provide insights into their response to anticancer therapy or anti-aging therapy.
- While cellular senescence in cancer cells has traditionally been considered a defense mechanism against cancer progression [42], recent studies have revealed that senescent tumor cells can actually promote cancer progression by influencing the tumor microenvironment [5-7]. In fact, senescent tumor cells themselves exhibit a higher invasion ability due to the secretion of various extracellular matrix-modulating proteins, such as matrix metalloproteinases [2]. As a result, senescent tumor cells are often located at the invasive front of the cancer tissue rather than its center [5,7]. Moreover, the reversal of the halted proliferation of senescent tumor cells may be associated with cancer relapse in distant metastatic organs. Therefore, the detection of senescent tumor cells is crucial for predicting patient prognosis and potential cancer relapse in the near future. However, there are limited methods available for the detection of senescent tumor cells. Furthermore, many markers for cellular senescence are tumor suppressor genes, such as p53, p21Waf1, and p16INK4A [2,43]. Consequently, they have a higher mutation rate, which can result in the overexpression of malfunctioning proteins due to potential feedback loops [2,44,45]. To overcome this challenge, additional senescence markers, such as a decrease in lamin B1 or detection of H3K9-trimethylation, are utilized [46]. In our experience, the staining of multiple senescence markers using serial sections, combined with CDK inhibitors, and accessory senescence markers are essential to minimize false-positive results when detecting senescent tumor cells in FFPE tissues [2]. While SA-β-Gal is considered a reliable marker for detecting senescent tumor cells in fresh or frozen CRC tissues [47], it often produces false positives due to its inherent β-galactosidase activity [48]. In our study, we found that enzymatic histochemistry using NADH-TR and SDH staining can effectively identify senescent tumor cells in CRC. Therefore, utilizing NADH-TR and SDH staining in conjunction with SA-β-Gal staining, using serial sections, represents a valuable approach to reduce the risk of false positivity associated with SA-β-Gal staining alone.
- There are several limitations in this study. Firstly, the results mainly rely on scRNA-seq, enzyme histochemistry analysis, and in vitro MTT assay, which provide relatively indirect evidence compared to various mitochondrial supercomplex assays [39]. Therefore, to confirm the specific dysfunction of the mitochondrial electron transport system, various assays from complex 1 to 4 should be conducted, which will be part of our future studies. Enzyme histochemistry along with functional assays for electron transport complexes may address overall efficiency of the electron transport and OXPHOS system. However, despite similar results in different scRNA-seq datasets in our study consistently indicating that complex 1 and 2 are functionally upregulated in senescent tumor cells [19,20], the reasons for this phenomenon remain unknown. Secondly, the number of patients analyzed in this study was relatively small. Therefore, a larger number of patients will be needed to strengthen the results.
DISCUSSION
Supplementary Information
Supplementary Fig. S1.
Supplementary Fig. S2.
Supplementary Fig. S3.
Supplementary Fig. S4.
Supplementary Fig. S5.
Ethics Statement
This study was approved by the Institutional Review Board of Ajou University Hospital (AJIRB-BMR-OBS-16-218). All patients provided informed consent.
Availability of Data and Material
The datasets generated or analyzed during the current study are available in the Gene expression Omnibus (GEO) repository from National Center for Biotechnology Information (NCBI) with accesion number GSE166555 and GSE178341. Persistent weblinks are https://www.ncbi.nlm.nih.gov/geo/query/acc.cgi?acc=GSE166555 and https://www.ncbi.nlm.nih.gov/geo/query/acc.cgi?acc=GSE178341.
Code Availability
Not applicable.
Author contributions
Conceptualization: JSS, JHK. Data curation: SSP, SHP, JHK. Formal analysis: JSS, SSP, YHK, TGK, SYE, DHL, SHP, TJP, JHK. Funding acquisition: SSP, JHK. Investigation: JSS, SSP, JHK. Methodology: JSS, SSP, YHK, SHP, TGK, JHK. Project administration: JHK. Resources: JSS, JHK. Software: SSP. Supervision: TJP, JHK. Validation: SSP, JHK. Visualization: SSP, SHP, JHK. Writing—original draft: JSS, TGK, SSP, JHK. Approval of final manuscript: all authors.
Conflicts of Interest
J.H.K., a contributing editor of the Journal of Pathology and Translational Medicine, was not involved in the editorial evaluation or decision to publish this article. All remaining authors have declared no conflicts of interest.
Funding Statement
National Research Foundation of Korea, NRF-2016R1D1A1B02010452 (J-HK).
Korea Health Industry Development Institute (KHIDI), a grant of the MD-PhD/Medical Scientist Training Program; Funding number is not applicable (SSP).
Ajou University Hospital, a grant of the MD-PhD/Medical Scientist Training Program; Funding number is not applicable (SSP).


| SA-β-Gallow (n = 13) | SA-β-Galhigh (n = 15) | p-value | ||
|---|---|---|---|---|
| Age (yr) | 65.7 (43–81) | 64.3 (43–89) | .770a | |
| Male sex | 6 (46.2) | 8 (53.3) | .705b | |
| Left side tumor | 9 (69.2) | 8 (53.3) | .390b | |
| Tumor size (cm) | 4.9 | 5.5 | .420 | |
| SA-β-Gal (%) | 24.3 (1–30) | 70.7 (40–90) | < .01a | |
| T staging | .412b | |||
| pT1 | 0 | 1 (6.3) | ||
| pT2 | 1 (8.3) | 0 | ||
| pT3 | 11 (83.3) | 11 (75) | ||
| pT4 | 1 (8.3) | 3 (18.8) | ||
| N staging | .800b | |||
| pN0 | 5 (38.4) | 7 (46.7) | ||
| pN1 | 4 (30.8) | 3 (20.0) | ||
| pN2 | 4 (30.8) | 5 (33.3) | ||
| M staging | .916b | |||
| M0 | 12 (92.3) | 14 (93.3) | ||
| M1 | 1 (7.7) | 1 (6.7) | ||
| Tumor differentiation | .650 | |||
| Well | 1 (7.7) | 3 (20.0) | ||
| Moderate | 11 (84.6) | 11 (73.3) | ||
| Poor | 1 (7.7) | 1 (6.7) | ||
| KRAS mutation | 7 (53.8) | 8 (53.3) | .978b | |
| NRAS mutation | 0 | 0 | > .99b | |
| Microsatellite stability | .343b | |||
| MSI-L–MSS | 13 (100) | 14 (93.3) | ||
| MSI-high | 0 | 1 (6.7) | ||
Values are presented as mean (range) or number (%).
CRC, colorectal cancer; SA-β-Gal, senescence-associated β-galactosidase; MSI, microsatellite instability; MSI-L, low microsatellite instability; MSS, microsatellite stable.
ap-value is obtained using Student’s t test;
bp-value is obtained using chisquare test.
- 1. Hayflick L, Moorhead PS. The serial cultivation of human diploid cell strains. Exp Cell Res 1961; 25: 585-621. ArticlePubMed
- 2. Park SS, Choi YW, Kim JH, Kim HS, Park TJ. Senescent tumor cells: an overlooked adversary in the battle against cancer. Exp Mol Med 2021; 53: 1834-41. ArticlePubMedPMCPDF
- 3. Munoz-Espin D, Serrano M. Cellular senescence: from physiology to pathology. Nat Rev Mol Cell Biol 2014; 15: 482-96. ArticlePubMedPDF
- 4. Bartkova J, Rezaei N, Liontos M, et al. Oncogene-induced senescence is part of the tumorigenesis barrier imposed by DNA damage checkpoints. Nature 2006; 444: 633-7. PubMed
- 5. Kim YH, Choi YW, Lee J, Soh EY, Kim JH, Park TJ. Senescent tumor cells lead the collective invasion in thyroid cancer. Nat Commun 2017; 8: 15208.ArticlePubMedPMCPDF
- 6. Salam R, Saliou A, Bielle F, et al. Cellular senescence in malignant cells promotes tumor progression in mouse and patient Glioblastoma. Nat Commun 2023; 14: 441.ArticlePubMedPMCPDF
- 7. Choi YW, Kim YH, Oh SY, et al. Senescent tumor cells build a cytokine shield in colorectal cancer. Adv Sci (Weinh) 2021; 8: 2002497.ArticlePubMedPMCPDF
- 8. Park SS, Lee YK, Park SH, et al. p15(INK4B) is an alternative marker of senescent tumor cells in colorectal cancer. Heliyon 2023; 9: e13170.ArticlePubMedPMC
- 9. Wiley CD, Campisi J. The metabolic roots of senescence: mechanisms and opportunities for intervention. Nat Metab 2021; 3: 1290-301. ArticlePubMedPMCPDF
- 10. Wiley CD, Campisi J. From ancient pathways to aging cells-connecting metabolism and cellular senescence. Cell Metab 2016; 23: 1013-21. ArticlePubMedPMC
- 11. Faget DV, Ren Q, Stewart SA. Unmasking senescence: context-dependent effects of SASP in cancer. Nat Rev Cancer 2019; 19: 439-53. ArticlePubMedPDF
- 12. Miwa S, Kashyap S, Chini E, von Zglinicki T. Mitochondrial dysfunction in cell senescence and aging. J Clin Invest 2022; 132: e158447.ArticlePubMedPMC
- 13. James EL, Michalek RD, Pitiyage GN, et al. Senescent human fibroblasts show increased glycolysis and redox homeostasis with extracellular metabolomes that overlap with those of irreparable DNA damage, aging, and disease. J Proteome Res 2015; 14: 1854-71. ArticlePubMed
- 14. Ashton TM, McKenna WG, Kunz-Schughart LA, Higgins GS. Oxidative phosphorylation as an emerging target in cancer therapy. Clin Cancer Res 2018; 24: 2482-90. ArticlePubMedPDF
- 15. Kumar PR, Moore JA, Bowles KM, Rushworth SA, Moncrieff MD. Mitochondrial oxidative phosphorylation in cutaneous melanoma. Br J Cancer 2021; 124: 115-23. ArticlePubMedPMCPDF
- 16. LeBleu VS, O’Connell JT, Gonzalez Herrera KN, et al. PGC-1alpha mediates mitochondrial biogenesis and oxidative phosphorylation in cancer cells to promote metastasis. Nat Cell Biol 2014; 16: 992-1003. ArticlePubMedPMCPDF
- 17. Vellinga TT, Borovski T, de Boer VC, et al. SIRT1/PGC1alpha-dependent increase in oxidative phosphorylation supports chemotherapy resistance of colon cancer. Clin Cancer Res 2015; 21: 2870-9. PubMed
- 18. Wang Y, Nasiri AR, Damsky WE, et al. Uncoupling hepatic oxidative phosphorylation reduces tumor growth in two murine models of colon cancer. Cell Rep 2018; 24: 47-55. ArticlePubMedPMC
- 19. Uhlitz F, Bischoff P, Peidli S, et al. Mitogen-activated protein kinase activity drives cell trajectories in colorectal cancer. EMBO Mol Med 2021; 13: e14123.ArticlePubMedPMCPDF
- 20. Pelka K, Hofree M, Chen JH, et al. Spatially organized multicellular immune hubs in human colorectal cancer. Cell 2021; 184: 4734-52. PubMedPMC
- 21. Yoon YS, Byun HO, Cho H, Kim BK, Yoon G. Complex II defect via down-regulation of iron-sulfur subunit induces mitochondrial dysfunction and cell cycle delay in iron chelation-induced senescence-associated growth arrest. J Biol Chem 2003; 278: 51577-86. ArticlePubMed
- 22. Yoon YS, Lee JH, Hwang SC, Choi KS, Yoon G. TGF beta1 induces prolonged mitochondrial ROS generation through decreased complex IV activity with senescent arrest in Mv1Lu cells. Oncogene 2005; 24: 1895-903. ArticlePubMedPDF
- 23. Moiseeva O, Bourdeau V, Roux A, Deschenes-Simard X, Ferbeyre G. Mitochondrial dysfunction contributes to oncogene-induced senescence. Mol Cell Biol 2009; 29: 4495-507. ArticlePubMedPMCPDF
- 24. Yagi T, Matsuno-Yagi A. The proton-translocating NADH-quinone oxidoreductase in the respiratory chain: the secret unlocked. Biochemistry 2003; 42: 2266-74. ArticlePubMed
- 25. Kumar P, Nagarajan A, Uchil PD. Analysis of cell viability by the MTT assay. Cold Spring Harb Protoc 2018 Jun 1 [Epub]. https://doi.org/10.1101/pdb.prot095505. Article
- 26. Surin AM, Sharipov RR, Krasil’nikova IA, et al. Disruption of functional activity of mitochondria during MTT assay of viability of cultured neurons. Biochemistry (Mosc) 2017; 82: 737-49. ArticlePubMedPDF
- 27. Deberardinis RJ, Sayed N, Ditsworth D, Thompson CB. Brick by brick: metabolism and tumor cell growth. Curr Opin Genet Dev 2008; 18: 54-61. ArticlePubMedPMC
- 28. Liberti MV, Locasale JW. The Warburg effect: how does it benefit cancer cells? Trends Biochem Sci 2016; 41: 211-8. ArticlePubMedPMC
- 29. Warburg O. On respiratory impairment in cancer cells. Science 1956; 124: 269-70. ArticlePubMed
- 30. Zheng J. Energy metabolism of cancer: Glycolysis versus oxidative phosphorylation (Review). Oncol Lett 2012; 4: 1151-7. ArticlePubMedPMC
- 31. Vasan K, Werner M, Chandel NS. Mitochondrial metabolism as a target for cancer therapy. Cell Metab 2020; 32: 341-52. ArticlePubMedPMC
- 32. Porporato PE, Filigheddu N, Pedro JM, Kroemer G, Galluzzi L. Mitochondrial metabolism and cancer. Cell Res 2018; 28: 265-80. ArticlePubMedPDF
- 33. Galluzzi L, Kepp O, Vander Heiden MG, Kroemer G. Metabolic targets for cancer therapy. Nat Rev Drug Discov 2013; 12: 829-46. ArticlePubMedPDF
- 34. Allison KE, Coomber BL, Bridle BW. Metabolic reprogramming in the tumour microenvironment: a hallmark shared by cancer cells and T lymphocytes. Immunology 2017; 152: 175-84. ArticlePubMedPMCPDF
- 35. Chapman J, Fielder E, Passos JF. Mitochondrial dysfunction and cell senescence: deciphering a complex relationship. FEBS Lett 2019; 593: 1566-79. ArticlePubMedPDF
- 36. Sahin E, Colla S, Liesa M, et al. Telomere dysfunction induces metabolic and mitochondrial compromise. Nature 2011; 470: 359-65. PubMedPMC
- 37. Wiley CD, Velarde MC, Lecot P, et al. Mitochondrial dysfunction induces senescence with a distinct secretory phenotype. Cell Metab 2016; 23: 303-14. ArticlePubMedPMC
- 38. Martini H, Passos JF. Cellular senescence: all roads lead to mitochondria. FEBS J 2023; 290: 1186-202. ArticlePubMedPDF
- 39. Nelson G, Kucheryavenko O, Wordsworth J, von Zglinicki T. The senescent bystander effect is caused by ROS-activated NF-kappaB signalling. Mech Ageing Dev 2018; 170: 30-6. PubMedPMC
- 40. Joyce NC, Oskarsson B, Jin LW. Muscle biopsy evaluation in neuromuscular disorders. Phys Med Rehabil Clin N Am 2012; 23: 609-31. ArticlePubMedPMC
- 41. Zhao Z, Mei Y, Wang Z, He W. The effect of oxidative phosphorylation on cancer drug resistance. Cancers (Basel) 2022; 15: 62.ArticlePubMedPMC
- 42. Collado M, Blasco MA, Serrano M. Cellular senescence in cancer and aging. Cell 2007; 130: 223-33. ArticlePubMed
- 43. Haferkamp S, Tran SL, Becker TM, Scurr LL, Kefford RF, Rizos H. The relative contributions of the p53 and pRb pathways in oncogene-induced melanocyte senescence. Aging (Albany NY) 2009; 1: 542-56. ArticlePubMedPMC
- 44. Heinzel PA, Balaram P, Bernard HU. Mutations and polymorphisms in the p53, p21 and p16 genes in oral carcinomas of Indian betel quid chewers. Int J Cancer 1996; 68: 420-3. ArticlePubMed
- 45. Soto Martinez JL, Cabrera Morales CM, Serrano Ortega S, Lopez-Nevot MA. Mutation and homozygous deletion analyses of genes that control the G1/S transition of the cell cycle in skin melanoma: p53, p21, p16 and p15. Clin Transl Oncol 2005; 7: 156-64. ArticlePubMedPDF
- 46. Sadaie M, Salama R, Carroll T, et al. Redistribution of the Lamin B1 genomic binding profile affects rearrangement of heterochromatic domains and SAHF formation during senescence. Genes Dev 2013; 27: 1800-8. ArticlePubMedPMC
- 47. Itahana K, Campisi J, Dimri GP. Methods to detect biomarkers of cellular senescence: the senescence-associated beta-galactosidase assay. Methods Mol Biol 2007; 371: 21-31. PubMed
- 48. Krishna DR, Sperker B, Fritz P, Klotz U. Does pH 6 beta-galactosidase activity indicate cell senescence? Mech Ageing Dev 1999; 109: 113-23. PubMed
REFERENCES
Figure & Data
References
Citations
- Multifacet Roles of Cellular Senescence in Cancer: Mechanisms and Therapeutic Implications
Huajie Mao, Wanning Liu, Yuanyuan Su, Yuxuan Ma, Xiaodi Zhao, Yuanyuan Lu
MedComm – Oncology.2026;[Epub] CrossRef - Senescence, Aging and Disease Throughout the Gastrointestinal System
Sofia Ferreira-Gonzalez, Tomonori Matsumoto, Eiji Hara, Stuart J. Forbes
Gastroenterology.2025; 169(7): 1357. CrossRef - Cellular Aging and Senescence in Cancer: A Holistic Review of Cellular Fate Determinants
Muhammad Tufail, Yu-Qi Huang, Jia-Ju Hu, Jie Liang, Cai-Yun He, Wen-Dong Wan, Can-Hua Jiang, Hong Wu, Ning Li
Aging and disease.2024;[Epub] CrossRef - Real-time assessment of relative mitochondrial ATP synthesis response against inhibiting and stimulating substrates (MitoRAISE)
Eun Sol Chang, Kyoung Song, Ji-Young Song, Minjung Sung, Mi-Sook Lee, Jung Han Oh, Ji-Yeon Kim, Yeon Hee Park, Kyungsoo Jung, Yoon-La Choi
Cancer & Metabolism.2024;[Epub] CrossRef
 PubReader
 ePub Link
-
 Cite this Article
- Cite this Article
-
- Close
- Download Citation
- Close
- Figure
-
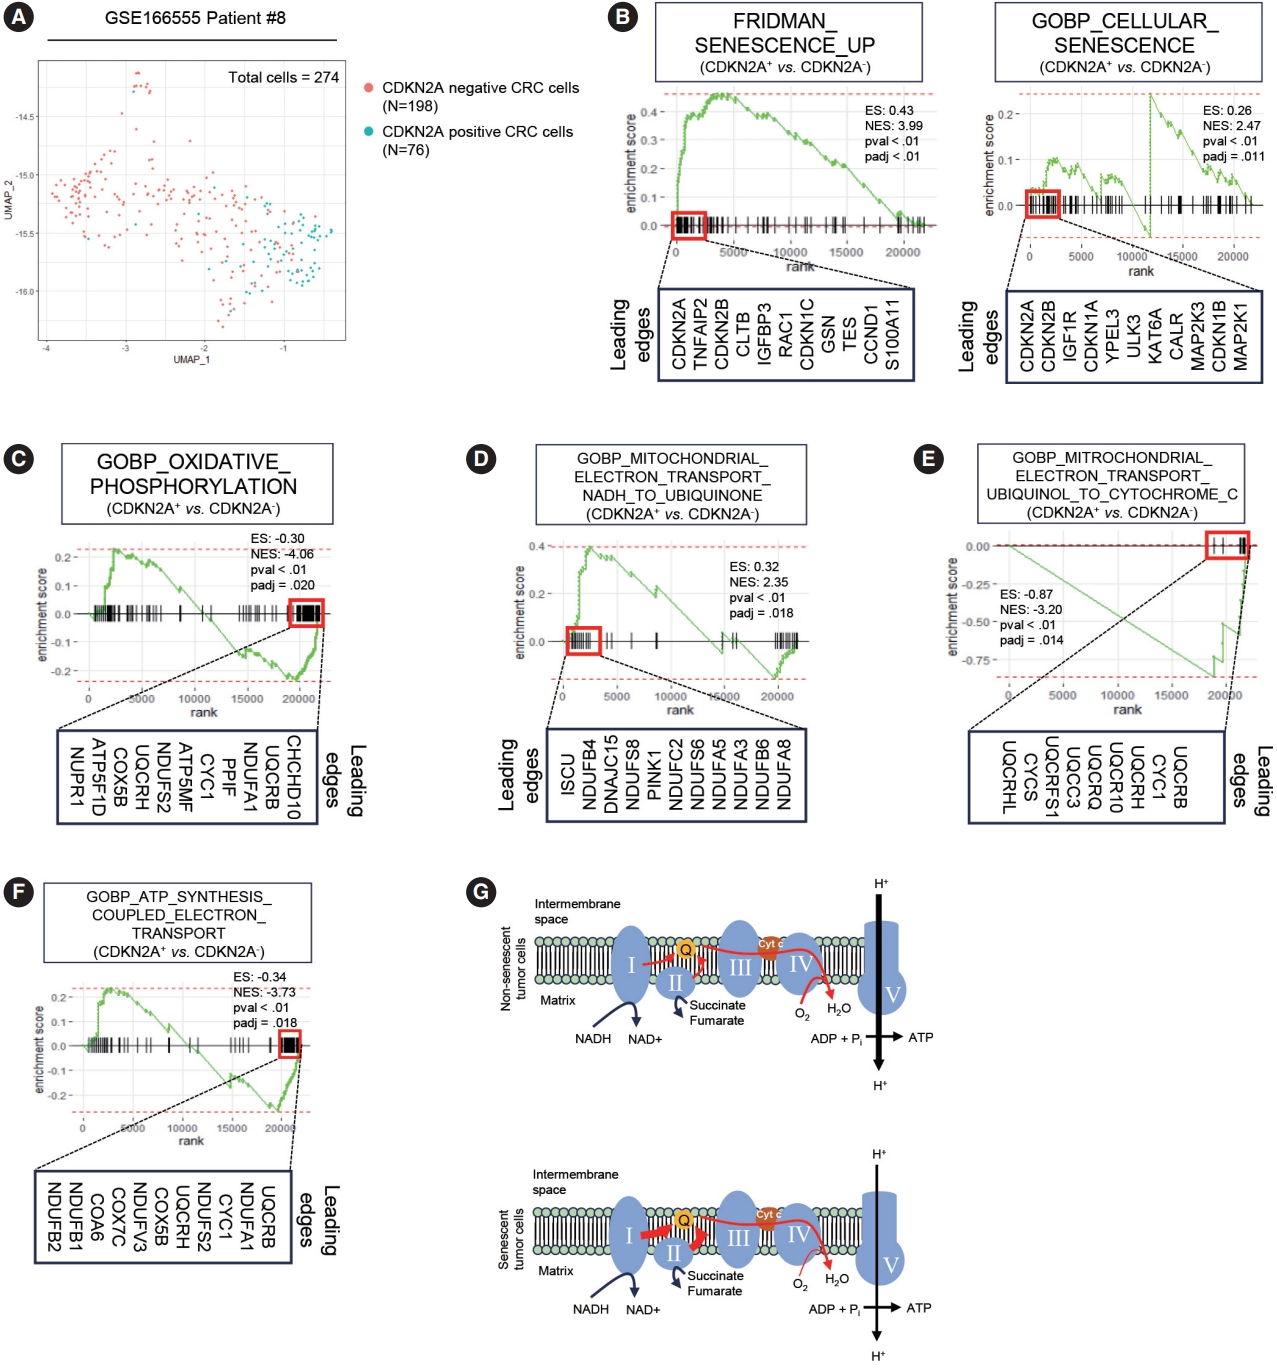


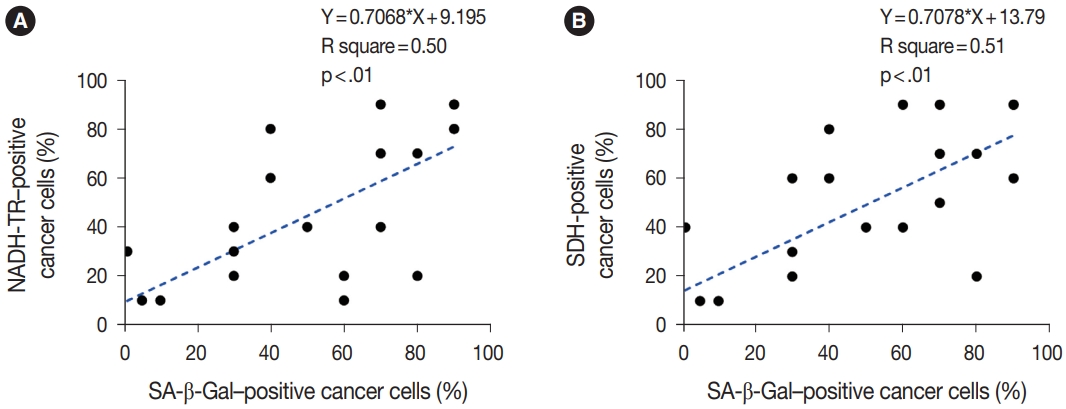


Fig. 1.
Fig. 2.
Fig. 3.
Fig. 4.
| SA-β-Gallow (n = 13) | SA-β-Galhigh (n = 15) | p-value | ||
|---|---|---|---|---|
| Age (yr) | 65.7 (43–81) | 64.3 (43–89) | .770 |
|
| Male sex | 6 (46.2) | 8 (53.3) | .705 |
|
| Left side tumor | 9 (69.2) | 8 (53.3) | .390 |
|
| Tumor size (cm) | 4.9 | 5.5 | .420 | |
| SA-β-Gal (%) | 24.3 (1–30) | 70.7 (40–90) | < .01 |
|
| T staging | .412 |
|||
| pT1 | 0 | 1 (6.3) | ||
| pT2 | 1 (8.3) | 0 | ||
| pT3 | 11 (83.3) | 11 (75) | ||
| pT4 | 1 (8.3) | 3 (18.8) | ||
| N staging | .800 |
|||
| pN0 | 5 (38.4) | 7 (46.7) | ||
| pN1 | 4 (30.8) | 3 (20.0) | ||
| pN2 | 4 (30.8) | 5 (33.3) | ||
| M staging | .916 |
|||
| M0 | 12 (92.3) | 14 (93.3) | ||
| M1 | 1 (7.7) | 1 (6.7) | ||
| Tumor differentiation | .650 | |||
| Well | 1 (7.7) | 3 (20.0) | ||
| Moderate | 11 (84.6) | 11 (73.3) | ||
| Poor | 1 (7.7) | 1 (6.7) | ||
| KRAS mutation | 7 (53.8) | 8 (53.3) | .978 |
|
| NRAS mutation | 0 | 0 | > .99 |
|
| Microsatellite stability | .343 |
|||
| MSI-L–MSS | 13 (100) | 14 (93.3) | ||
| MSI-high | 0 | 1 (6.7) | ||
Values are presented as mean (range) or number (%). CRC, colorectal cancer; SA-β-Gal, senescence-associated β-galactosidase; MSI, microsatellite instability; MSI-L, low microsatellite instability; MSS, microsatellite stable. p-value is obtained using Student’s t test; p-value is obtained using chisquare test.

