 E-submission
Articles
- Page Path
- HOME > J Pathol Transl Med > Volume 59(2); 2025 > Article
-
Original Article
Categorizing high-grade serous ovarian carcinoma into clinically relevant subgroups using deep learning–based histomic clusters -
Byungsoo Ahn
 , Eunhyang Park
 -
Journal of Pathology and Translational Medicine 2025;59(2):91-104.
DOI: https://doi.org/10.4132/jptm.2024.10.23
Published online: February 18, 2025
Department of Pathology, Severance Hospital, Yonsei University College of Medicine, Seoul, Korea
- Corresponding Author: Eunhyang Park, MD, PhD Department of Pathology, Severance Hospital, Yonsei University College of Medicine, 50-1 Yonsei-ro, Seodaemun-gu, Seoul 03722, Korea Tel: +82-2-2228-1793, Fax: +82-2-362-0860, E-mail: epark54@yuhs.ac
© The Korean Society of Pathologists/The Korean Society for Cytopathology
This is an Open Access article distributed under the terms of the Creative Commons Attribution Non-Commercial License (http://creativecommons.org/licenses/by-nc/4.0) which permits unrestricted non-commercial use, distribution, and reproduction in any medium, provided the original work is properly cited.
Abstract
-
Background
- High-grade serous ovarian carcinoma (HGSC) exhibits significant heterogeneity, posing challenges for effective clinical categorization. Understanding the histomorphological diversity within HGSC could lead to improved prognostic stratification and personalized treatment approaches.
-
Methods
- We applied the Histomic Atlases of Variation Of Cancers model to whole slide images from The Cancer Genome Atlas dataset for ovarian cancer. Histologically distinct tumor clones were grouped into common histomic clusters. Principal component analysis and K-means clustering classified HGSC samples into three groups: highly differentiated (HD), intermediately differentiated (ID), and lowly differentiated (LD).
-
Results
- HD tumors showed diverse patterns, lower densities, and stronger eosin staining. ID tumors had intermediate densities and balanced staining, while LD tumors were dense, patternless, and strongly hematoxylin-stained. RNA sequencing revealed distinct patterns in mitochondrial oxidative phosphorylation and energy metabolism, with upregulation in the HD, downregulation in the LD, and the ID positioned in between. Survival analysis showed significantly lower overall survival for the LD compared to the HD and ID, underscoring the critical role of mitochondrial dynamics and energy metabolism in HGSC progression.
-
Conclusions
- Deep learning-based histologic analysis effectively stratifies HGSC into clinically relevant prognostic groups, highlighting the role of mitochondrial dynamics and energy metabolism in disease progression. This method offers a novel approach to HGSC categorization.
- High-grade serous ovarian carcinoma (HGSC) is the most aggressive and prevalent form of ovarian cancer, accounting for approximately 70%–80% of ovarian cancer deaths worldwide [1]. Despite intensive treatment including cytoreduction surgery, platinum-based chemotherapy and emerging targeted therapies, most patients experience recurrence, with a median progression-free survival of 13.8 months for those at stage III–IV [2]. Although numerous genomic, transcriptomic, and proteomic biomarkers have been proposed, none have been adopted into standard clinical practice. Determining treatment sensitivity or resistance requires several treatment cycles, which expose patients to potentially unnecessary adverse events [3,4]. The challenge arises from the significant inter- and intratumoral heterogeneity of HGSC, which poses a major obstacle to stratifying and classifying HGSC patients [5]. Currently, there is no World Health Organization recommended effective histological subclassification for HGSC.
- While several tools exist to categorize HGSC, the most widely accepted classification is based on four molecular subtypes derived from The Cancer Genome Atlas (TCGA): immunoreactive, differentiated, proliferative, and mesenchymal [6]. Previous studies reported that the mesenchymal or proliferative subtypes tend to have worse overall survival, whereas the immunoreactive patterns often have a more favorable prognosis [7,8]. However, molecular genetic testing is expensive and time-consuming, limiting its application to clinical practice.
- Additionally, attempts to categorize HGSC into histological subtypes based on the molecular classifications have been hindered by poor interobserver agreement, limiting the clinical applicability [9,10]. However, recent advances in digital pathology have enabled new efforts to stratify HGSC based on histological findings using deep learning techniques, which can extract clinically relevant histological patterns that are not apparent to the human eye. For instance, our team developed PathoRiCH, a deep learning classifier designed to predict platinum resistance based solely on hematoxylin and eosin (H&E) staining images [11]. Despite this progress, previous histologic image-based deep learning studies have analyzed pre-categorized HGSC samples in a simplistic binary classification of HGSC as either having a favorable or poor prognosis [12-14]. This oversimplifies the complex heterogeneous nature of HGSC.
- To address the limitations of these approaches and better capture the complex intratumoral heterogeneity of HGSC, our approach introduces a novel bottom-up classification method grounded in classical pathology. Instead of relying on predefined molecular data or survival prognosis information, we focus on grouping tumor clusters with similar histopathological patterns across different HGSC tumors. We hypothesize that different clonal expansions within HGSC may have varying effects on clinical prognosis, with certain clonal combinations leading to poor survival and others to a more favorable prognosis. To achieve this, we utilized the Histomic Atlases of Variation Of Cancers (HAVOC) model pipeline to HGSC [15]. Unlike other deep learning tools trained on histopathological patterns labeled with predefined molecular data, which may limit the generalization of intratumoral heterogeneity, HAVOC partitions histological patterns observed in whole slide images (WSIs) in an unsupervised manner. This allows for a more comprehensive exploration of intratumoral heterogeneity.
- In this study, we identified various tumor clones present within The Cancer Genome Atlas dataset for ovarian cancer (TCGA-OV) using the HAVOC model. The detected clones were then grouped by similar histopathological patterns into common histomic clusters (CHCs). We then categorized HGSCs into three different groups based on different CHC combinations. Each group’s histomorphologic and molecular characteristics were evaluated, and their clinical relevance was investigated.
INTRODUCTION
- Study cohort
- The TCGA-OV dataset from the Genomic Data Commons data portal (https://portal.gdc.cancer.gov/) was used. A total of 73 cases were selected based on the availability of H&E-stained WSI from formalin-fixed paraffin-embedded tissue during the primary debulking surgery, along with RNA sequencing data. WSI from frozen sections were excluded due to severe freezing and ice-crystal artifacts that hinder histomorphological analysis. No additional exclusion criteria were applied. Homologous recombination deficiency (HRD) information was obtained from Zhang et al. [16], based on the representative HRD algorithm using loss of heterozygosity, telomeric allelic imbalance, and large-scale state transitions. The TCGA molecular classifications were sourced from Verhaak et al. [8].
- Histologic clustering to find inter-tumoral CHCs
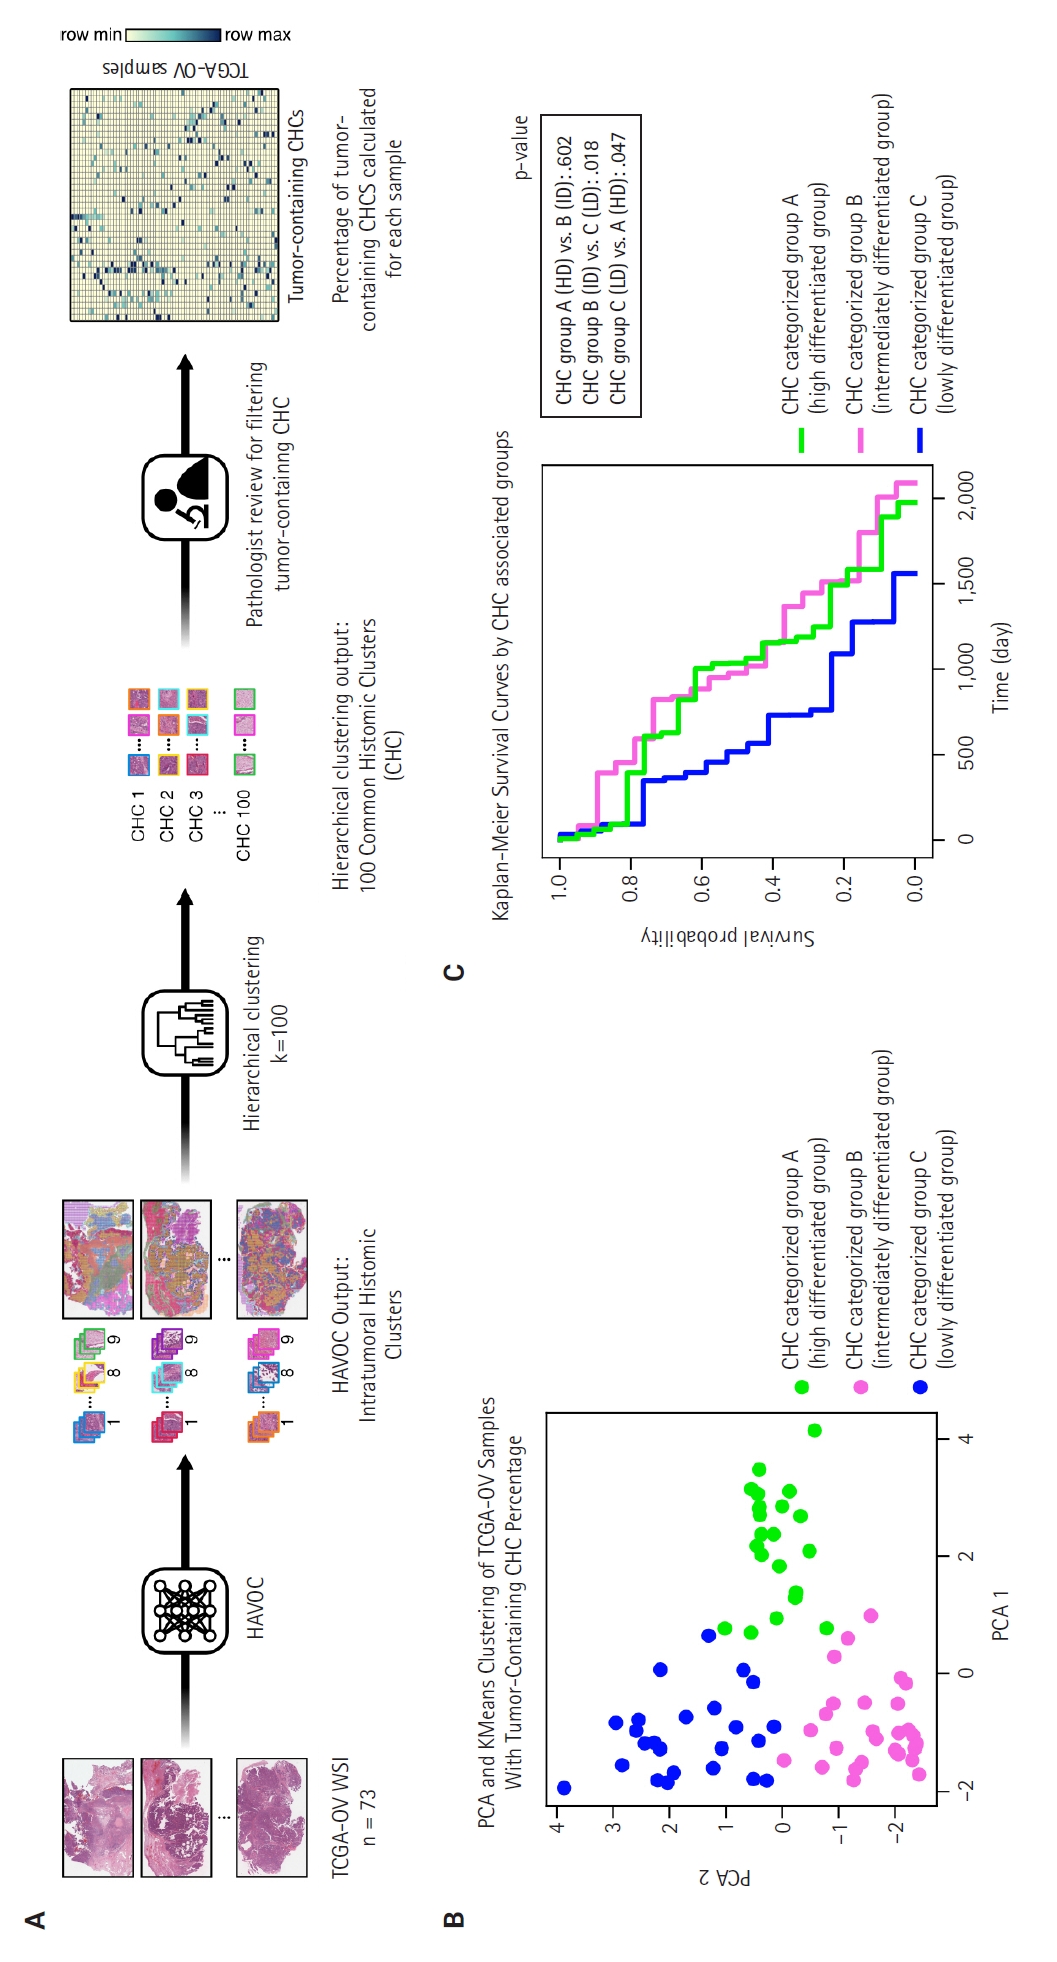
- The 73 HGSC WSIs from the TCGA-OV dataset were processed through the HAVOC pipeline. Patch images (258 µm2, 512 × 512 pixels) were extracted from the WSIs, which were then grouped into intratumoral heterogenic tumor clusters using the default setting of K = 9 (Fig. 1A) [15]. Subsequently, these HAVOC-generated histomic variation clusters were grouped by hierarchical clustering to identify CHCs across all samples, where the elbow method was used for finding the optimal number of cluster (k = 100) (Supplementary Fig. S1). The patch counts for clusters belonging to each TCGA sample are provided in Supplementary Data S1.
- Principal component analysis and K-means clustering analysis
- Two pathologists (B.A. and E.P.) reviewed all CHCs, selecting those with more than 10% tumor cells as tumor-containing CHCs for further analysis. The percentages of tumor-containing CHCs within each sample were calculated based on the total number of tumor cluster patches present (Supplementary Data S1). Principal component analysis (PCA) analysis was performed on this percentage data, followed by K-means clustering to categorize the samples into three CHC-categorized groups (Fig. 1B). The optimal number of clusters was determined by the highest silhouette score (Supplementary Fig. S2).
- Histologic analysis
- The distribution of each tumor-containing CHC across the three CHC-categorized groups was compared using pairwise t-tests. Histologic features of the CHCs were analyzed by two pathologists (B.A. and E.P.). For quantitative analysis, Hover-Net with pretrained official fast-PanNuke checkpoint (panoptic quality score of 0.4863 for multi-class segmentation on TCGA ovary tissues) was used to segment nuclei present in all patches generated by the HAVOC pipeline into three cell types: tumor cells, stromal cells, and inflammatory cells [17]. Six nucleus shape features (area, circularity, length, maximum diameter, minimum diameter, and solidity) and eight nucleus color features (maximum, minimum, mean, and median values for both H&E staining) were extracted using QuPath ver. 0.5.1 with the default resolution setting of 2 µm per pixel [18]. Descriptive statistical analyses for all histologic features were performed using KNIME ver. 5.2.3 [19]. The Welch ANOVA test and the Games-Howell test were used to determine if each CHC had unique histologic features. Immune cell analysis was conducted using CIBERSROTx [20].
- RNA sequencing analysis
- Differential gene expression (DEG) analysis was performed using edgeR [21] with a cutoff of p ≤ 0.01 and log (fold change) ≥ 1.0. Enrichment analysis was conducted using fgsea [22] and Gene Ontology Biological Process (GO:BP) terms with a cutoff of false discovery rate (FDR) ≤ 0.01 and log (fold change) ≥ 0.2.
- Statistical analysis
- Chi-squared test was used to evaluate correlations between categorical variables. Kaplan-Meier survival curves and multivariable Cox proportional hazards regression analyses were used for survival analyses. Two-tailed p-values < 0.05 were considered statistically significant for all analyses. All data were analyzed using Python (ver. 3.10).
MATERIALS AND METHODS
- Cohort characteristics
- The clinicopathologic characteristics of the 73 TCGA samples are shown in Table 1. Most samples (77%) were in International Federation of Gynecology and Obstetrics (FIGO) stage IIIC, followed by stage IV (21%) and stage IIC (1.4%). The molecular classifications were 25% differentiated, 14% immunoreactive, 22% mesenchymal, and 40% proliferative. HRD status showed 47% as HRD-positive, 47% as non-HRD, and 6.8% as unknown.
- Finding CHC-categorized groups
- As illustrated in Fig. 1A, we identified various histologically distinct tumor clones within HGSC samples in the TCGA-OV datasets using the HAVOC pipeline. Hierarchical clustering of the mean feature values for each tumor clone was then employed to group them into 100 unique CHCs, of which 40 CHCs contained more than 10% tumor cells. Using the percentage of tumor-containing CHCs for each sample, we applied PCA and K-means clustering to categorize the TCGA samples into three distinct groups: temporarily named groups A, B, and C (Fig. 1B). In terms of clinicopathologic characteristics, no significant differences in patient age, FIGO stage, molecular classification, or HRD status were observed across the three CHC-categorized groups (Table 1).
- Histologic analysis by pathologists reveals unique morphological differences in highly differentiated, intermediately differentiated, and lowly differentiated groups
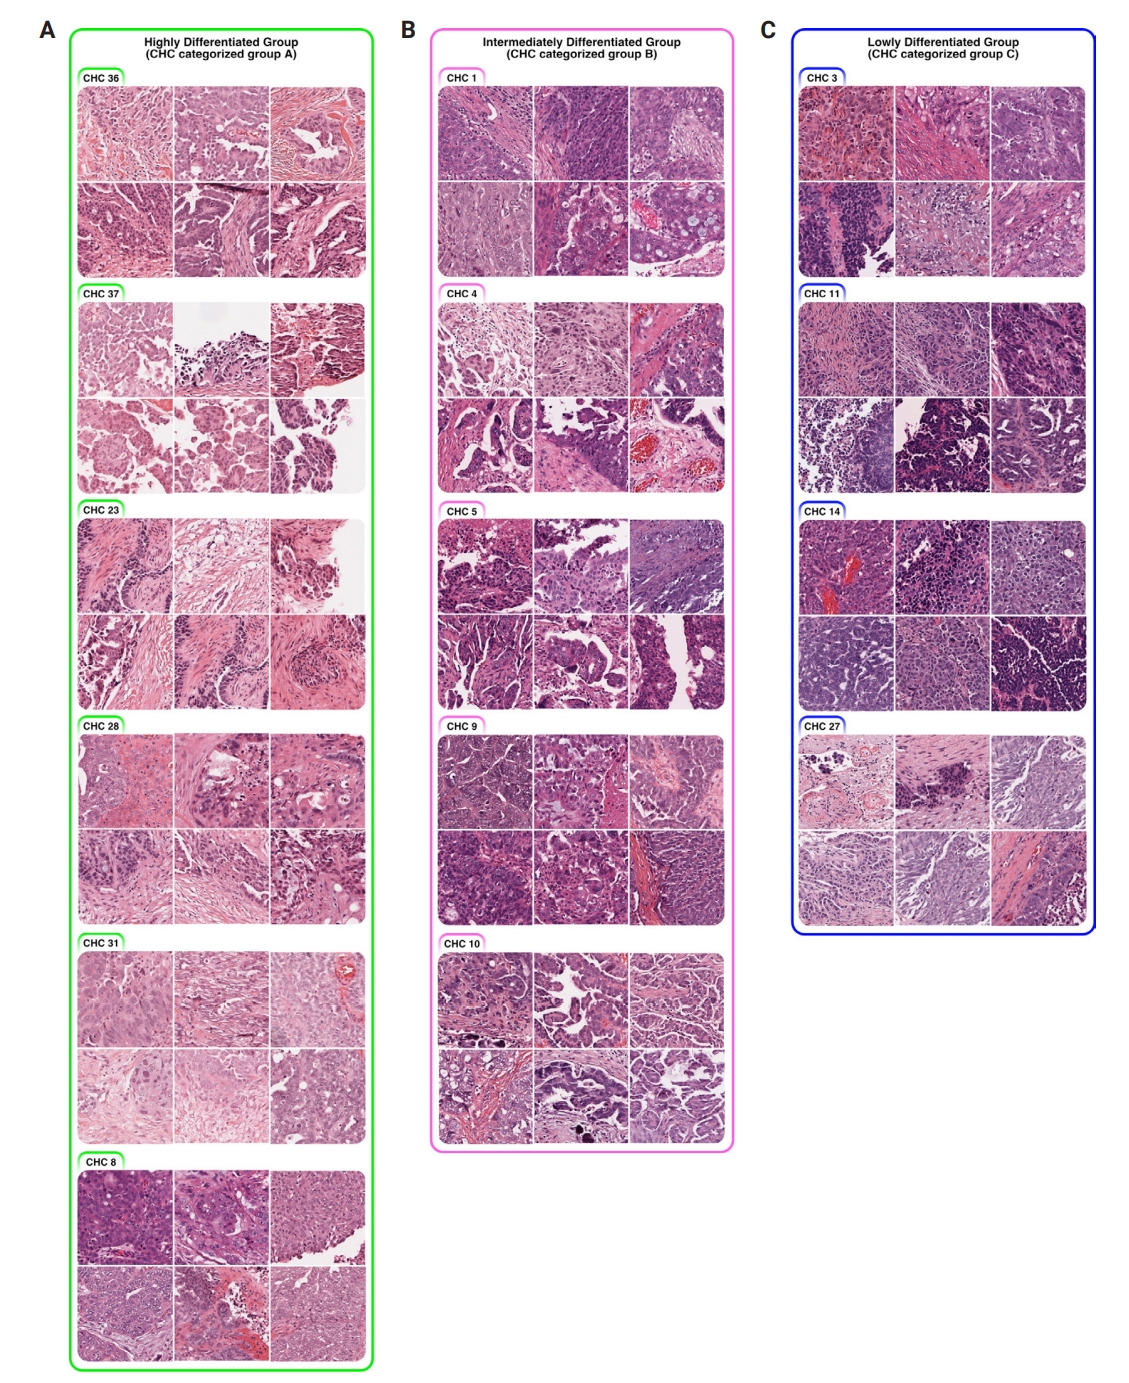
- Using a pairwise t-test, we compared the percentage of the 40 tumor-containing CHCs across the three CHC-categorized groups (Supplementary Fig. S3) and identified significantly present CHCs for each group: six in group A, five in group B, and four in group C (Fig. 2).
- All three groups exhibited poorly differentiated histologic features, characterized by high-grade cytologic atypia, nuclear pleomorphism, prominent nucleoli, and at least focal patternless sheet-like solid morphologies. However, some CHCs exhibited unique histomorphological characteristics that distinguished the groups. Group A included CHCs with high histomorphological variability, predominantly featuring more differentiated patterns, such as glandular (CHC36) and micropapillary patterns (CHC37), with a relatively low tumor-to-stromal ratio. It also included small islands or cord-like patterns within fibrotic stroma (CHC23). Group B exhibited more poorly differentiated morphology than the group A, with complex glandular to solid cluster patterns of hyperchromatic monotonous tumor cells (CHC1, CHC4, and CHC5). In contrast, group C consisted entirely of patternless sheet-like hyperchromatic monotonous tumor cells with sieve-like spaces and a high tumor-to-stromal ratio. Based on these histologic features, we named our CHC-categorized groups A–C as highly differentiated (HD), intermediately differentiated (ID), and lowly differentiated (LD), respectively.
- Quantitative histologic analysis using Hover-Net and QuPath confirms unique histomorphologic traits in HD, ID, and LD groups
- To objectively evaluate the histologic features of CHCs, we detected nuclei present in all tumor-containing patches via Hover-Net and extracted their histologic features using QuPath (Supplementary Fig. S4). A total of 50,050,242 nuclei were segmented and categorized into three cell types: tumor (39,477,010 cells, 78.9%), stromal (7,857,234 cells, 15.7%), and inflammatory (2,715,998 cells, 5.4%) (Supplementary Data S2). The Welch ANOVA and Games-Howell tests showed that 95%–100% of the pairwise comparisons of tumor and stromal nuclei features between different CHCs were statistically significant (p < .05) (Supplementary Data S3, S4). The overall mean values of six nucleus shape features and eight color features for tumor-containing CHCs are illustrated in Supplementary Fig. S5.
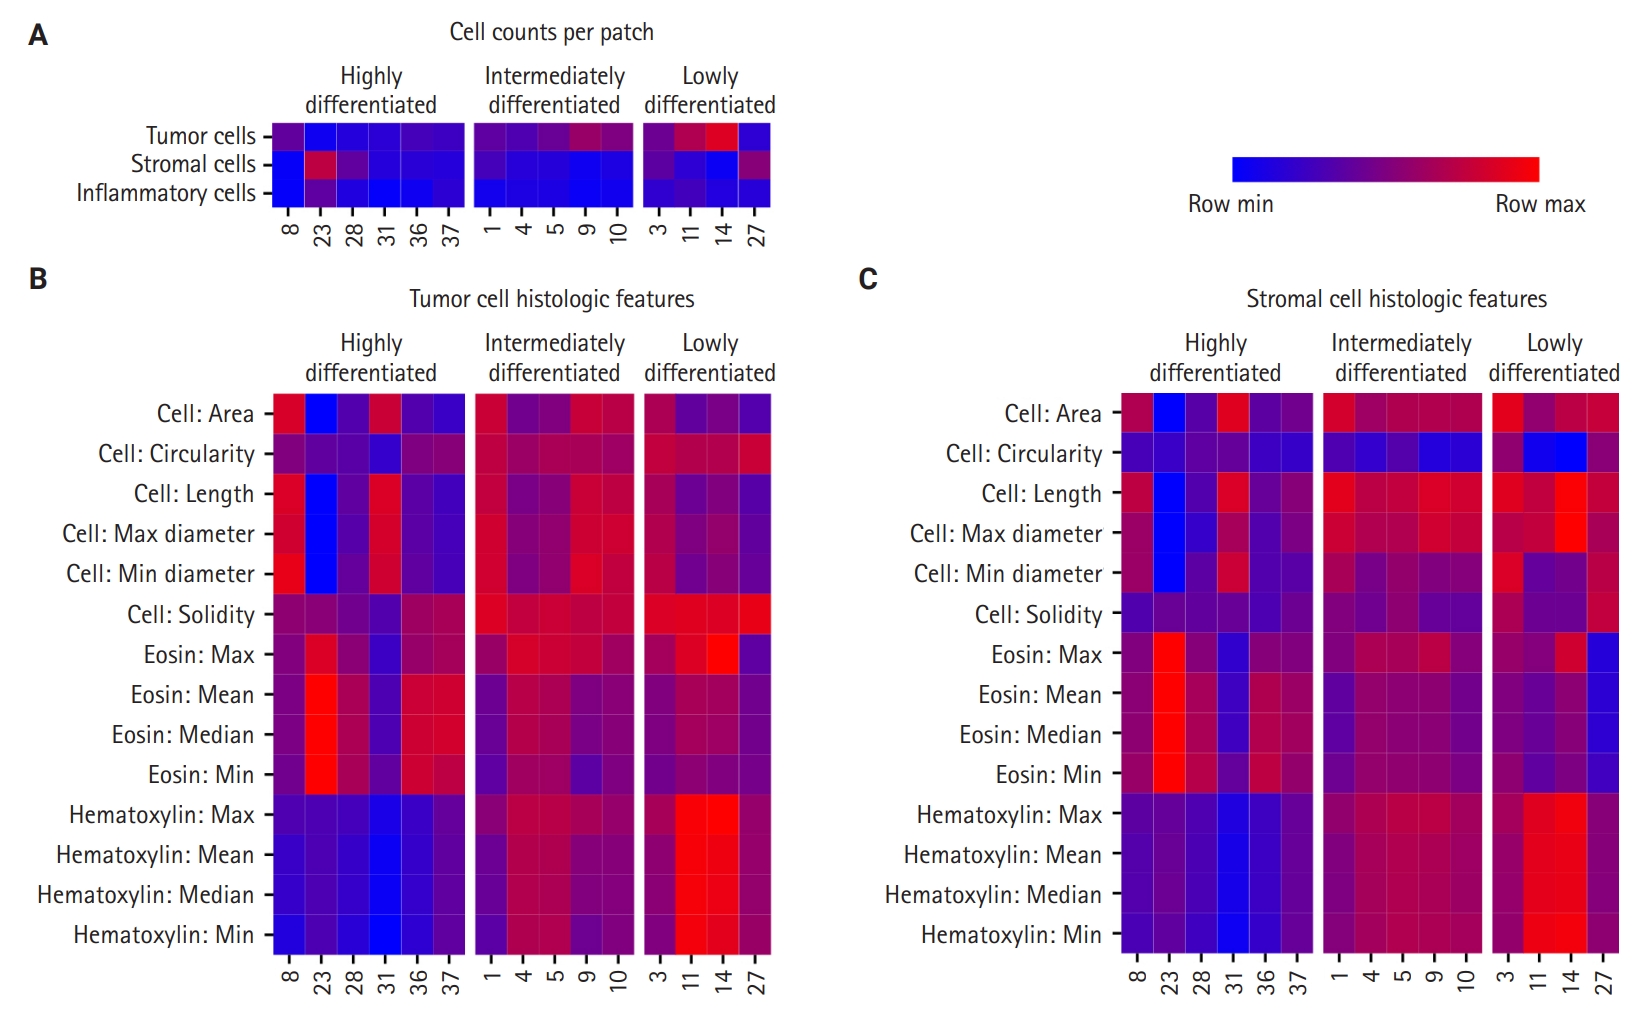
- First, cell densities and cell counts per WSI patches were compared in the significant CHCs among the HD, ID, and LD groups (Fig. 3A). The HD group was characterized by CHCs with low-density tumor nuclei patches (CHC 23, 28, and 31), while the LD group included CHCs with high-density tumor nuclei (CHC 11 and 14). The ID group’s nuclei density fell between those of the other two groups. For stromal cells, all three CHC groups showed low stromal cell density, except for certain CHCs, such as CHC 23 in the HD group. Regarding inflammatory cell count comparisons, there was no difference in inflammatory cell density across all three groups, which was further confirmed by CIBERSORTx analysis (FDR > 0.05) (Supplementary Fig. S6).
- Quantitative histologic features of tumor and stromal nuclei revealed distinctive patterns among the three CHC groups (Fig. 3B, C). The HD group displayed variation in size across its CHCs, with some (CHC31 and CHC8) exhibiting larger tumor and stromal nuclei, while others (CHC23) showed smaller nuclei. The HD group CHCs were overall irregular in shape, exhibiting low circularity and solidity. In contrast, CHCs in the ID and LD groups were characterized by larger tumor and stromal nuclei with more regular, circular, and solid shapes, with less size variation across CHCs compared to the HD group.
- The most striking differences among the groups were in their nucleus color features. The HD group was characterized by low hematoxylin and high eosin staining for both tumor and stromal nuclei. The LD group exhibited strong hematoxylin staining and low eosin staining. Meanwhile, the ID group exhibited more balanced staining levels, positioning itself between HD and LD groups.
- The quantitative histologic analysis complements the qualitative assessments by pathologists. In the HD group, differentiated patterns such as glandular (CHC36) and micropapillary (CHC37) corresponded with a low tumor-to-stromal ratio. Additionally, CHC23, marked by fibrotic stroma, was validated by its high stromal density. Conversely, most CHCs from the ID and LD groups, characterized by patternless hyperchromatic sheet-like patterns (CHC3, 4, 5, 11, 14), were supported by quantitative findings of a high tumor-to-stromal ratio and increased hematoxylin staining.
- DEG and gene enrichment analysis reveal distinctive molecular characteristics in HD, ID, and LD groups
- The RNA sequencing analysis compared the three CHC groups in a pairwise manner, highlighting significant DEGs with a log2 (fold change) greater than 1 (Fig. 4A). The HD group showed increased expression of genes involved in genome stability and calcium signaling, such as TDRD12 and CALML5, compared to the ID group, suggesting enhanced genomic maintenance and cellular regulation. It also exhibited upregulation of oxidative phosphorylation (OXPHOS) and mitochondrial-related genes, such as NDUFC2 and UQCRHL, compared to the LD group, indicating higher metabolic activity in the HD group.
- In contrast, the ID group showed upregulation of genes related to vesicle trafficking, cellular communication, and RNA processing, including DENND2A, RAB3B, and SRRM3, in comparison to the HD group. Additionally, the ID group demonstrated higher expression of the tumor suppressor gene CPLX2 and the cancer-associated fibroblast (CAF) protein EMILIN3 compared to the LD group. These DEGs suggest that interactions and modulations of the tumor are key mechanisms in the ID group.
- Lastly, the LD group did not show any significantly upregulated genes with a log2 (fold change) greater than 1 compared to the ID and HD groups. However, the upregulation of the oncogene ERBB2, despite a lower fold change, hints at its involvement in oncogenic signaling within the LD group.
- The enrichment analysis using GO:BP terms was conducted between all three CHC-categorized groups in pairs, with fold change differences illustrated in Supplementary Fig. S7. To simplify these complex three-way comparisons, which are difficult to grasp (Fig. 4B) was created: using the LD group as a pivot, gene enrichments of the HD and ID groups were plotted for a clearer comparison.
- Overall, the HD group deviated the most from the ID group, particularly in processes related to mitochondrial oxidative phosphorylation. GO terms, such as mitochondrial ATP synthesis coupled proton transport and mitochondrial respiratory chain complex assembly, were markedly upregulated, aligning with DEG analysis. Additionally, the HD group showed upregulation of metabolic process, such as glutathione derivative metabolic process, highlighting heightened metabolic activities alongside active mitochondrial energy production. Beyond energy metabolism, the HD group showed significant upregulation of immune processes, as indicated by GO terms such as positive regulation of immune effector process and regulation of T cell-mediated cytotoxicity. However, the number of significant immune terms was limited to six, many of which were associated with acute immune responses, such as antibacterial humoral response and acute inflammatory response.
- In contrast, the HD group had significant downregulation in development and morphogenesis processes, as well as extracellular matrix, compared to the LD and ID groups. Specifically, for development and morphogenesis, there was marked downregulation in GO terms associated with skeletal development (e.g., embryonic skeletal system morphogenesis, muscle cell differentiation) and nervous system development (e.g., presynapse assembly, neuron migration). Additionally, GO terms related to the extracellular matrix, such as collagen fibril organization and extracellular matrix assembly, were also significantly downregulated.
- The ID group consistently positioned at a midpoint between the HD and LD groups regarding all GO terms related to mitochondrial and metabolic processes. In terms of extracellular matrix, development, and morphogenesis, the ID group showed significant downregulation for all associated GO terms compared to the HD group. Against the LD group, the ID group showed either no significant difference or slight upregulation. For immune response, the ID group demonstrated the lowest enrichment among the three groups. The most striking characteristics for the ID group was the significant upregulation of metal ion responses related to cadmium, zinc, and copper, as indicated by GO terms such as response to zinc ion, response to cadmium ion, and response to copper ion.
- Lastly, the LD group exhibited the lowest regulation in mitochondrial oxidative phosphorylation, metabolic processes, and metal ion responses among the three CHC-associated groups, highlighting the molecular spectrum across them. The most notable differences were observed in mitochondrial OXPHOS and metabolism, with biological activity progressively increasing from LD to ID to HD.
- Survival analysis reveals clinically significant survival difference between CHC-categorized groups
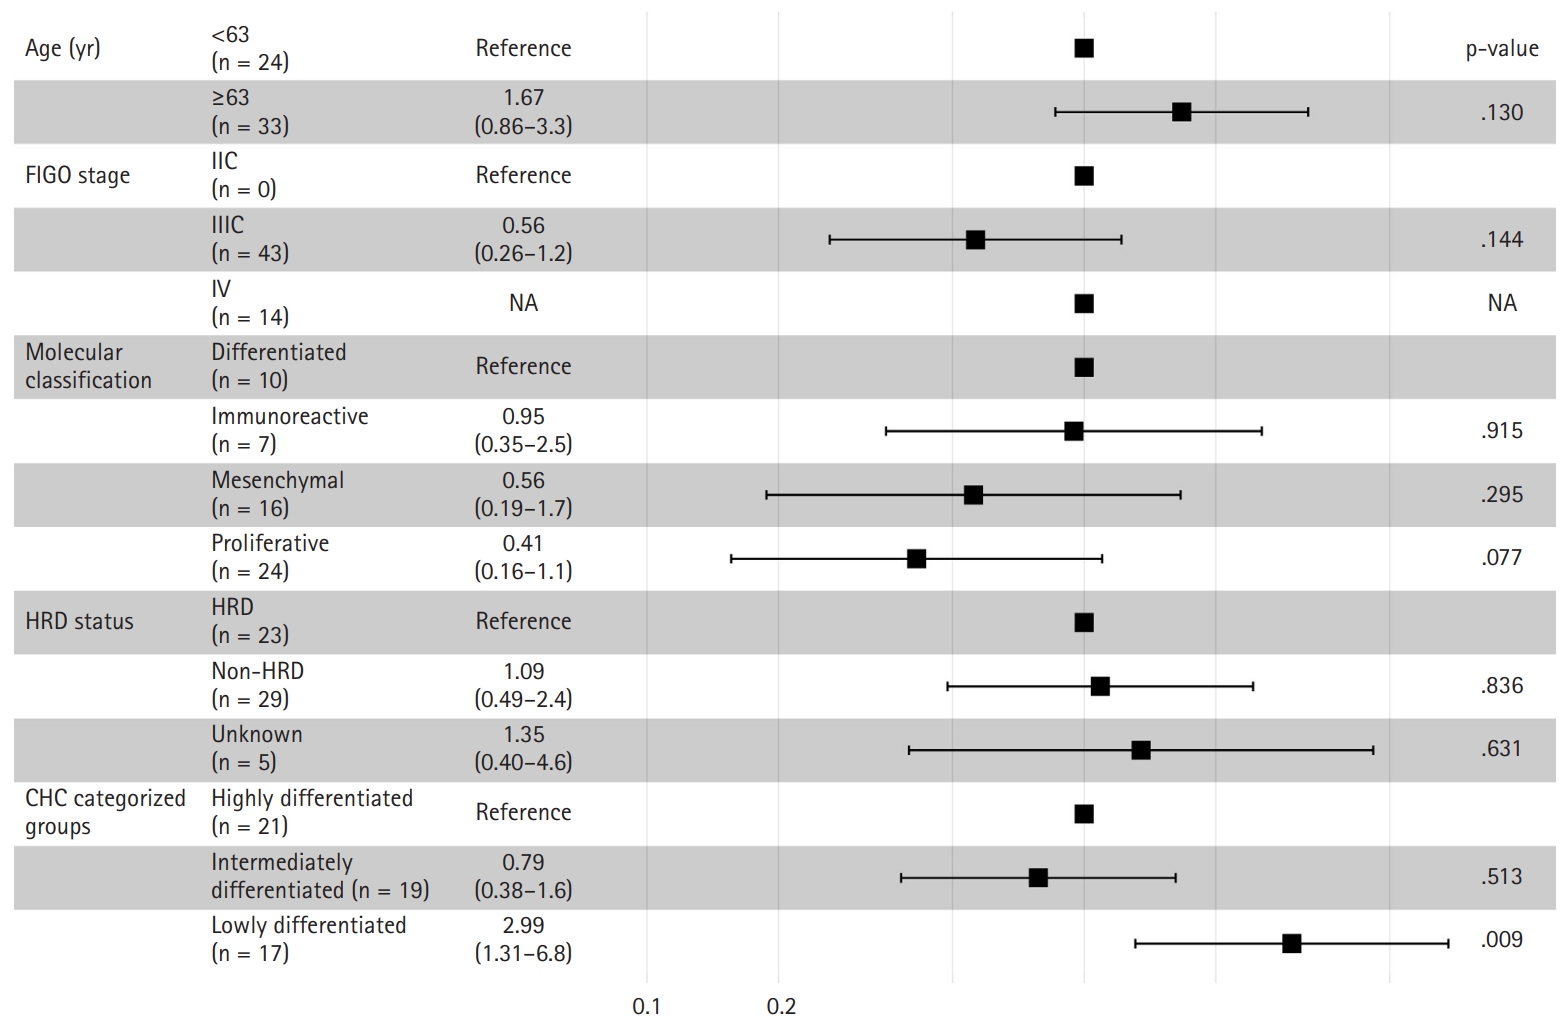
- The Kaplan-Meier survival curves for the CHC-categorized groups demonstrated significant differences in overall survival probabilities (Fig. 1C). The LD group had the lowest survival probability over time compared to the HD (p = .047) and ID groups (p = .018). There was no significant survival difference between the HD and ID groups (p = .602). Table 2 shows survival, histology, and RNA molecular analysis results for the three CHC-categorized groups. Additionally, a multivariable Cox proportional hazards regression analysis was performed to evaluate the association of various clinicopathologic factors with survival. The CHC-categorized group was identified as the only independent prognostic factor (Fig. 5).
RESULTS
- In this study, we performed histomorphologic clustering of HGSC, deriving three distinct subgroups based on 40 tumor-containing CHCs. Given HAVOC's success in detecting intratumoral heterogeneity in high-grade gliomas, a similarly poorly differentiated tumor, we anticipated its capability to identify histologically distinct patterns in HGSC. With the identified CHCs, we categorized tumors in a manner relevant to clinical prognosis. Through PCA and K-means clustering analysis of CHCs in 73 TCGA-OV samples, we identified three histomorphologically unique groups with significant survival differences (Table 2). The HD and ID groups were associated with favorable overall survival. The HD group featured low tumor density, highly pleomorphic nucleoli, and focal glandular and micropapillary patterns with high eosinophilic staining. The ID group exhibited intermediate tumor density and focal complex glandular and solid patterns with a balanced H&E staining. In contrast, the LD group demonstrated significantly lower overall survival and was characterized by high tumor density, large monotonous nuclei, and a completely patternless structure with high hematoxylin staining.
- Our new categorization of HGSC differs from the well-known TCGA molecular classification. The stromal-rich characteristics typical of the mesenchymal subtype (TCGA’s poor prognosis group) were not present in the LD group. Similarly, the abundant lymphocyte features associated with the immunoreactive subtype (favorable prognosis group) were absent in both the HD and ID groups. Unlike molecular subtypes, our categorization emphasizes tumor cell density and H&E staining intensities of nuclei, as revealed by histology analysis. Both cell density and hematoxylin staining intensity increased progressively from the HD to ID to LD groups, a trend confirmed by both pathologist interpretations and quantitative analysis. Notably, the LD group exhibited the poorest overall survival, suggesting that higher tumor cell density and strong hematoxylin staining intensity are correlated with adverse prognosis in HGSC.
- Our results suggest that H&E staining intensities provide valuable biological information, as varying nucleus intensities correlate with different prognostics groups in HGSC. To preserve the biological information integrated in the image, we opted to not use color normalization in this experiment. Currently, there is no universally accepted standard for normalization, and different techniques can yield varying results [23]. Additionally, normalization can introduce color artifacts that can potentially compromise the integrity of the image [24].
- Gene enrichment analysis offers a new perspective on HGSC compared to the TCGA classifications, linking CHC-associated groups to energy metabolism, particularly mitochondrial dynamics, and OXPHOS. The LD group, associated with poor prognosis, showed significant downregulation of genes associated with mitochondria and OXPHOS compared to those in the ID and HD groups, with the ID group positioned in between the other two groups. This finding aligns with studies indicating that increased OXPHOS generates reactive oxygen species, enhancing platinum-based chemotherapy sensitivity and favorable prognosis [25,26]. Additionally, a shift from OXPHOS to glycolytic metabolism is tied to higher invasiveness and poorer survival, as seen in the LD group [27]. This metabolic shift, causing mitochondrial fission and repositioning of mitochondria to the cell periphery leading to lamellipodia formation, may explain the nuclear shape changes observed in histologic analysis [28,29].
- The DEG analysis revealed significant ERBB2/HER2 upregulation in the LD group. A recent study suggested a potential link between HER2 and OXPHOS, as HER2 can translocate to mitochondria, stimulating OXPHOS and promoting tumorigenicity in breast cancer cells [30]. To identify HER2's role in HGSC, further investigation is needed on the HER2 localization and its association with OXPHOS in HGSC tumor cells.
- Gene enrichment analysis revealed significant upregulation of extracellular matrix-related processes in the LD group compared to the favorable HD group. Despite no difference in stromal cell counts from the quantitative analysis, the LD group, associated with poor prognosis, exhibited larger and longer stromal nuclei with more intense hematoxylin staining, suggesting the presence of activated CAF [31].
- Gene enrichment showed upregulation of a few immune terms in the HD group, primarily related to antibacterial and acute inflammatory responses rather than cancer-related immunity. Immune cell counts were comparable across the three CHC-associated groups, confirmed by CIBERSORT analysis, suggesting minor immune implications across the three groups.
- Based on the overall analysis, we hypothesize that the three CHC-associated groups represent a spectrum of tumor progression: HD is the least progressed, LD is the most progressed, and ID is intermediate. Histomorphologic analysis shows a progression from less dense differentiated tumors to solid, high-density cell tumors. Gene analysis supports this, with the ID group showing intermediate mitochondrial activity and metabolism. Interestingly, the ID group had survival rates similar to those of the HD group, suggesting that a shift from ID to LD may be key to poor prognosis in HGSC. Notably, the ID group exhibited significant upregulation of metal ion response genes, particularly those related to zinc, copper, and cadmium, compared to the other clusters. Both cadmium and zinc are associated with HGSC and could potentially play unique roles in its progression [32,33], warranting further investigation.
- Our findings offer valuable prognostic insights and could guide treatment decisions by identifying CHCs linked to poor prognosis and potential resistance to standard therapies, such as platinum-based chemotherapy and radiation therapy. Additionally, they could lay the groundwork for developing digital biomarkers and targeted therapies, including mitochondria-targeted treatments for the OXPHOS-enhanced HD group and HER2-targeted therapies for the LD group.
- The limitations of this study include a small sample size of 73, which may not adequately represent the extensive inter- and intra-tumoral heterogeneity present in HGSC. A larger sample size and multiple WSIs per patient are needed for future studies. Additionally, the genetic analysis relied on bulk sequencing. A more detailed analysis of the tumor microenvironment, particularly stromal and immune cell activities, would benefit from single-cell or spatial sequencing. Additionally, the TCGA-OV datasets lack comprehensive clinical information regarding specific treatments and chemotherapy regimens received by the patients, which could potentially serve as confounding factors influencing survival outcomes. Since this was a pilot study, further research is planned with larger in-house dataset, including more in-depth clinical information to better address the histologically distinct entities and their association with mitochondrial activity to a broader HGSC population.
- In this study, we used HAVOC to examine intratumoral heterogeneity in HGSC with the TCGA-OV dataset, categorizing three histologically distinct groups with varying survival outcomes. Our findings illustrate a progression from well-differentiated histological patterns with high OXPHOS activity in HD, through the ID group, to poorly differentiated patterns with low OXPHOS in the LD group, indicating a potential tumor progression from HD to LD. Despite the limited sample size, this pilot study lays the groundwork for future research to validate these histological entities and their link to mitochondrial activity.
DISCUSSION
Supplementary Information
Ethics Statement
This study was conducted using only public data that Institutional Review Board was not required.
Availability of Data and Material
The TCGA dataset is publicly available via the TCGA portal (https://portal.gdc.cancer.gov).
Code Availability
Not applicable.
Author Contributions
Conceptualization: BA. Data curation: BA. Formal analysis: BA. Funding acquisition: EP. Investigation: EP. Methodology: BA. Project administration: EP. Resources: BA. Software: BA. Supervision: EP. Validation: BA. Visualization: BA. Writing—original draft: BA, EP. Writing—review & editing: BA, EP. Approval of final manuscript: BA, EP.
Conflicts of Interest
The authors declare that they have no potential conflicts of interest.
Funding Statement
This research was supported by a grant of the Korea Health Technology R&D Project through the Korea Health Industry Development Institute (KHIDI), funded by the Ministry of Health & Welfare, Republic of Korea (grant number: HI19C0481, HC21C0012, RS-2024-00438923) and a faculty research grant from Yonsei University College of Medicine (6-2021-0244 and 6-2022-0179) to E.P.


| Characteristic | All samples (n = 73) |
Group A |
Group B |
Group C |
p-valuea |
|---|---|---|---|---|---|
| HD group (n = 22) | ID group (n = 27) | LD group (n = 24) | |||
| Age (yr) | .471 | ||||
| <63 | 34 (46.6) | 8 (36.4) | 13 (48.1) | 13 (54.2) | |
| ≥63 | 39 (53.4) | 14 (63.6) | 14 (51.9) | 11 (45.8) | |
| FIGO stage | .651 | ||||
| IIC | 1 (1.4) | 0 | 1 (3.7) | 0 | |
| IIIC | 56 (76.7) | 18 (81.8) | 19 (70.4) | 19 (79.2) | |
| IV | 15 (20.5) | 4 (18.2) | 7 (25.9) | 4 (16.7) | |
| Unknown | 1 (1.4) | 0 | 0 | 1 (4.2) | |
| Molecular classification | .523 | ||||
| Differentiated | 18 (24.7) | 5 (22.7) | 9 (33.3) | 4 (16.7) | |
| Immunoreactive | 10 (13.7) | 4 (18.2) | 3 (11.1) | 3 (12.5) | |
| Mesenchymal | 16 (21.9) | 6 (27.3) | 4 (14.8) | 6 (25.0) | |
| Proliferative | 29 (39.7) | 7 (31.8) | 11 (40.7) | 11 (45.8) | |
| HRD status | .471 | ||||
| HRD | 34 (46.6) | 9 (40.9) | 15 (55.6) | 10 (41.7) | |
| Non-HRD | 34 (46.6) | 10 (45.5) | 10 (37.0) | 14 (58.3) | |
| Unknown | 5 (6.8) | 3 (13.6) | 2 (7.4) | 0 |
Values are presented as number (%).
TCGA-OV, The Cancer Genome Atlas dataset for ovarian cancer; HD, highly differentiated; ID, intermediately differentiated; LD, lowly differentiated; FIGO, International Federation of Gynecology and Obstetrics; HRD, homologous recombination deficiency.
aChi-squared test of independence was used to compare the three common histomic cluster–categorized groups.
| Overall survival | Qualitative histologic analysis |
Quantitative histologic analysis |
RNA sequencinga |
||||||
|---|---|---|---|---|---|---|---|---|---|
| Cell features | Color features | Mt & Metab | ECM | Dev & Morph | Metal ion response | Immune response | |||
| Highly differentiated (HD) group | Favorable | Low tumor-to-stromal ratio | Low tumor cell density | High eosin with low hematoxylin staining | +++ | + | + | ++ | +++ |
| High variability among CHCs | Low stromal cell density | ||||||||
| High pleomorphism of tumor cells | Significant nuclei size variations among CHCs | ||||||||
| Includes glandular and micropapillary patterns | Irregular tumor nuclei shape with low circularity and solidity across CHCs | ||||||||
| Intermediately differentiated (ID) group | Favorable | Intermediate tumor-to-stromal ratio | Intermediate tumor cell density | Balanced hematoxylin and eosin staining | ++ | +++ | +++ | +++ | ++ |
| Peritumoral cleft-like spaces | Low stromal cell density | ||||||||
| Includes complex glandular to solid patterns | Large, circular, and solid nuclei | ||||||||
| Little nuclei size variations | |||||||||
| Lowly differentiated (LD) group | Poor | High tumor-to-stromal ratio | High tumor cell density | High hematoxylin and low eosin staining | + | +++ | ++/+++ | + | + |
| Complete patternless sheet-like structure | Low stromal cell density | ||||||||
| Peritumoral cleft-like spaces | Large, circular, and solid nuclei | ||||||||
| Little nuclei size variations | |||||||||
CHC, common histomic cluster; Mt & Metab, mitochondria and metabolism; ECM, extracellular matrix; Dev & Morph, development and morphogenesis.
aLegend for RNA sequencing symbols: "+" indicates low expression, "++" represents moderate expression, and "+++" signifies high expression levels across the various categories.
- 1. Ferlay J, Shin HR, Bray F, Forman D, Mathers C, Parkin DM. Estimates of worldwide burden of cancer in 2008: GLOBOCAN 2008. Int J Cancer 2010; 127: 2893-917. ArticlePubMed
- 2. Gonzalez-Martin A, Pothuri B, Vergote I, et al. Niraparib in patients with newly diagnosed advanced ovarian cancer. N Engl J Med 2019; 381: 2391-402. ArticlePubMed
- 3. Yu KH, Levine DA, Zhang H, Chan DW, Zhang Z, Snyder M. Predicting ovarian cancer patients' clinical response to platinum-based chemotherapy by their tumor proteomic signatures. J Proteome Res 2016; 15: 2455-65. ArticlePubMedPMC
- 4. Dao F, Schlappe BA, Tseng J, et al. Characteristics of 10-year survivors of high-grade serous ovarian carcinoma. Gynecol Oncol 2016; 141: 260-3. ArticlePubMedPMC
- 5. Hayashi T, Konishi I. Molecular histopathology for establishing diagnostic method and clinical therapy for ovarian carcinoma. J Clin Med Res 2023; 15: 68-75. ArticlePubMedPMC
- 6. Cancer Genome Atlas Research Network. Integrated genomic analyses of ovarian carcinoma. Nature 2011; 474: 609-15. ArticlePubMedPMCPDF
- 7. Konecny GE, Wang C, Hamidi H, et al. Prognostic and therapeutic relevance of molecular subtypes in high-grade serous ovarian cancer. J Natl Cancer Inst 2014; 106: dju249.ArticlePubMedPMC
- 8. Verhaak RG, Tamayo P, Yang JY, et al. Prognostically relevant gene signatures of high-grade serous ovarian carcinoma. J Clin Invest 2013; 123: 517-25. ArticlePubMed
- 9. Khashaba M, Fawzy M, Abdel-Aziz A, Eladawei G, Nagib R. Subtyping of high grade serous ovarian carcinoma: histopathological and immunohistochemical approach. J Egypt Natl Canc Inst 2022; 34: 6.ArticlePubMedPMCPDF
- 10. Miyagawa C, Nakai H, Otani T, et al. Histopathological subtyping of high-grade serous ovarian cancer using whole slide imaging. J Gynecol Oncol 2023; 34: e47. ArticlePubMedPMCPDF
- 11. Ahn B, Moon D, Kim HS, et al. Histopathologic image-based deep learning classifier for predicting platinum-based treatment responses in high-grade serous ovarian cancer. Nat Commun 2024; 15: 4253.ArticlePubMedPMCPDF
- 12. Laury AR, Blom S, Ropponen T, Virtanen A, Carpen OM. Artificial intelligence-based image analysis can predict outcome in high-grade serous carcinoma via histology alone. Sci Rep 2021; 11: 19165.ArticlePubMedPMCPDF
- 13. Zeng H, Chen L, Zhang M, Luo Y, Ma X. Integration of histopathological images and multi-dimensional omics analyses predicts molecular features and prognosis in high-grade serous ovarian cancer. Gynecol Oncol 2021; 163: 171-80. ArticlePubMed
- 14. Wang CW, Chang CC, Lee YC, et al. Weakly supervised deep learning for prediction of treatment effectiveness on ovarian cancer from histopathology images. Comput Med Imaging Graph 2022; 99: 102093.ArticlePubMed
- 15. Dent A, Faust K, Lam KH, et al. HAVOC: small-scale histomic mapping of cancer biodiversity across large tissue distances using deep neural networks. Sci Adv 2023; 9: eadg1894. ArticlePubMedPMC
- 16. Zhang M, Ma SC, Tan JL, et al. Inferring homologous recombination deficiency of ovarian cancer from the landscape of copy number variation at subchromosomal and genetic resolutions. Front Oncol 2021; 11: 772604.ArticlePubMedPMC
- 17. Graham S, Vu QD, Raza SE, et al. Hover-Net: simultaneous segmentation and classification of nuclei in multi-tissue histology images. Med Image Anal 2019; 58: 101563.ArticlePubMed
- 18. Bankhead P, Loughrey MB, Fernandez JA, et al. QuPath: open source software for digital pathology image analysis. Sci Rep 2017; 7: 16878.ArticlePubMedPMCPDF
- 19. Berthold MR, Cebron N, Dill F, et al. KNIME: the Konstanz information miner: version 2.0 and beyond. ACM SIGKDD Explor Newsl 2009; 11: 26-31. Article
- 20. Chen B, Khodadoust MS, Liu CL, Newman AM, Alizadeh AA. Profiling tumor infiltrating immune cells with CIBERSORT. Methods Mol Biol 2018; 1711: 243-59. ArticlePubMedPMC
- 21. Robinson MD, McCarthy DJ, Smyth GK. edgeR: a Bioconductor package for differential expression analysis of digital gene expression data. Bioinformatics 2010; 26: 139-40. ArticlePubMed
- 22. Korotkevich G, Sukhov V, Budin N, Shpak B, Artyomov MN, Sergushichev A. Fast gene set enrichment analysis. Preprint bioRxiv at: https://doi.org/10.1101/060012 (2021). Article
- 23. Hoque MZ, Keskinarkaus A, Nyberg P, Seppanen T. Stain normalization methods for histopathology image analysis: a comprehensive review and experimental comparison. Inf Fusion 2024; 102: 101997.Article
- 24. Khan AM, Rajpoot N, Treanor D, Magee D. A nonlinear mapping approach to stain normalization in digital histopathology images using image-specific color deconvolution. IEEE Trans Biomed Eng 2014; 61: 1729-38. ArticlePubMedPDF
- 25. Gentric G, Kieffer Y, Mieulet V, et al. PML-regulated mitochondrial metabolism enhances chemosensitivity in human ovarian cancers. Cell Metab 2019; 29: 156-73. ArticlePubMedPMC
- 26. Berndtsson M, Hagg M, Panaretakis T, Havelka AM, Shoshan MC, Linder S. Acute apoptosis by cisplatin requires induction of reactive oxygen species but is not associated with damage to nuclear DNA. Int J Cancer 2007; 120: 175-80. ArticlePubMed
- 27. Kleih M, Bopple K, Dong M, et al. Direct impact of cisplatin on mitochondria induces ROS production that dictates cell fate of ovarian cancer cells. Cell Death Dis 2019; 10: 851.ArticlePubMedPMCPDF
- 28. Cunniff B, McKenzie AJ, Heintz NH, Howe AK. AMPK activity regulates trafficking of mitochondria to the leading edge during cell migration and matrix invasion. Mol Biol Cell 2016; 27: 2662-74. ArticlePubMedPMC
- 29. Gao T, Zhang X, Zhao J, et al. SIK2 promotes reprogramming of glucose metabolism through PI3K/AKT/HIF-1alpha pathway and Drp1-mediated mitochondrial fission in ovarian cancer. Cancer Lett 2020; 469: 89-101. ArticlePubMed
- 30. Novotna E, Milosevic M, Prukova D, et al. Mitochondrial HER2 stimulates respiration and promotes tumorigenicity. Eur J Clin Invest 2024; 54: e14174. ArticlePubMed
- 31. Xing F, Saidou J, Watabe K. Cancer associated fibroblasts (CAFs) in tumor microenvironment. Front Biosci (Landmark Ed) 2010; 15: 166-79. ArticlePubMedPMC
- 32. Furtak G, Kozlowski M, Kwiatkowski S, Cymbaluk-Ploska A. The role of lead and cadmium in gynecological malignancies. Antioxidants (Basel) 2022; 11: 2468.ArticlePubMedPMC
- 33. Lin S, Yang H. Ovarian cancer risk according to circulating zinc and copper concentrations: a meta-analysis and Mendelian randomization study. Clin Nutr 2021; 40: 2464-8. ArticlePubMed
REFERENCES
Figure & Data
References
Citations
- Ovarian Cancer: Epidemiology, Disease Mechanisms, New Diagnosis and Treatment Strategies, and Research Directions
Zunera Khalid, Weirong Fan, Farah Nazir, Yixiang Xing, Tengchuan Jin
iNew Medicine.2026;[Epub] CrossRef - Learning Disabilities in the 21st Century: Integrating Neuroscience, Education, and Technology for Better Outcomes
Syed Mohammed Basheeruddin Asdaq, Ahmad H. Alhowail, Syed Imam Rabbani, Naira Nayeem, Syed Mohammed Emaduddin Asdaq, Faiqa Nausheen
SAGE Open.2025;[Epub] CrossRef
 PubReader
 ePub Link
-
 Cite this Article
- Cite this Article
-
- Close
- Download Citation
- Close
- Figure
-


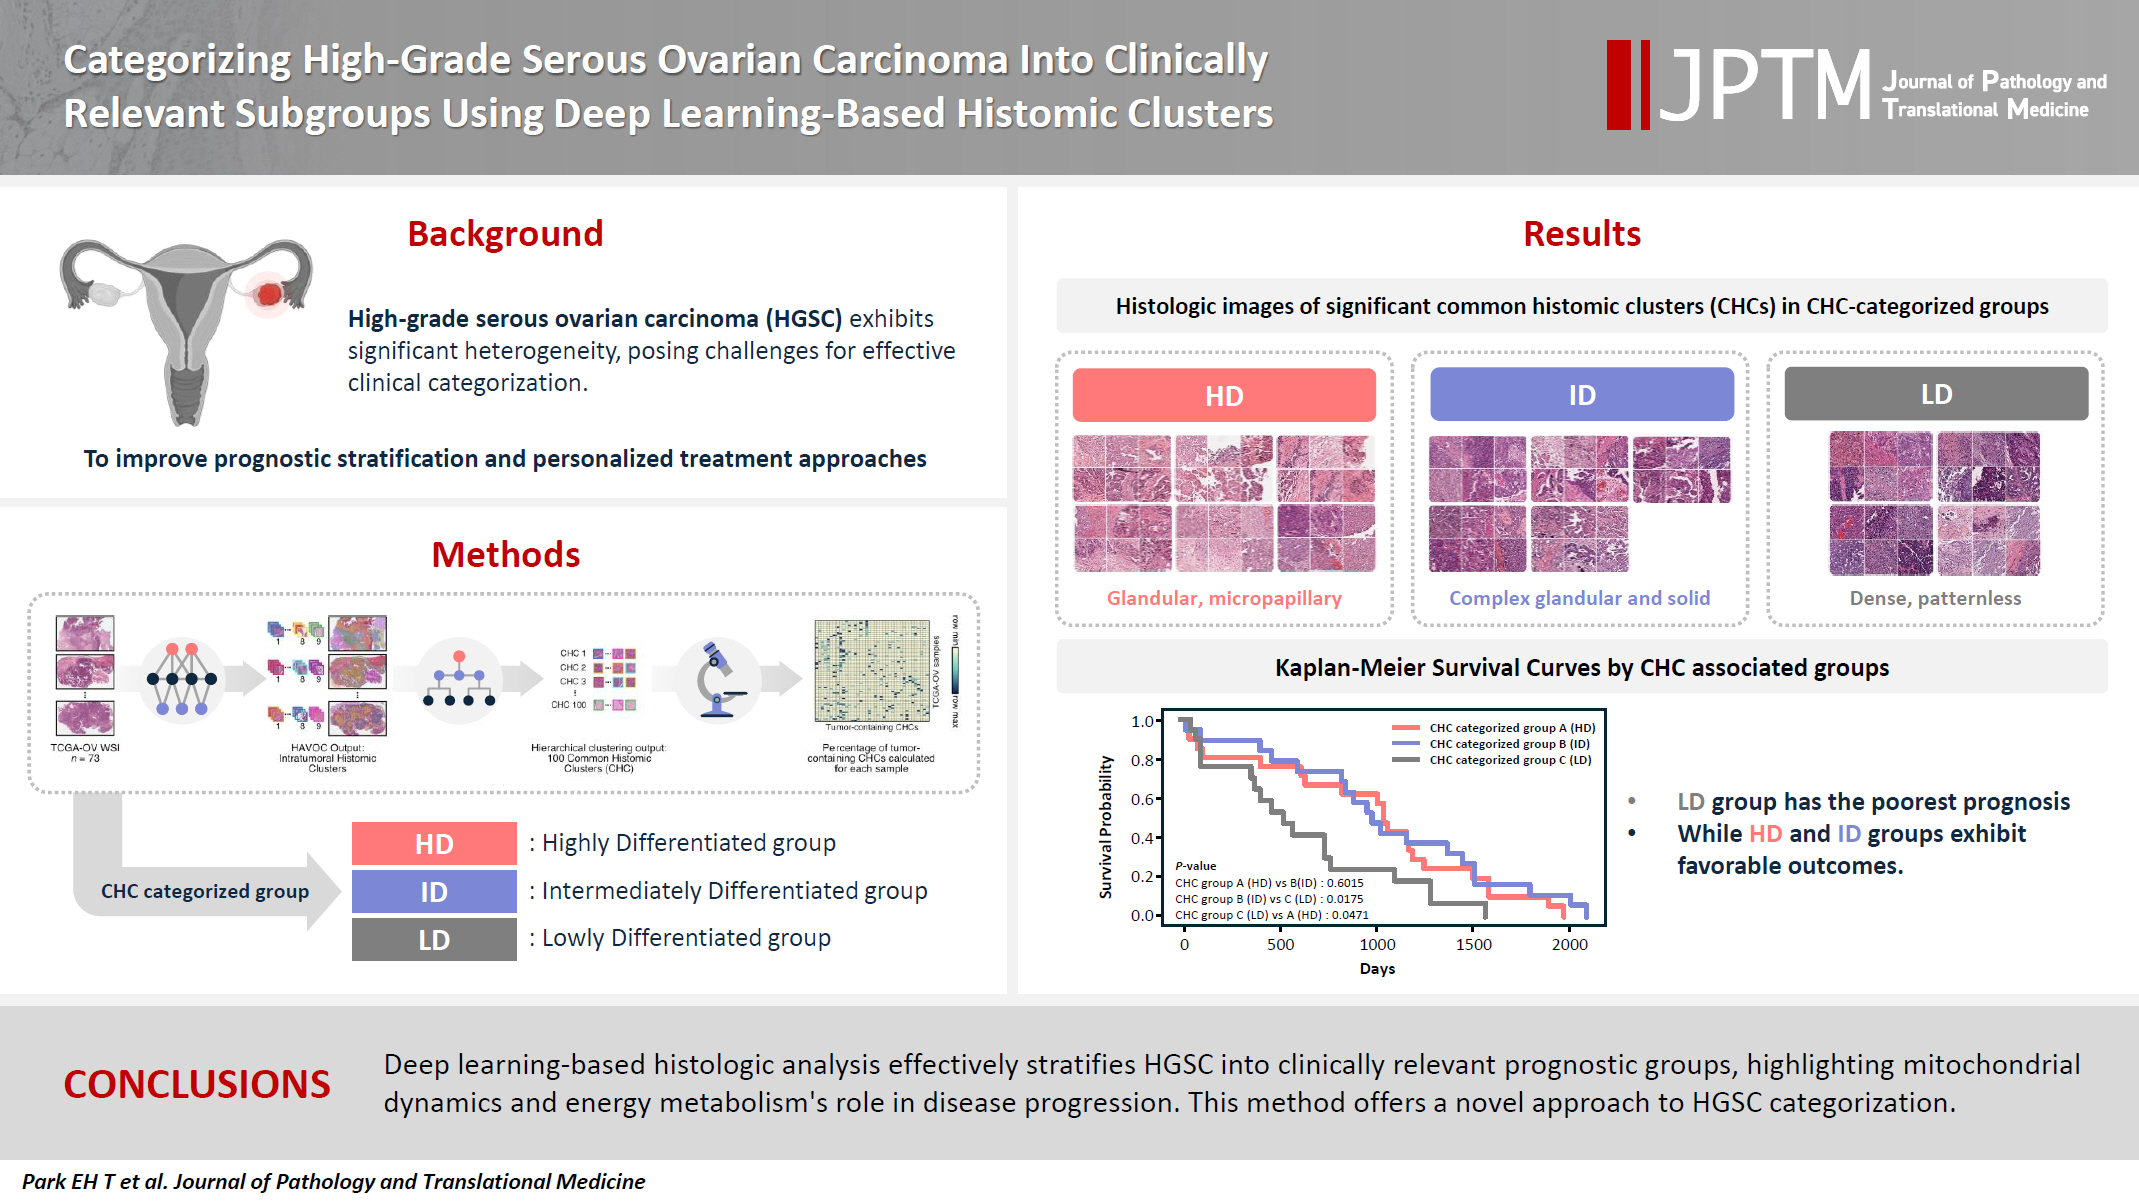


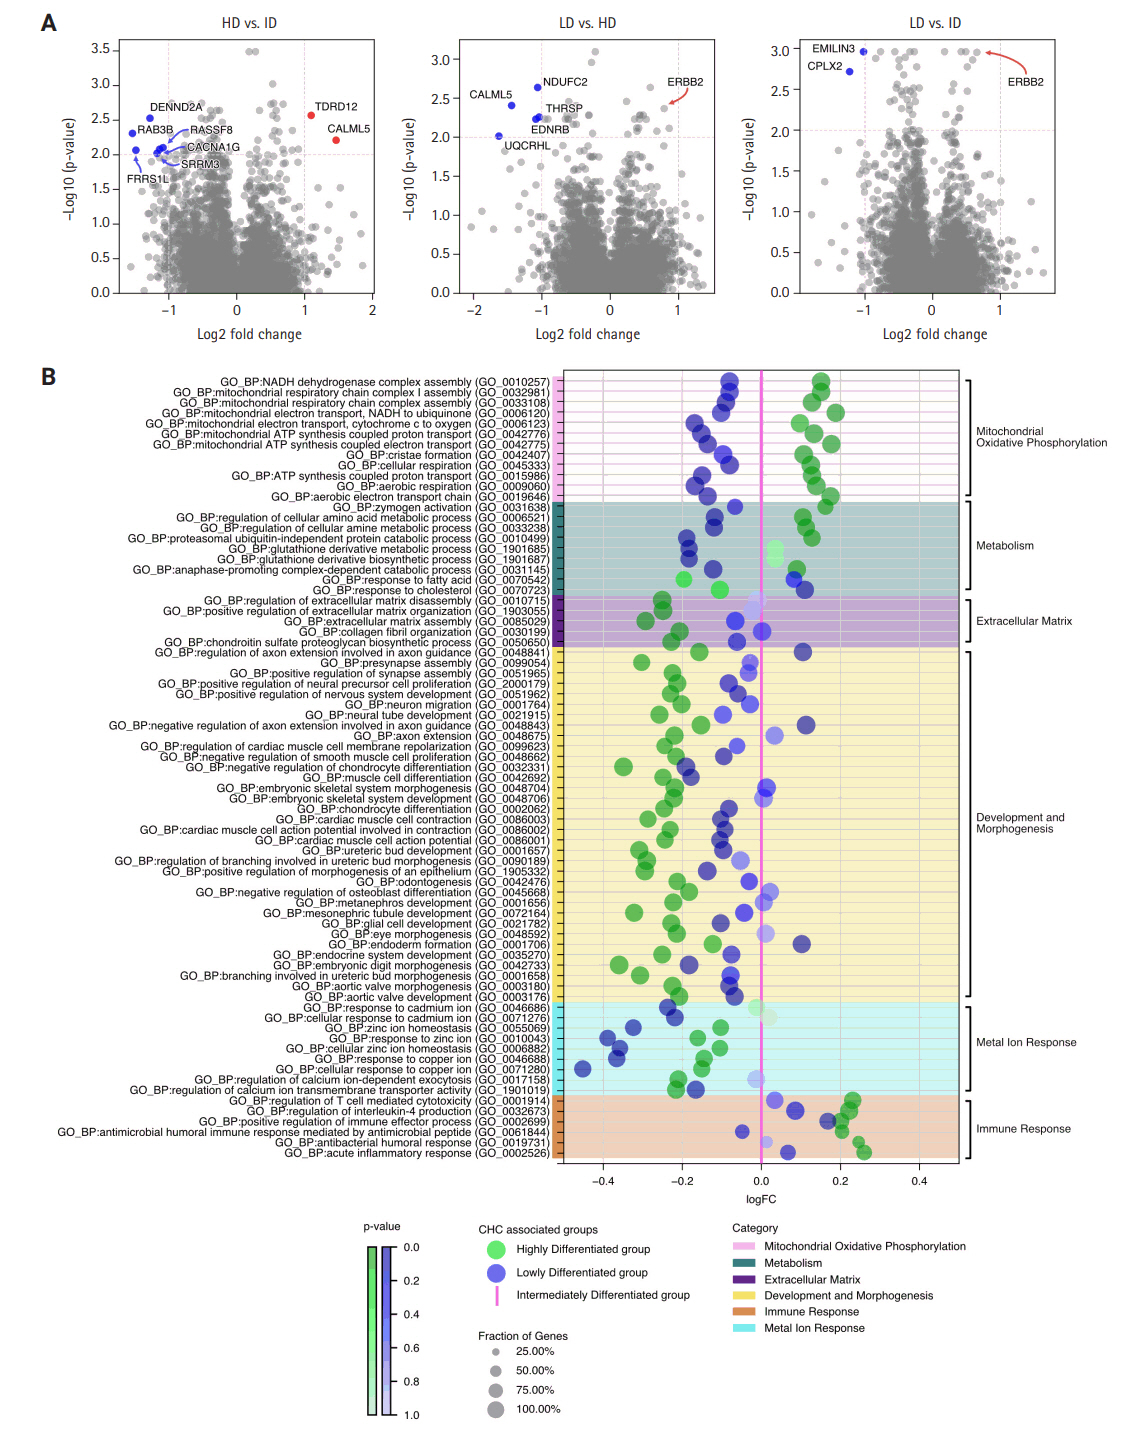


Fig. 1.
Fig. 2.
Fig. 3.
Fig. 4.
Fig. 5.
Graphical abstract
| Characteristic | All samples (n = 73) | Group A |
Group B |
Group C |
p-value |
|---|---|---|---|---|---|
| HD group (n = 22) | ID group (n = 27) | LD group (n = 24) | |||
| Age (yr) | .471 | ||||
| <63 | 34 (46.6) | 8 (36.4) | 13 (48.1) | 13 (54.2) | |
| ≥63 | 39 (53.4) | 14 (63.6) | 14 (51.9) | 11 (45.8) | |
| FIGO stage | .651 | ||||
| IIC | 1 (1.4) | 0 | 1 (3.7) | 0 | |
| IIIC | 56 (76.7) | 18 (81.8) | 19 (70.4) | 19 (79.2) | |
| IV | 15 (20.5) | 4 (18.2) | 7 (25.9) | 4 (16.7) | |
| Unknown | 1 (1.4) | 0 | 0 | 1 (4.2) | |
| Molecular classification | .523 | ||||
| Differentiated | 18 (24.7) | 5 (22.7) | 9 (33.3) | 4 (16.7) | |
| Immunoreactive | 10 (13.7) | 4 (18.2) | 3 (11.1) | 3 (12.5) | |
| Mesenchymal | 16 (21.9) | 6 (27.3) | 4 (14.8) | 6 (25.0) | |
| Proliferative | 29 (39.7) | 7 (31.8) | 11 (40.7) | 11 (45.8) | |
| HRD status | .471 | ||||
| HRD | 34 (46.6) | 9 (40.9) | 15 (55.6) | 10 (41.7) | |
| Non-HRD | 34 (46.6) | 10 (45.5) | 10 (37.0) | 14 (58.3) | |
| Unknown | 5 (6.8) | 3 (13.6) | 2 (7.4) | 0 |
| Overall survival | Qualitative histologic analysis | Quantitative histologic analysis |
RNA sequencing |
||||||
|---|---|---|---|---|---|---|---|---|---|
| Cell features | Color features | Mt & Metab | ECM | Dev & Morph | Metal ion response | Immune response | |||
| Highly differentiated (HD) group | Favorable | Low tumor-to-stromal ratio | Low tumor cell density | High eosin with low hematoxylin staining | +++ | + | + | ++ | +++ |
| High variability among CHCs | Low stromal cell density | ||||||||
| High pleomorphism of tumor cells | Significant nuclei size variations among CHCs | ||||||||
| Includes glandular and micropapillary patterns | Irregular tumor nuclei shape with low circularity and solidity across CHCs | ||||||||
| Intermediately differentiated (ID) group | Favorable | Intermediate tumor-to-stromal ratio | Intermediate tumor cell density | Balanced hematoxylin and eosin staining | ++ | +++ | +++ | +++ | ++ |
| Peritumoral cleft-like spaces | Low stromal cell density | ||||||||
| Includes complex glandular to solid patterns | Large, circular, and solid nuclei | ||||||||
| Little nuclei size variations | |||||||||
| Lowly differentiated (LD) group | Poor | High tumor-to-stromal ratio | High tumor cell density | High hematoxylin and low eosin staining | + | +++ | ++/+++ | + | + |
| Complete patternless sheet-like structure | Low stromal cell density | ||||||||
| Peritumoral cleft-like spaces | Large, circular, and solid nuclei | ||||||||
| Little nuclei size variations | |||||||||
Values are presented as number (%). TCGA-OV, The Cancer Genome Atlas dataset for ovarian cancer; HD, highly differentiated; ID, intermediately differentiated; LD, lowly differentiated; FIGO, International Federation of Gynecology and Obstetrics; HRD, homologous recombination deficiency. Chi-squared test of independence was used to compare the three common histomic cluster–categorized groups.
CHC, common histomic cluster; Mt & Metab, mitochondria and metabolism; ECM, extracellular matrix; Dev & Morph, development and morphogenesis. Legend for RNA sequencing symbols: "+" indicates low expression, "++" represents moderate expression, and "+++" signifies high expression levels across the various categories.

