 E-submission
Articles
- Page Path
- HOME > J Pathol Transl Med > Volume 60(1); 2026 > Article
-
Original Article
The significance of papillary architecture in the follow-up biopsies of patients with progestin-treated atypical endometrial hyperplasia -
Wangpan J. Shi
 , Oluwole Fadare
 -
Journal of Pathology and Translational Medicine 2026;60(1):58-68.
DOI: https://doi.org/10.4132/jptm.2025.09.12
Published online: January 8, 2026
Department of Pathology, University of California San Diego, San Diego, CA, USA
- Corresponding Author Oluwole Fadare, MD, Department of Pathology, Anatomic Pathology Division, University of California San Diego Health, 9300 Campus Point Drive, Suite 1-200, MC 7723, La Jolla, CA 92037, USA Tel: +1-858-657-6772, Fax: +1-858-657-5495, E-mail: Oluwole.fadare@gmail.com
*A preliminary version of this work was presented at the Annual Meeting of the United States and Canadian Academy of Pathologists Annual Meeting, Boston, MA, USA, March 2025.
© The Korean Society of Pathologists/The Korean Society for Cytopathology
This is an Open Access article distributed under the terms of the Creative Commons Attribution Non-Commercial License (http://creativecommons.org/licenses/by-nc/4.0) which permits unrestricted non-commercial use, distribution, and reproduction in any medium, provided the original work is properly cited.
- 2,847 Views
- 315 Download
Abstract
-
Background
- Follow-up biopsies in patients with progestin-treated atypical endometrial hyperplasia/endometrioid intraepithelial neoplasia (AH/EIN) may show papillary structures, the significance of which is unclear.
-
Methods
- The authors reviewed 253 serial specimens of 84 consecutive patients diagnosed with AH/EIN, inclusive of each patient's pre-progestin treatment sample and all post-treatment specimens. We assessed the predictive relationship between papillary architecture in a post-treatment biopsy and two study outcomes: AH/EIN or carcinoma in at least one sample subsequent to the one in which papillae were identified, and/or the last specimen received for that patient.
-
Results
- Papillae were identified in only 51.5% of pre-treatment samples but were present in at least one subsequent post-treatment sample for all patients. Post-treatment samples that exhibited papillae and no glandular crowding were associated with AH/EIN in at least one subsequent specimen in 39.7% (29/73) of cases, compared to 24.0% (6/25) in samples with neither papillae nor glandular crowding (p = .227) and 64.0% (16/25) in samples with concurrent gland crowding and papillae (p = .048). Univariate logistic regression analyses showed that the presence of papillae was not associated with study outcomes (odds ratio [OR], 0.99; 95% confidence interval [CI], 0.49 to 1.99; p = .985), as compared with gland crowding (OR, 1.54; 95% CI, 1.04 to 2.27; p = .031), or concurrent papillae and gland crowding (OR, 2.36; 95% CI, 1.01 to 5.52; p = .048).
-
Conclusions
- In post-treatment samples of progestin-treated AH/EIN, the presence of papillary architecture was not demonstrably associated with study outcomes independent of gland crowding, although the concurrent presence of both features may be significantly predictive.
- Atypical endometrial hyperplasia/endometrioid intraepithelial neoplasia (AH/EIN) is generally considered to be the immediate precursor lesion to endometrial endometrioid carcinoma, one that confers a substantial risk of concurrent carcinoma or if left untreated, progression [1-7]. Surgical resection of the uterus is widely recognized as definitive treatment for AH/EIN [8]. However, for women who desire fertility, are poor surgical candidates due to medical comorbidities, or who decline surgical intervention for other reasons, progestin therapies have gained widespread use in recent decades [8-10]. Progestin-based therapies may include medroxyprogesterone acetate, depot medroxyprogesterone, micronized vaginal progesterone, megestrol acetate, and a levonorgestrel intrauterine system, among others [3,9,10]. Patients on progestin-based therapies require close surveillance and follow-up biopsies to assess for efficacy of treatments, as inferred from the persistence, regression or progression of disease [1,9-11]. The pathologist’s determination is arguably central to this process, which highlights the importance of accuracy, reproducibility, and consistency of reporting in the evaluation of those follow-up biopsies [11-14]. However, although the diagnostic criteria for AH/EIN are relatively well established, progestin treatments may induce cytoarchitectural changes therein that render those derangements more difficult to recognize, criteria more challenging to apply, and that overall may engender significant uncertainty about the presence or absence of residual disease in a given sample [11,12,15,16]. One particular architectural alteration that may be encountered in the follow-up endometrial samples of a patient on progestin treatment is papillary change, especially when devoid of concurrent glandular crowding. The significance of these structures, and whether they truly denote residual hyperplasia, has never been fully defined. This study aims to comprehensively characterize the significance of papillary structures in this setting.
INTRODUCTION
- Case selection
- The laboratory information system at an academic medical center was queried for all diagnosed cases of AH/EIN during a 10-year period. From an initial dataset, we excluded cases in which the diagnosis of AH/EIN was not made in a sampling specimen, duplications, patients with no follow-up samples subsequent to the index biopsy, patients with index diagnoses of non-atypical hyperplasia, and patients with a diagnosis of AH/EIN concurrent with carcinoma. Various subsidiary analyses called for analysis-specific exclusions, as detailed in Fig. 1. For this report, a “sample” refers to tissue from an endometrial biopsy or curettage, whereas “specimen” refers to tissue from an endometrial biopsy, endometrial curettage, or uterus resection. The sample on which the original diagnosis of AH/EIN was rendered is the “index” or “pre-treatment” sample, whereas samples obtained on follow-up (i.e., after the initiation of treatment) are referred to as “post-treatment” or “follow-up” samples.
- Morphologic review
- Slides for all samples (mean, 3.0 ± 2.5 slides/patient) were retrieved and reviewed jointly by the authors, inclusive of the index and all follow-up samples, with the aim of identifying the presence of papillary architecture of any type, describing their morphologic spectrum, and any concurrent pathological processes that may be present. For every case, we documented the presence of papillary structures and estimated the proportion of the specimen that they represented. A papillary structure was defined as a round, oval or filigree structure, at least 75% covered by epithelium, and harboring a stromal or fibrovascular core (Fig. 2). Large bulbous, polypoid structures with prominently pseudodecidualized stroma were not included, given that it is well recognized that such structures are common endometrial alterations associated with exogenous progestins in non-hyperplastic endometrium (Fig. 3) [17,18]. Additionally, we documented for each sample the presence of papillae branching as a surrogate indicator of architectural complexity, with subcategorization to no branching, simple (one level) branching off a central stalk irrespective of the number of such branches, and complex (≥two level) branching (i.e. the presence in the sample of at least one central stalk that gives rise to a primary branch, from which a secondary and possibly tertiary branch originate). We also evaluated other morphologic features that are relevant to the diagnoses of AH/EIN, including glandular crowding, cytologic demarcation/atypia, intraglandular architectural complexity, squamous morules, metaplastic changes, cystic structures (presence, whether they are crowded, and whether they are lined by atrophic-appearing or non-atrophic appearing epithelium), and pseudodecidual stromal change.
- Follow-up and analytic outcomes
- The central study questions were (1) whether the presence of papillary architecture in any sample was significantly associated with an increased likelihood of residual AH/EIN or carcinoma in subsequent specimens for that patient; (2) whether papillae characteristics: complexity of papillae, volume of papillae were similarly associated with an increased likelihood of residual AH/EIN or carcinoma in subsequent specimens for that patient. Accordingly, papillary architecture was not used in our analytic definition of AH/EIN. Rather, AH/EIN in post-treatment samples was defined primarily by criteria outlined in the 5th edition of the World Health Organization Classification, i.e., cytologically-demarcated glandular confluence/crowding (i.e., area of glands exceeds the stroma) [19]. We utilized two outcomes to assess for the significance of papillary architecture in post-treatment specimens. Outcome-1 was defined by the presence of AH/EIN or carcinoma in at least one sample subsequent to the sample in which the papillary structures were identified. Outcome-2 was defined by the presence of AH/EIN or carcinoma in the last specimen that was received for that patient. The dualistic outcomes facilitated a more robust assessment of any AH/EIN or carcinoma that were subsequent to the identification of papillary structures in a post-treatment sample, inclusive of those from patients that went to hysterectomy after the sample in which papillae were identified, as well as those from patients that continued to receive follow-up samplings and that never underwent a resection.
- Statistics
- SPSS ver. 29.0.2.0 software (IBM Corp., Armonk, NY, USA) was used for statistical analyses. Categorical and continuous variables were assessed using Chi-square tests and independent T-tests, respectively. For analysis that included small numbers, the Fisher exact test was used. A univariate logistic regression analysis was conducted to further evaluate any association between papillae, gland crowding, and the concurrent presence of both with study outcomes. p < .05 was considered statistically significant in all analyses.
MATERIALS AND METHODS
- General description of the cohort
- In total, we studied 253 specimens from 84 patients with a diagnosis of AH/EIN in a sampling specimen. The average age of these patients was 52.4 years (± 14.7). Thirty-four of the 84 patients (40.5%) underwent a hysterectomy immediately after their index biopsies, whereas the remaining 50 (59.5%) were treated with various oral and intrauterine progestins, followed by follow-up biopsies. Among the latter group, 14.3% ultimately underwent a hysterectomy.
- Papillary architecture in pre-treatment samples and samples with progestin treatment
- Among the 33 index endometrial samples, 17 (51.5%) had at least focal papillary architecture. The average percentage of index samples displaying papillary architecture was 11.2% (± 12.1) when present. Papillary architecture was present in at least one post-treatment sample of every patient irrespective of the presence or absence of such architecture in their pre-treatment samples. Group analysis of the 33 patients showed that as a group, papillary architecture was observed more frequently in post-treatment samples than in pretreatment samples (89.2% vs. 51.5%, p = .001). Furthermore, the average percentage of the sample comprised of papillae was substantially higher in the post-treatment than in the pretreatment samples (23.8 ± 19.0 vs. 11.2 ± 12.1, p = .001).
- Subgroup analysis in post-treatment samples
- In this subgroup analysis, we sought to determine the significance of papillary architecture (separate from gland crowding) in post-treatment samples by evaluating their association with AH/EIN or carcinoma in at least one subsequent specimen. Accordingly, in addition to the sample in which the papillae were identified, the index/pretreatment samples and the last biopsy sample for each patient were excluded as the former were irrelevant and the latter constituted an analytic end point for patients that never underwent a resection. The post-treatment samples were categorized into four groups in Table 1. Briefly, the percentage of samples with AH/EIN or carcinoma in at least one sample subsequent to the one in which papillae were initially identified, were 39.7%, 64.0%, 24.0%, and 44.4% respectively for group 1 (papillae present, gland crowding absent), group 2 (papillae and gland crowding both present), group 3 (gland crowding and papillae were both absent) and group 4 (gland crowding present, papillae absent). When the 4 groups were compared to each other regarding the frequency of outcome-1 (i.e. AH/EIN or carcinoma in at least one subsequent sample), the group 2 versus group 3 comparison showed a statistically significant difference (64.0% vs. 24.0% respectively; p = .010); Concurrent gland crowding and papillae (group 2) was associated with a significantly higher rate of outcome results compared to papillae alone (group 1) (64.0% vs. 39.7%, p = .040). Also notable was the absence of any significant difference between group 1 and group 3 regarding the frequency of the study outcomes. Results from a univariate logistic regression analysis showed that the presence of papillary architecture was not significantly associated with study outcomes (odds ratio [OR], 0.99; 95% confidence interval [CI], 0.49 to 1.99; p =.985), in contrast with glandular crowding (OR, 1.54; 95% CI, 1.04 to 2.27; p = .031), and the concurrent presence of papillae and glandular crowding (OR, 2.36; 95% CI, 1.01 to 5.52; p = .048). In a subsidiary analysis in which the cohort were grouped based only on the first post-treatment sample, concurrent gland crowding and papillae (group 2) was associated with a significantly higher rate of outcome results compared to papillae alone (group 1) (91.6% vs. 42.8%, p = .009) (Table 2).
- Analysis of post-treatment samples from group 1 patients
- Group 1 cases (papillary architecture and no gland crowding in a post-treatment sample) were more expansively assessed, since their significance constituted a central study question. There were 73 post-treatment samples from 21 patients in this group. We assessed the association of various papillae features (percentage of sample with papillary architecture, complexity of papillae) with two outcome measures (outcome-1, outcome-2) compared to controls (absence of AH/EIN or carcinoma in any follow-up specimen). Findings are detailed in Table 3, and show that (1) the proportion of the sample with papillary architecture was significantly higher than controls for those group 1 patients that were found to have AH/EIN or carcinoma in a subsequent sample; (2) neither the presence nor degree of papillae branching significantly distinguished cases that were ultimately associated with outcome-1 and 2 from those that were not.
- Significance of papillary architecture “persistence”
- For current analytic purposes, persistence of papillary architecture was defined as the scenario wherein at least two post-treatment biopsies showed papillary architecture in the absence of concurrent glandular crowding. Among the 33 patients who had index biopsies with post-treatment samples, 20/33 (60.7%) had more than two follow-up samples taken (not inclusive of the final sample or resection specimen). Among these patients, 16/20 (80.0%) had persistent papillary architecture, 11/33 (33.3%) had one follow-up sample with papillary architecture, and 6/33 (18.2%) had follow-up samples without persistent papillary architecture. The frequency of outcomes-1 or -2 in these three groups were 43.7%, 36.4%, and 33.3%, respectively (p > .99). A representative case in which there was persistent papillary architecture in nine post-treatment samples over time is shown in Fig. 4.
- Microscopic findings in post-treatment samples associated with residual AH/EIN or carcinoma
- Table 4 outlines findings from a subsidiary analysis that was designed to identify morphologic findings that were significantly more prevalent in the group of samples for which there was a diagnosis of AH/EIN or carcinoma in a subsequent specimen (i.e., outcomes-1 and -2) irrespective of progestin-treatment response. Sixty-seven post-treatment samples for which there was a subsequent diagnosis of AH/EIN or carcinoma (in a post-treatment biopsy or resection specimen, study group) were compared with 101 post-treatment samples for which there were no subsequent diagnoses of AH/EIN or carcinoma (control group), regarding a variety of morphologic findings. Features that were significantly more prevalent in the study group include glandular crowding, glandular crowding concurrent with papillae, and cytologic demarcation. Table 4 also shows that there was no linear association between the percentage of the sample with papillary architecture and the likelihood of residual AH/EIN or carcinoma in subsequent specimens. Briefly, papillae in >10% and >20% (but not >30% or >40%) of the sample were more significantly more frequent in the study group than the control group. However, even at the >10% or >20% levels, the addition of concurrent glandular crowding eliminates the statistical significance of the difference between the study and control groups. The presence of squamous morules, crowded cysts, mucinous metaplasia, degree of papillary branching, or surface micropapillae showed no statistically significant difference in frequency between the two groups.
RESULTS
- A wide variety of cytoarchitectural alterations may be observed in samples of progestin-treated AH/EIN, including a relative decrease in gland-to-stroma ratio, nuclear size, mitotic index, and nucleus-to-cytoplasm ratio, “acquisition” of various metaplasias (including increase in cytoplasmic eosinophilia), changes in chromatin pattern and prominence of nucleoli, surface micropapillary architecture, glandular cystic dilatation, and in some cases, an apparent “increase” in architectural complexity relative to the pre-treatment sample [15,16]. The diagnostic challenge for the pathologist is in the identification and “interpretation” of individual features or combinations of features, and how well such interpretations predict the likelihood that disease is present. A 2022 survey suggests that there remains significant interobserver variability amongst practitioners in these interpretations [12].
- In the current study, the authors evaluate the significance of a specific architectural alteration that in our experience, is not uncommonly observed in this setting: papillary change. A few studies have previously addressed the issue, albeit peripherally: In one study of progestin-treated AH/EIN and carcinoma, “cribriform/papillary changes” were noted to be present in 59.1% of the patient samples associated with eventual complete response to treatment, as compared with 40.9% of those without complete response, and the presence of “cribriform or papillary glandular pattern” was not associated with complete response on univariate analyses [20]. In another study, “cribriform and/or papillary pattern” were presumed to be indicative of glandular confluency for analytic purposes [15]. Mentrikoski et al. [16] noted that prominent papillae may be observed in this setting after several months of treatment. Finally, the authors of the aforementioned survey on the issue considered “foci of crowded glands and/or papillary architecture” to be indicative of residual hyperplasia [12]. None of the above studies, however, specifically assessed papillary change as an individual variable. In the current study, we made no baseline assumptions about the significance of papillary architecture, but sought to determine what the presence, qualitative, and quantitative features of such architecture might indicate in a post-treatment sample regarding the likelihood of residual hyperplasia (defined by glandular crowding/confluency) or carcinoma in subsequent samples and specimens.
- We highlight a few central findings: First, although papillae were present in only 51.5% of index (pre-treatment) samples, they were present in at least one post-treatment sample for every patient independent of their presence or absence in the corresponding pre-treatment sample. This finding suggests that papillary architecture in the studied setting is a change that develops, or becomes more apparent with progestin-treatment. When index and post-treatment biopsies were compared, the latter showed a significantly higher frequency of papillary architecture. Findings from our analysis of the four post-treatment groups, including the most study-germane group 1, addresses the central study questions. Our study showed that in group 1 samples (papillae and no gland crowding), 39.7% showed AH/EIN or carcinoma in at least one subsequent specimen. However, corresponding proportions in samples without any abnormalities (group 3) and samples with glandular crowding only (group 4) were 24.0% and 44.4% respectively. Notably, group 1 was not associated with a significantly higher frequency of the AH/EIN or carcinoma end points than group 3, casting doubt on the significance of papillae as an isolated variable in a post-treatment sample (i.e., in the absence of concurrent glandular crowding). More extensive analysis of group 1 cases highlighted the significance of the various papillae types. This analysis showed that the average percentage of samples with papillae was significantly higher in samples that were associated with outcomes-1 and -2 than those that were not (Table 3). Therefore, we considered the possibility that it is the “extensiveness” of papillary architecture that is significant, rather than the mere “presence” of papillary architecture. Our group analysis of all post-treatment samples, as outlined in Table 4, compared the frequencies of various pathologic features in patients with and without the analytic end-point (AH/EIN or carcinoma in a subsequent specimen). The frequency of papillary architecture was not significantly different between the two groups. Although more extensive papillary growth was seen in patient with a diagnosis of AH/EIN or carcinoma in a subsequent sample than in patients without such diagnoses, this was not independent of glandular crowding. Moreover, incrementally extensive presence of papillary growth was not clearly associated with residual AH/EIN or carcinoma. The practical implication of these findings may be that a post-treatment sample that displays papillary architecture as the only abnormal finding simply raises the possibility of unsampled glandular crowding but is not in and of itself diagnostic of residual hyperplasia. In the current analysis, the OR for study outcomes in the papillae + glandular crowding group was higher than the OR for the glandular crowding group, raising the possibility that the addition to papillae to glandular crowding increases the risk of study outcomes than would otherwise be associated with glandular crowding alone. However, the margin of error for that subsidiary analysis was estimated to be high given the wide confidence interval. As such, analyses with larger datasets will be required to conclusively settle the question.
- The present study has some additional limitations that should be considered when assessing the significance of the findings. Although we evaluated a large number of samples, the overall cohort size is relatively small, which limited consideration of potentially relevant variables such as highly complex papillae or necrotic papillae, both of which had a low prevalence in our cohort. Second, our outcome measures may be distorted if papillae are indeed a manifestation of hyperplasia, since we excluded papillae in our definition of AH/EIN to allow for an analysis of its significance. A follow-up sample inherently only gives a partial portrait of the disease in the uterus when the biopsy was taken, and it is unclear whether a longer follow-up timeline than was present in our cohort is required to identify the significance of papillary structures. Molecular and immunohistochemical biomarkers of potential utility were not considered due to the intentional emphasis on morphologic features and the current inability of aberrant phenotypes to serve as a diagnostic gold standard. Duration of treatment and biopsy sample intervals were not specifically analyzed given the size of our sample as well as the fact the decision faced by the diagnostic pathologist on the significance of a papillary structure in a given sample is not significantly influenced by these factors. The key strength of the study is that it is the first to comprehensively analyze this group of patients and that specifically assessed the significance of papillary architecture in the setting of progestin-treatment surveillance.
- In summary, in post-treatment samples of AH/EIN, the presence of papillary architecture in and of itself was not associated with a significantly higher likelihood of AH/EIN or carcinoma in a subsequent specimen, compared to specimens without any abnormalities. Glandular crowding, as well as glandular crowding concurrent with papillae, were found to be predictors of subsequent residual AH/EIN or carcinoma in this setting.
DISCUSSION
Ethics Statement
Research involving Human Participants and/or Animals: This work was approved by the Human Research and Protection Program at the University of California San Diego (IRB#190068 and #191204), along with a waiver of consent.
Availability of Data and Material
The datasets generated or analyzed during the study are available from the corresponding author on reasonable request.
Code Availability
Not applicable.
Author Contributions
Conceptualization: WJS, OF. Data curation: WJS, OF. Formal analysis: WJS, OF. Investigation: WJS, OF. Funding acquisition: WJS, OF. Methodology: WJS, OF. Project administration: WJS, OF. Resources: WJS, OF. Software: WJS, OF. Supervision: OF. Validation: WJS, OF. Visualization: WJS. Writing—original draft: WJS, OF. Writing—review & editing: WJS, OF. Approval of final manuscript: all authors.
Conflicts of Interest
The authors declare that they have no potential conflicts of interest.
Funding Statement
No funding to declare.


- 1. Lacey JV Jr, Sherman ME, Rush BB, et al. Absolute risk of endometrial carcinoma during 20-year follow-up among women with endometrial hyperplasia. J Clin Oncol 2010; 28: 788-92. ArticlePubMedPMC
- 2. Giannella L, Grelloni C, Bernardi M, et al. Atypical endometrial hyperplasia and concurrent cancer: a comprehensive overview on a challenging clinical condition. Cancers (Basel) 2024; 16: 914.ArticlePubMedPMC
- 3. Ring KL, Mills AM, Modesitt SC. Endometrial hyperplasia. Obstet Gynecol 2022; 140: 1061-75. ArticlePubMed
- 4. Doherty MT, Sanni OB, Coleman HG, et al. Concurrent and future risk of endometrial cancer in women with endometrial hyperplasia: a systematic review and meta-analysis. PLoS One 2020; 15: e0232231. ArticlePubMedPMC
- 5. Pennant S, Manek S, Kehoe S. Endometrial atypical hyperplasia and subsequent diagnosis of endometrial cancer: a retrospective audit and literature review. J Obstet Gynaecol 2008; 28: 632-3. ArticlePubMed
- 6. Rakha E, Wong SC, Soomro I, et al. Clinical outcome of atypical endometrial hyperplasia diagnosed on an endometrial biopsy: institutional experience and review of literature. Am J Surg Pathol 2012; 36: 1683-90. ArticlePubMed
- 7. Trimble CL, Kauderer J, Zaino R, et al. Concurrent endometrial carcinoma in women with a biopsy diagnosis of atypical endometrial hyperplasia: a Gynecologic Oncology Group study. Cancer 2006; 106: 812-9. ArticlePubMed
- 8. Management of endometrial intraepithelial neoplasia or atypical endometrial hyperplasia: ACOG clinical consensus No. 5. Obstet Gynecol 2023; 142: 735-44. ArticlePubMed
- 9. Chandra V, Kim JJ, Benbrook DM, Dwivedi A, Rai R. Therapeutic options for management of endometrial hyperplasia. J Gynecol Oncol 2016; 27: e8. ArticlePubMedPDF
- 10. Kim MK, Seong SJ. Conservative treatment for atypical endometrial hyperplasia: what is the most effective therapeutic method? J Gynecol Oncol 2014; 25: 164-5. ArticlePubMedPMC
- 11. Zheng W, Fadare O, Quick CM. Unveiling residual diseases of endometrial precancer/cancer after progestin therapy. In: Zheng W, Fadare O, Quick CM, eds. Gynecologic and obstetric pathology. Singapore: Springer, 2024; 1-34.
- 12. Ganesan R, Gilks CB, Soslow RA, McCluggage WG. Survey on reporting of endometrial biopsies from women on progestogen therapy for endometrial atypical hyperplasia/endometrioid carcinoma. Int J Gynecol Pathol 2022; 41: 142-50. ArticlePubMedPMC
- 13. Williams AT, Ganesan R. Role of the pathologist in assessing response to treatment of ovarian and endometrial cancers. Histopathology 2020; 76: 93-101. ArticlePubMedPDF
- 14. Chang RJ, Rivera-Colon G, Chen H, et al. Navigating through perplex morphologic changes after exogenous hormone usage. Semin Diagn Pathol 2022; 39: 148-58. ArticlePubMed
- 15. Wheeler DT, Bristow RE, Kurman RJ. Histologic alterations in endometrial hyperplasia and well-differentiated carcinoma treated with progestins. Am J Surg Pathol 2007; 31: 988-98. ArticlePubMed
- 16. Mentrikoski MJ, Shah AA, Hanley KZ, Atkins KA. Assessing endometrial hyperplasia and carcinoma treated with progestin therapy. Am J Clin Pathol 2012; 138: 524-34. ArticlePubMed
- 17. Phillips V, Graham CT, Manek S, McCluggage WG. The effects of the levonorgestrel intrauterine system (Mirena coil) on endometrial morphology. J Clin Pathol 2003; 56: 305-7. ArticlePubMedPMC
- 18. Hejmadi RK, Chaudhri S, Ganesan R, Rollason TP. Morphologic changes in the endometrium associated with the use of the mirena coil: a retrospective study of 106 cases. Int J Surg Pathol 2007; 15: 148-54. ArticlePubMedPDF
- 19. Lax SF, Mutter GL. Endometrial atypical hyperplasia/endometrioid intraepithelial neoplasia. In: WHO Classification of Tumours Editorial Board, ed. WHO classification of tumours: female genital tumours. 5th ed. Vol. 4. Lyon: International Agency for Research on Cancer, 2020; 250-1.
- 20. Gunderson CC, Dutta S, Fader AN, et al. Pathologic features associated with resolution of complex atypical hyperplasia and grade 1 endometrial adenocarcinoma after progestin therapy. Gynecol Oncol 2014; 132: 33-7. ArticlePubMed
REFERENCES
Figure & Data
References
Citations
 PubReader
 ePub Link
-
 Cite this Article
- Cite this Article
-
- Close
- Download Citation
- Close
- Figure
-
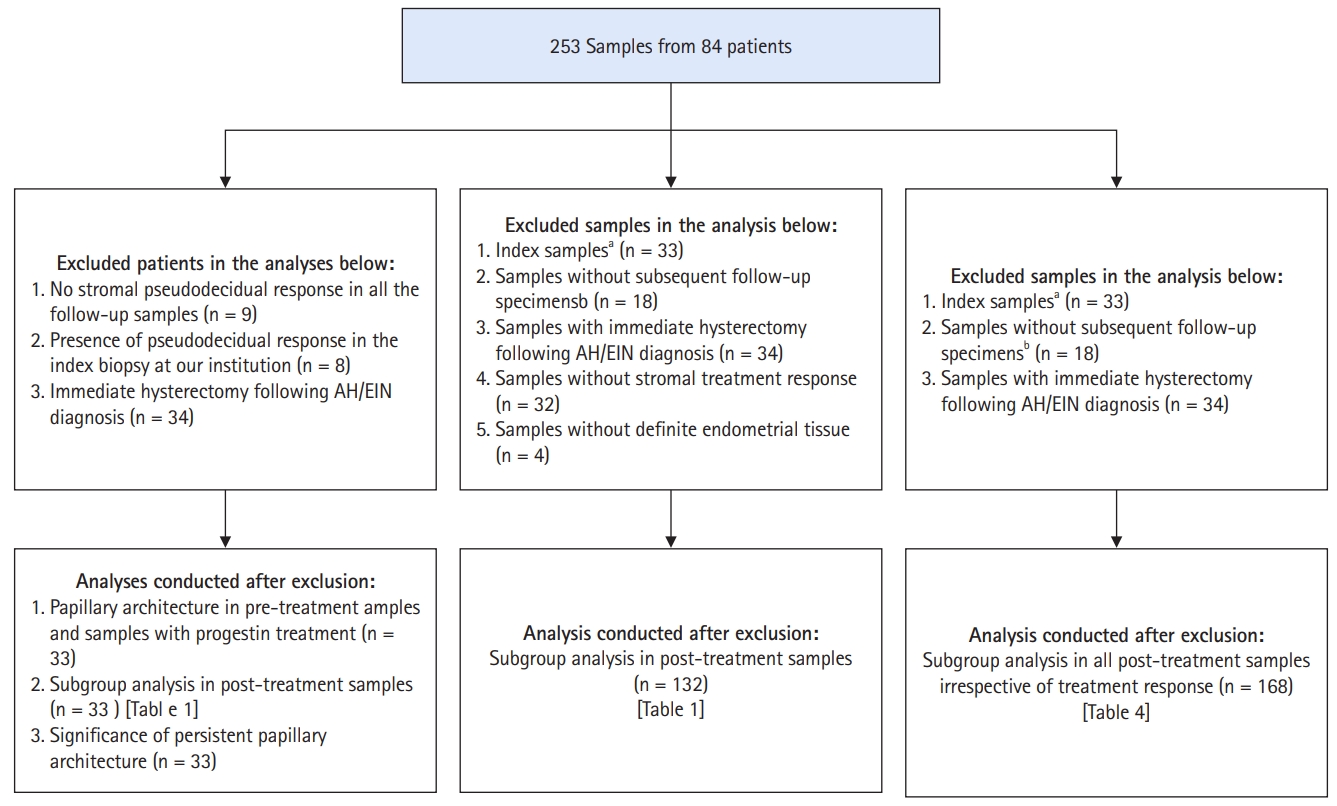
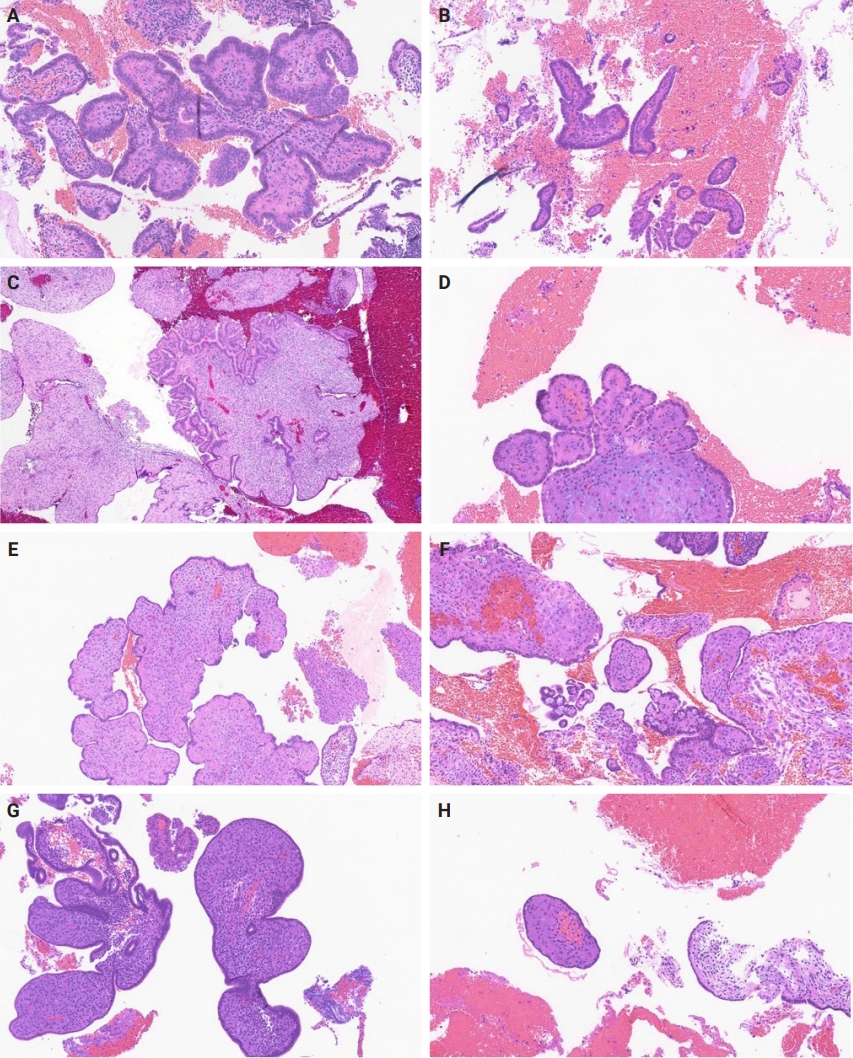
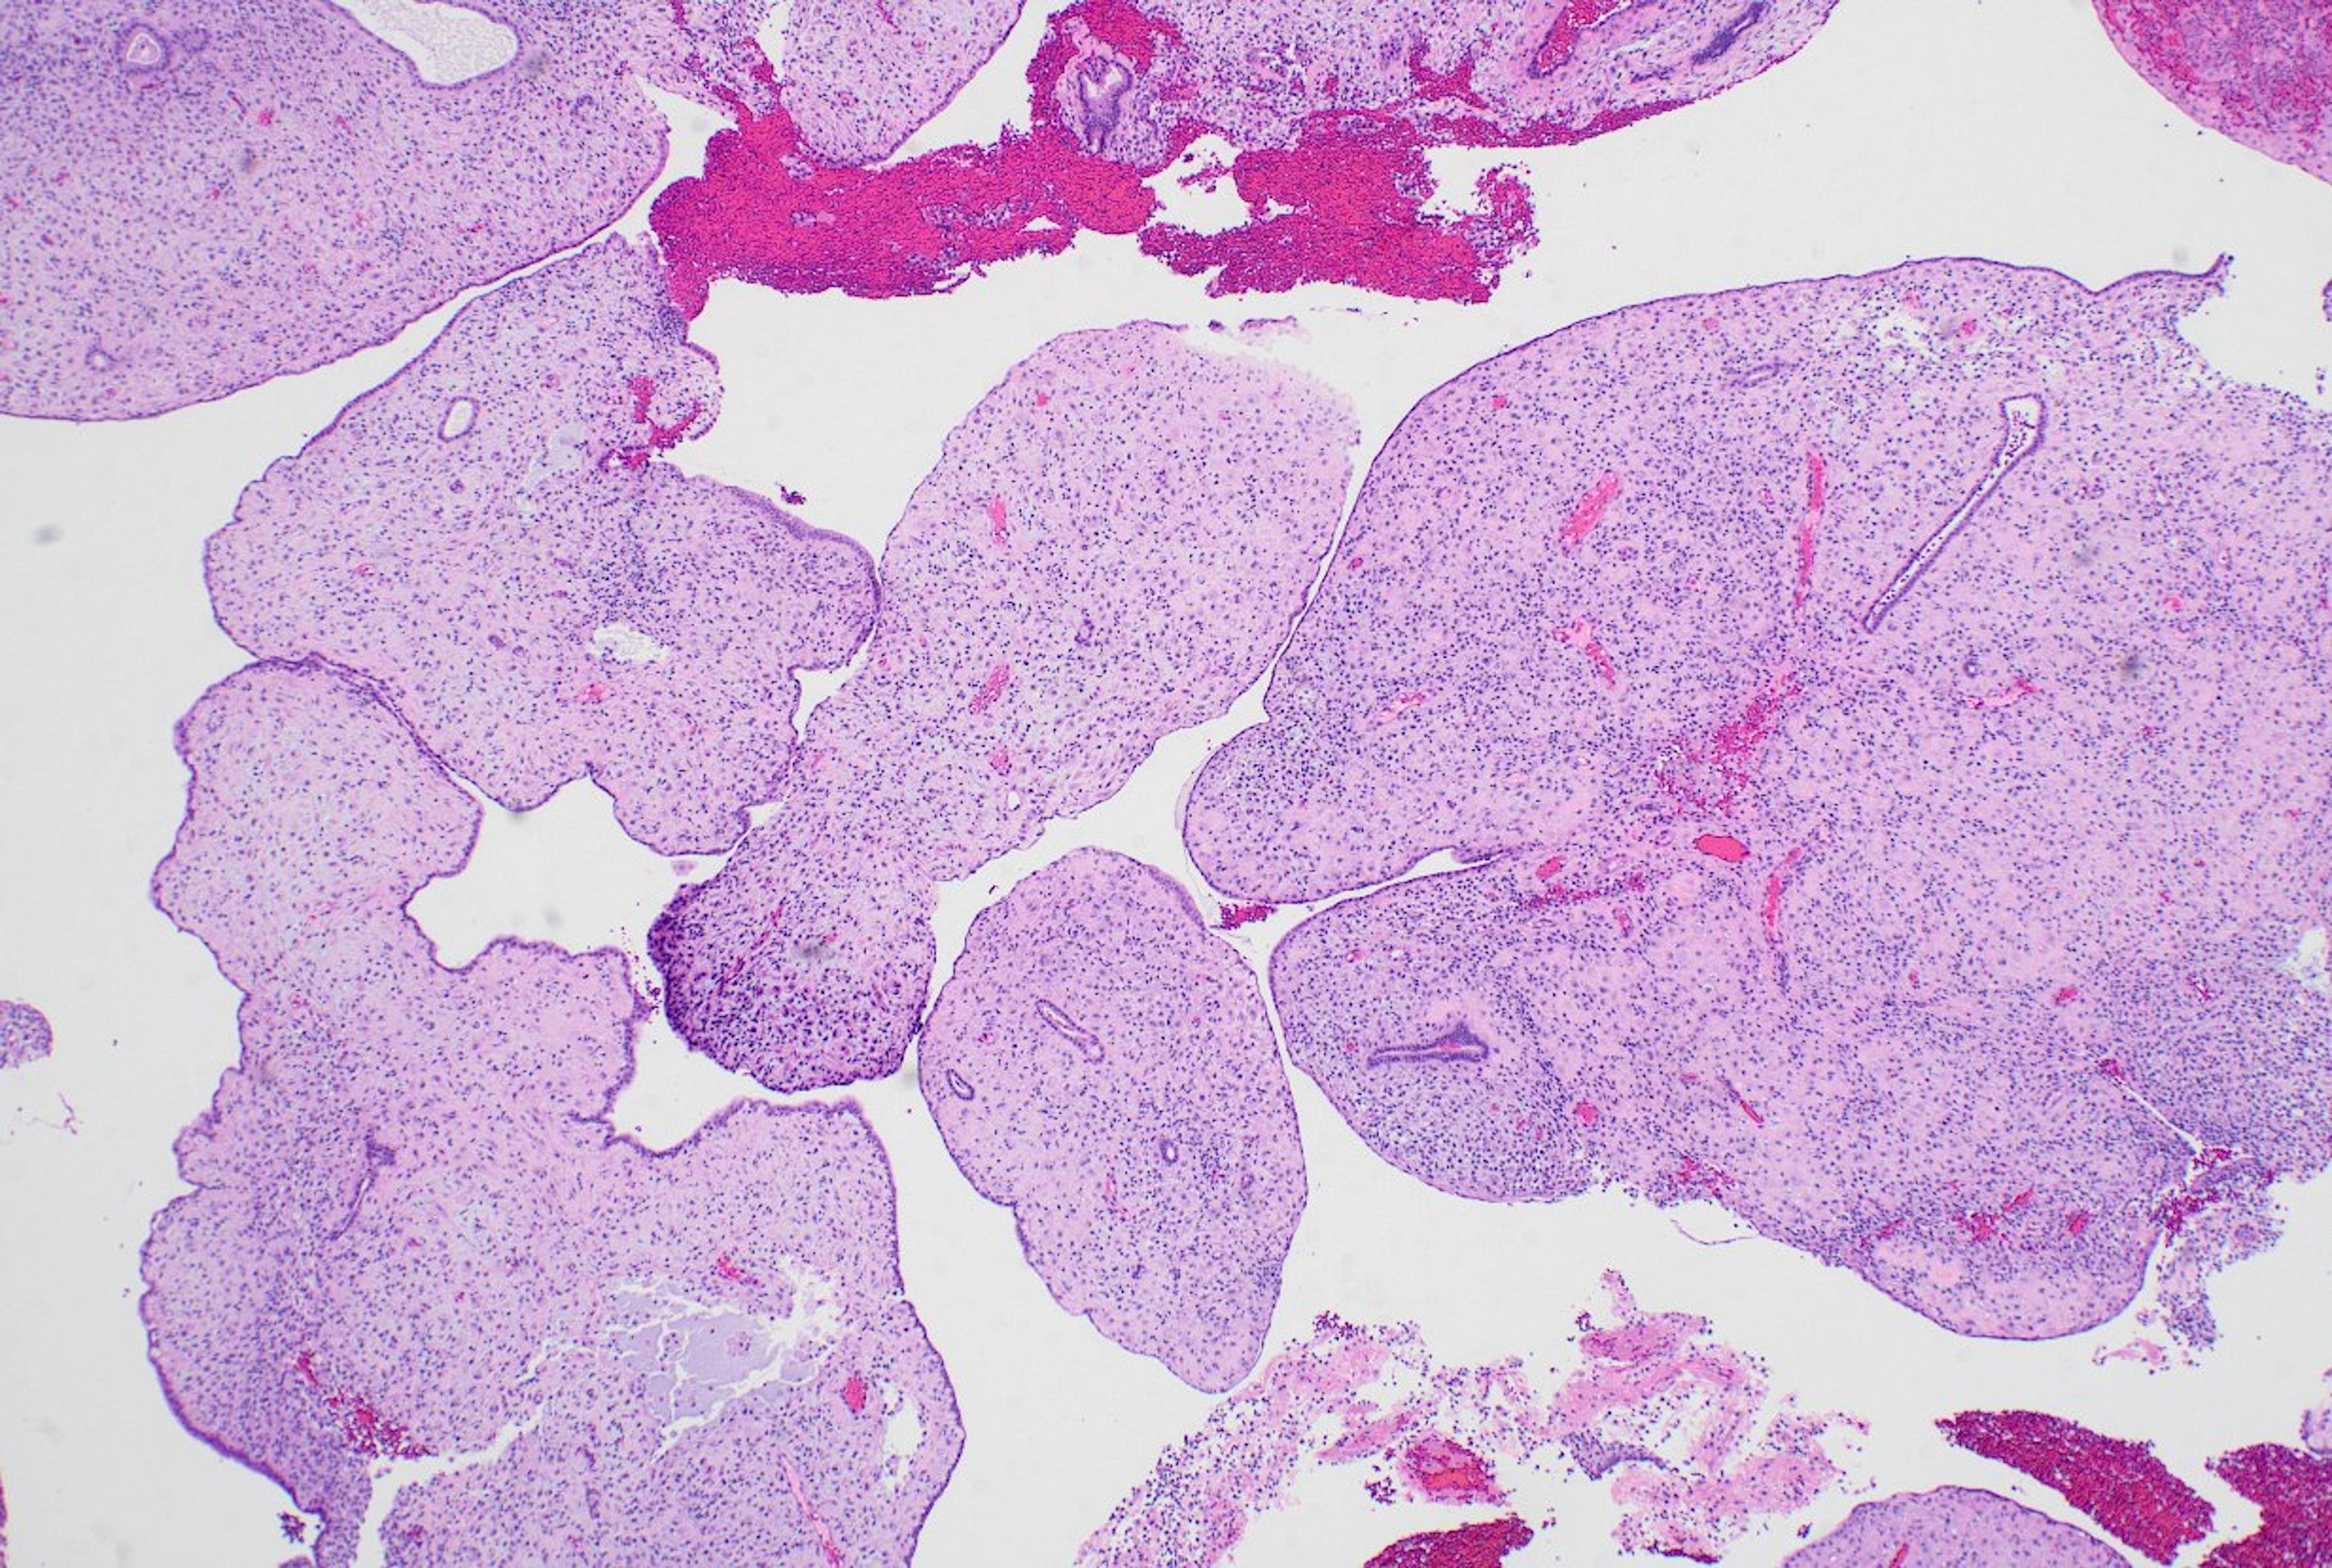
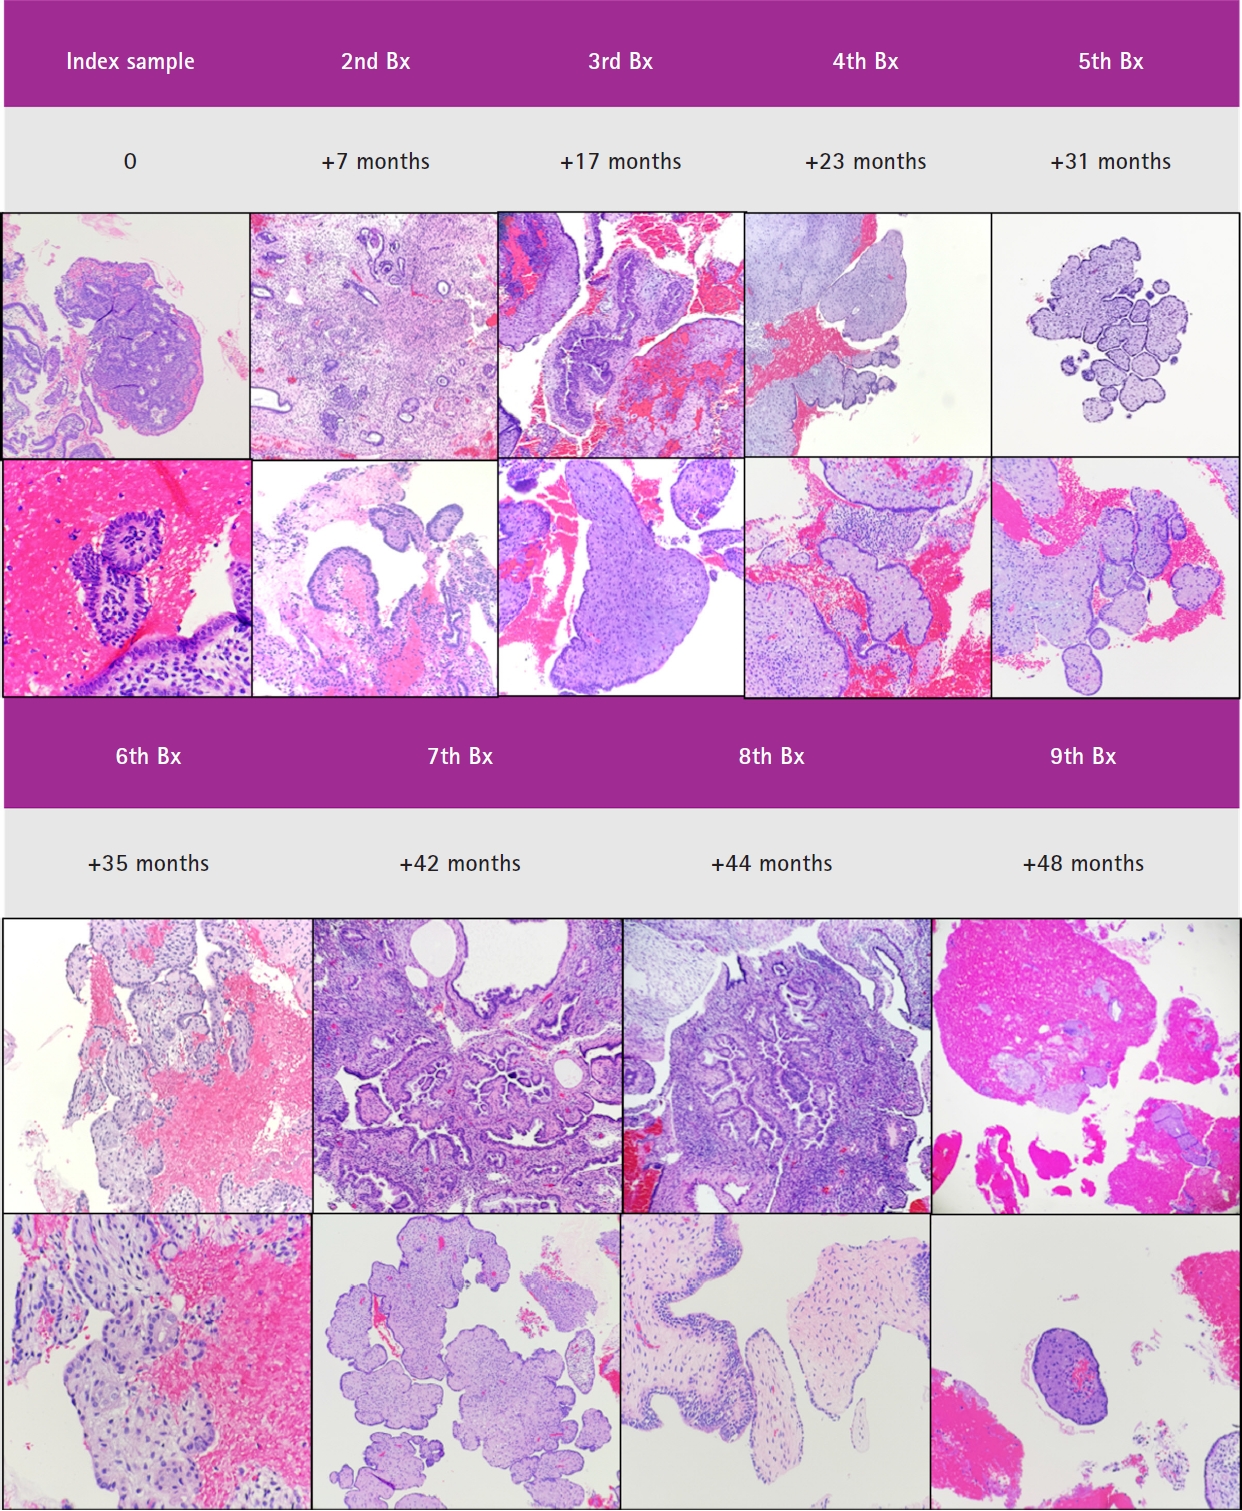
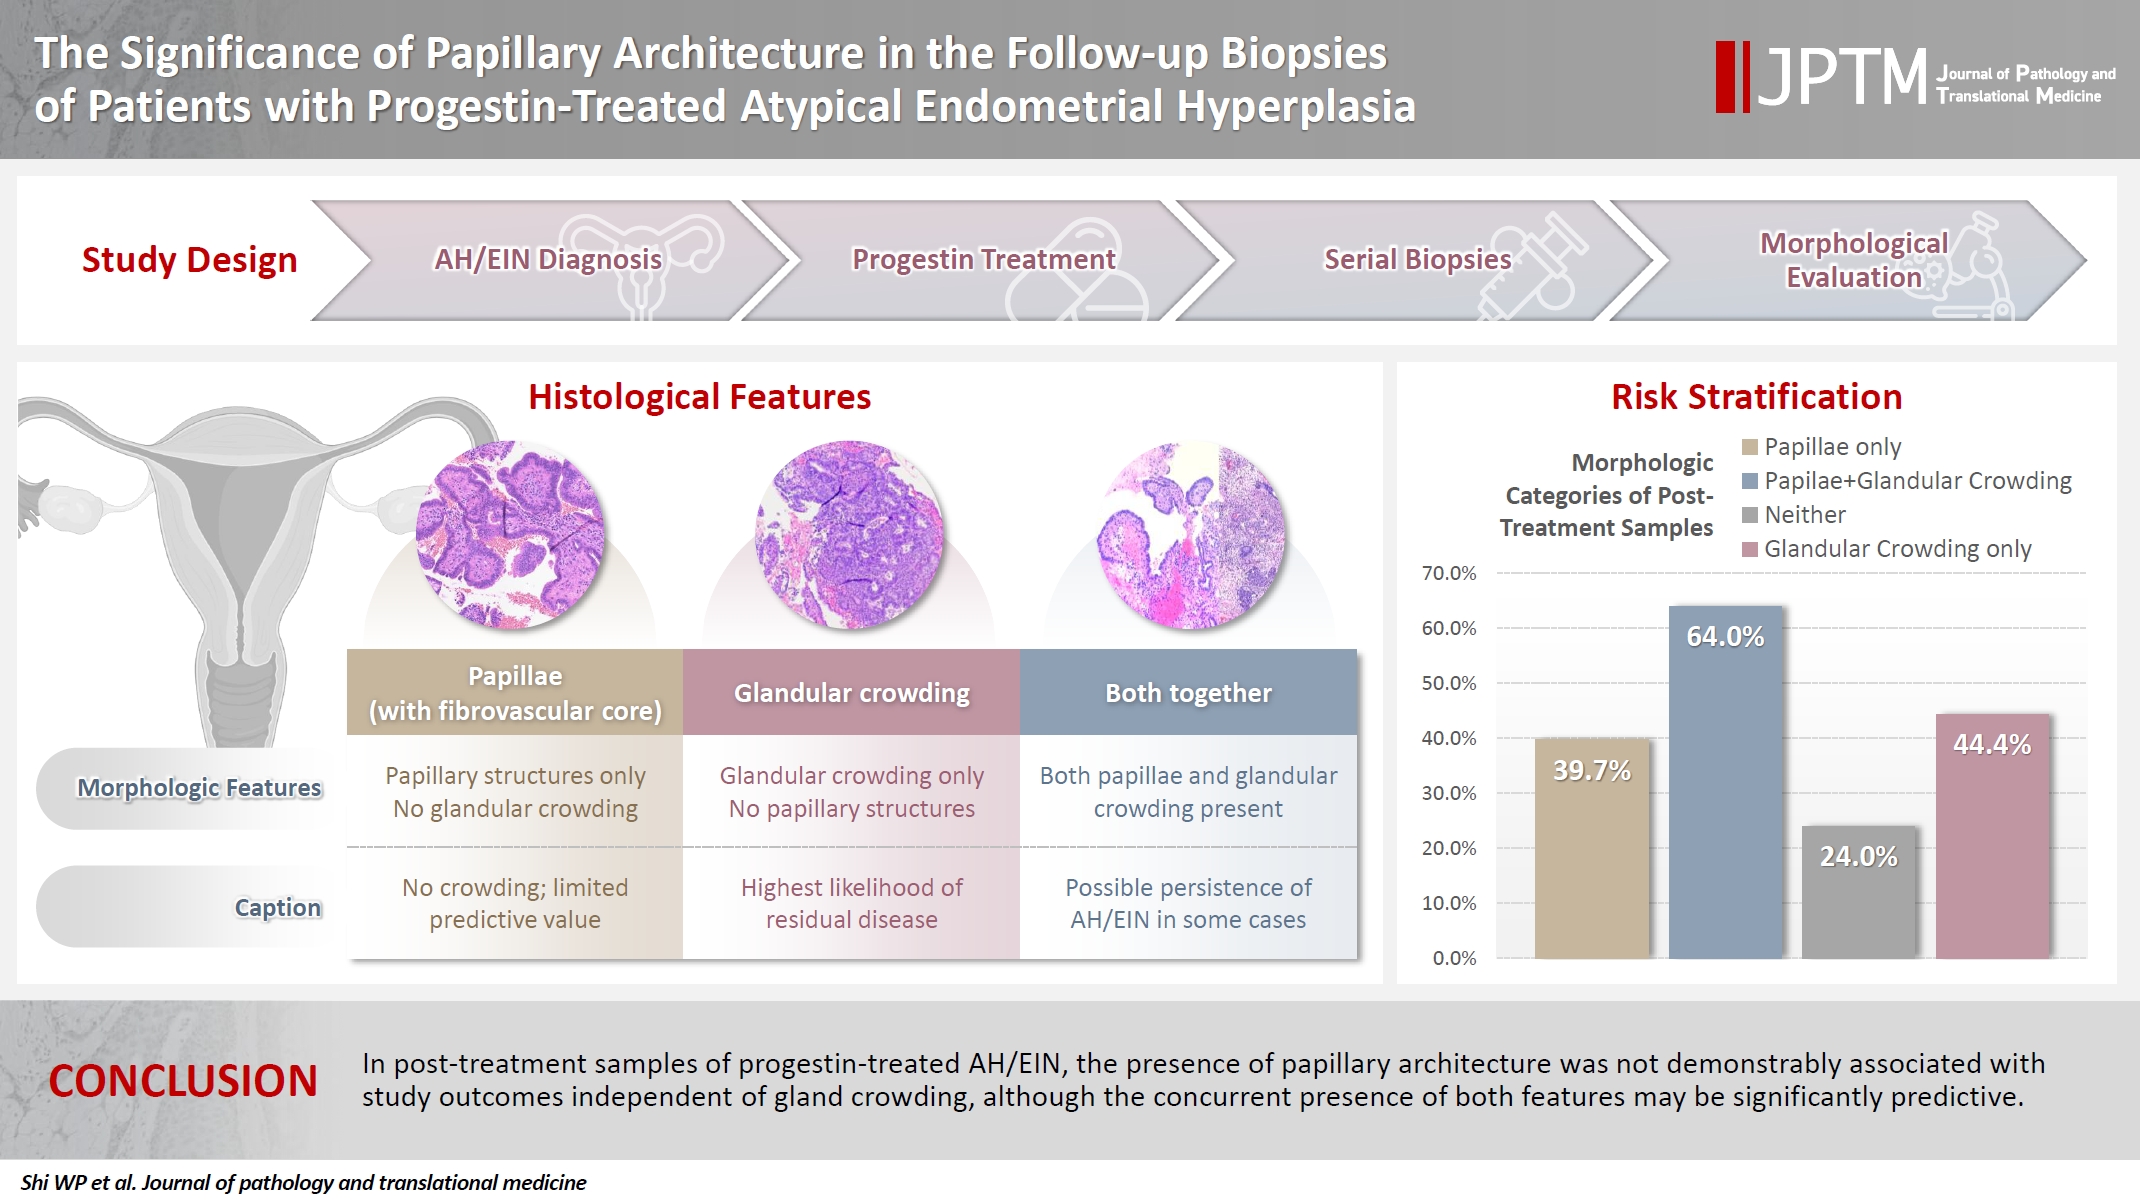


Fig. 1.
Fig. 2.
Fig. 3.
Fig. 4.
Graphical abstract
| Study groupings of selected post-treatment samples | Samples with residual atypical hyperplasia or carcinoma in at least one subsequent specimen |
|---|---|
| Group 1: Follow up biopsies with papillary architecture and no gland crowding (n = 73) | 29/73 (39.7) |
| Group 2: Follow up biopsies with concurrent papillary architecture and gland crowding (n = 25) | 16/25 (64.0) |
| Group 3: Follow up biopsies with no papillary architecture or gland crowding (n = 25) | 6/25 (24.0) |
| Group 4: Follow up biopsies with gland crowding and no papillary architecture (n = 9) | 4/9 (44.4) |
| Study groupings of patients based on the first post-treatment sample | Samples with residual atypical hyperplasia or carcinoma in at least one subsequent specimen |
|---|---|
| Group 1: Follow up biopsies with papillary architecture and no gland crowding (n = 21) | 9/21 (42.8) |
| Group 2: Follow up biopsies with concurrent papillary architecture and gland crowding (n = 12) | 11/12 (91.6) |
| Group 3: Follow up biopsies with no papillary architecture or gland crowding (n = 10) | 6/10 (60.0) |
| Group 4: Follow up biopsies with gland crowding and no papillary architecture (n = 7) | 2/7 (28.5) |
| (Group 1, “primary sample”) Post-treatment samples with papillary architecture and no gland crowding | Residual AH/carcinoma in the last specimen, outcome-2 (n = 13) | Residual AH/carcinoma in any specimen subsequent to primary sample, outcome-1 (n = 28) | No residual AH or carcinoma in any specimen subsequent to the primary sample (n = 44) | p-value |
|---|---|---|---|---|
| Mean percentage of papillary architecture in the sample | 37.5 ± 20.4 | 30.9 ± 18.9 | 19.8 ± 17.2 | .003 |
| Papillae with any branching present | 8/13 (61.5) | 20/28 (71.4) | 29/44 (65.9) | .799 |
| Surface micropapillae present | 3/13 (23.1) | 5/28 (17.8) | 4/44 (9.1) | .350 |
| Surface micropapillae with any branching | 2/13 (15.4) | 3/28 (10.7) | 3/44 (6.8) | .623 |
| Complex papillae (>1 branching) present | 0/13 (0) | 4/28 (14.3) | 2/44 (4.5) | .162 |
| All post-treatment samples (n = 168) | AH or carcinoma present in any subsequent specimen (n = 67) | Absence of AH or carcinoma in any subsequent specimen (n = 101) | p-value |
|---|---|---|---|
| Presence of papillae | 48/67 (71.6) | 71/101 (70.3) | .851 |
| Gland crowding | 28/67 (41.8) | 24/101 (23.8) | .013 |
| Percentage of sample with papillae | 21.3 ± 22.3 | 13.8 ± 21.3 | .031 |
| Gland crowding and papillae | 15/67 (22.4) | 10/101 (10.0) | .045 |
| Papillae in >40% of the sample | 15/67 (22.4) | 15/101 (14.9) | .212 |
| Papillae in >40% of the sample and no gland crowding | 11/67 (16.4) | 11/101 (10.9) | .298 |
| Papillae in >30% of the sample | 21/67 (31.3) | 22/101 (21.8) | .164 |
| Papillae in >30% of the sample and no gland crowding | 15/67 (22.4) | 17/101 (16.8) | .369 |
| Papillae in >20% of the sample | 27/67 (40.3) | 22/101 (21.8) | .010 |
| Papillae in >20% of the sample and no gland crowding | 18/67 (26.8) | 17/101 (16.8) | .117 |
| Papillae in >10% of the sample | 37/67 (55.2) | 29/101 (28.7) | .001 |
| Papillae in >10% of the sample and no gland crowding | 25/67 (37.3) | 33/101 (32.6) | .700 |
| Number of branching papillae | 30/67 (44.8) | 33/101 (32.6) | .113 |
| Complex branching | 5/67 (7.5) | 2/101 (2.0) | .082 |
| Simple branching | 25/67 (37.3) | 31/101 (30.7) | .373 |
| No branching | 37/67 (55.2) | 68/101 (67.3) | .113 |
| Surface micropapillae | 9/67 (13.4) | 5/101 (5.0) | .084 |
| Surface micropapillae with any branching papillae | 9/67 (13.4) | 4/101 (3.9) | .037 |
| Cytological demarcation | 27/67 (40.3) | 13/101 (12.9) | .001 |
| Morules | 15/67 (22.4) | 12/101 (11.9) | .597 |
| Crowded cysts | 8/67 (11.9) | 9/101 (8.9) | .246 |
| Mucinous/columnar metaplasia | 21/67 (31.3) | 19/101 (18.8) | .062 |
Values in parentheses indicate percentages. Group 1 vs. 2 (p = .040); group 1 vs. 3 (p = .227); group 2 vs. 3 (p = .010); group 1 vs. 4 (p > .99); group 2 vs. 4 (p = .435); group 3 vs. 4 (p = .395). AH, atypical endometrial hyperplasia.
Values in parentheses indicate percentages. Group 1 vs. 2 (p = .009); group 1 vs. 3 (p = .458); group 2 vs. 3 (p = .135); group 1 vs. 4 (p = .668); group 2 vs. 4 (p = .010); group 3 vs. 4 (p = .335). AH, atypical endometrial hyperplasia.
Values are presented as mean ± standard deviation and values in parentheses indicate percentages. AH, atypical endometrial hyperplasia.
Values in parentheses indicate percentages and values are presented as mean ± standard deviation. AH, atypical endometrial hyperplasia.

