 E-submission
Articles
- Page Path
- HOME > J Pathol Transl Med > Volume 60(1); 2026 > Article
-
Original Article
Significance of KM55 immunohistochemical staining in the diagnosis and prognosis of IgA nephropathy -
Hoe In Jeong
 , Beom Jin Lim, Minsun Jung
 -
Journal of Pathology and Translational Medicine 2026;60(1):69-82.
DOI: https://doi.org/10.4132/jptm.2025.09.17
Published online: January 14, 2026
Departments of Pathology, Yonsei University College of Medicine, Seoul, Korea
- Corresponding Author: Minsun Jung, MD, PhD Department of Pathology, Yonsei University College of Medicine, 50-1 Yonsei-ro, Seodaemun-gu, Seoul 03722, Korea Tel: +82-2-2228-1771, Fax: +82-2-362-0860, E-mail: jjunglammy@yuhs.ac
© The Korean Society of Pathologists/The Korean Society for Cytopathology
This is an Open Access article distributed under the terms of the Creative Commons Attribution Non-Commercial License (http://creativecommons.org/licenses/by-nc/4.0) which permits unrestricted non-commercial use, distribution, and reproduction in any medium, provided the original work is properly cited.
Abstract
-
Background
- Galactose-deficient IgA1 (Gd-IgA1) plays a crucial role in IgA nephropathy (IgAN). The monoclonal antibody KM55 has emerged as a simplified method for detecting Gd-IgA1; however, the clinicopathological significance of immunohistochemistry for Gd-IgA1 remains underexplored. This study evaluated the prognostic and clinicopathological significance of KM55 immunohistochemistry in IgAN.
-
Methods
- A total of 114 native kidney biopsies showing at least mild mesangial IgA positivity on immunofluorescence were retrospectively analyzed. Patients were categorized as having IgAN or non-IgAN diseases. The KM55 immunohistochemical staining was graded as 0, 1+, 2+, 3+, or 4+. Data on Oxford classification, laboratory parameters, and renal outcomes were collected.
-
Results
- The IgAN group showed significantly higher KM55 scores than the non-IgAN group (median: 3 vs. 1; p < .001). IgAN cases were further stratified into KM55-high (≥3+, n = 38) and -low groups (≤2+, n = 37). The KM55-high group had significantly higher diastolic blood pressure, blood urea nitrogen, creatinine, urine protein/creatinine ratio, and Oxford mesangial hypercellularity scores, along with lower estimated glomerular filtration rate (eGFR) and serum albumin. Cox analysis revealed significantly poorer outcomes in the KM55-high group for chronic kidney disease stage 4 (p = .015), end-stage renal disease (p = .024), and 75% eGFR decline (p = .016).
-
Conclusions
- Mesangial Gd-IgA1 deposition graded by KM55 immunohistochemistry may be a useful adjunct for IgAN diagnosis and a potential prognostic biomarker.
- IgA nephropathy (IgAN) is the most common glomerular disease worldwide, affecting individuals across all age groups. Its clinical course is highly variable, ranging from asymptomatic spontaneous remission to slow progression, or end-stage renal disease (ESRD) requiring renal replacement therapy. Approximately 30%–40% of adults with IgAN progress to renal failure within 20–30 years of follow-up [1,2]. Current understanding of IgAN pathophysiology highlights a central role for galactose-deficient IgA1 (Gd-IgA1) in disease development [2-4]. Among the two mucosal plasma cell-derived isoforms of IgA, IgA1 and IgA2, IgA1 typically undergoes galactosylation of O-linked N-acetylgalactosamine residues. Defects in this process result in Gd-IgA1 formation. When autoantibodies bind to Gd-IgA1 polymers, immune complexes can deposit in the mesangial matrix, triggering complement activation, mesangial expansion, and cellular proliferation [2,4]. This mechanism has prompted efforts to incorporate serum levels or histologic Gd-IgA1 expression into IgAN diagnosis, emphasizing the need for efficient and specific measuring methods. Yasutake et al. [5] developed a highly specific monoclonal antibody, KM55, which has been successfully used to quantify serum Gd-IgA1 via enzyme-linked immunosorbent assay (ELISA). Unlike traditional lectin-based assays or mass spectroscopy, KM55 is now recognized as a reliable tool for quantitatively detecting Gd-IgA1 in biopsied kidney tissue or serum, independent of bioactivity and stability [3]. In a study by Zhang et al. [3], immunohistochemical (IHC) staining with KM55 showed greater mesangial KM55 deposition in IgAN cases than in controls. However, the comparison lacked systematic numeric scoring and statistical validation. Moreover, a standardized KM55 IHC scoring system and the optimal diagnostic cutoff for IgAN have yet to be established [3]. Martin-Penagos et al. [6] reported that serum Gd-IgA1 levels, measured using KM55, correlated with the risk of progression to chronic kidney disease (CKD) stage 5, suggesting KM55’s potential utility in prognostic assessment of IgAN. However, most clinicopathological studies have focused solely on plasma levels. To the best of our knowledge, no robust quantitative study has examined the relationship between mesangium-specific Gd-IgA1 deposition, as measured by KM55 IHC, and clinical or pathological features, such as those defined by the Oxford classification. Furthermore, the correlation between long-term prognosis and the extent of mesangial Gd-IgA1 deposition remains insufficiently explored.
- This study employed the KM55 monoclonal antibody to assess the correlation between mesangial Gd-IgA1 deposition and clinicopathologic characteristics in IgAN. Its predictive value for long-term outcomes, particularly progression to ESRD, was evaluated, and the mesangial KM55 staining was compared between IgAN and non-IgAN glomerular diseases.
INTRODUCTION
- Patient selection and grouping
- Patients who underwent renal biopsy and received a pathological diagnosis at Severance Hospital (Seoul, Korea) between January 2010 and June 2024 were retrospectively analyzed (n = 114). Inclusion criteria were as follows: (1) renal biopsy specimen containing more than three viable glomeruli per section, (2) immunofluorescence (IF) test demonstrating at least mild mesangial IgA staining (IgA ≥1+), and (3) no prior history of kidney transplantation. IgA intensity in IF was graded on a scale of 0 (negative), 0.5+ (trace), 1+ (mild), 2+ (moderate), and 3+ (strong).
- Patients diagnosed with IgAN (n = 75) demonstrated mesangial electron-dense deposits (EDD) on electron microscopy (EM) when glomeruli were available for evaluation. The IF showed a C3 intensity of 1+ or greater in cases lacking EDD. All IgAN cases exhibited IgA dominance or co-dominance on IF. None of the IgAN cases met the diagnostic criteria for systemic lupus nephritis as per the 2019 European League Against Rheumatism (EULAR)/American College of Rheumatology (ACR) guidelines [7]. A subset of patients with IgAN (n = 9), whose symptoms began within 50 days of coronavirus disease 2019 (COVID-19) vaccination or infection, as previously reported [8], were subclassified as the COVID-19–related IgAN group. All IgAN cases had a clinical follow-up duration (the interval between the first and last laboratory tests) exceeding 3 months. Patients who did not meet the criteria for IgAN were assigned to the non-IgAN group (n = 39). Pathological diagnoses in this group included lupus nephritis (n = 27), post-infectious glomerulonephritis (n = 3), pauci-immune crescentic glomerulonephritis (n = 2), focal segmental glomerulosclerosis (FSGS), not otherwise specified (n = 1), IgA-dominant infection-related glomerulonephritis (n = 1), IgM nephropathy (n = 1), immune complex-associated crescentic glomerulonephritis (n = 1), membranous nephropathy (n = 1), membranoproliferative glomerulonephritis (n = 1), and subacute bacterial endocarditis-associated immune complex-mediated glomerulonephritis (n = 1). A summary of the recruitment process is illustrated in Fig. 1.
- Pathologic diagnosis
- Biopsy specimens were processed into formalin-fixed paraffin-embedded (FFPE) blocks and IF samples at collection. Tissue sections were stained with hematoxylin-eosin, acid fuchsin orange G, periodic acid methenamine silver, and periodic acid-Schiff stains. IgAN was diagnosed based on the dominance or co-dominance of IgA in IF. For each case, IF staining was performed for IgG, IgA, IgM, C3, C4, C1q, fibrinogen, kappa light chain, and lambda light chain.
- The Oxford classification was applied to each IgAN case [9,10]. Mesangial hypercellularity (M) was classified as M0 (less than half of glomeruli exhibit mesangial expansion and cell proliferation) or M1 (more than half of glomeruli exhibit mesangial expansion and cell proliferation). Endocapillary hypercellularity (E) was scored as E0 (no endocapillary hypercellularity) or E1 (presence of endocapillary hypercellularity). Segmental sclerosis (S) was classified as S0 (absence of segmental sclerosis or adhesion of capillary tuft) or S1 (presence). Tubular atrophy and interstitial fibrosis (T) were classified as T0 (<25% cortical involvement), T1 (25%–50% cortical involvement), and T2 (>50% cortical involvement). Crescent formation (C) score was classified as C0 (no crescent), C1 (0%–25% of glomeruli with crescent formation), and C2 (>25% of glomeruli with crescent formation). Moreover, each IgAN case was evaluated according to the Haas classification system: grade I (minimal change), II (focal segmental glomerulosclerosis), III (focal mesangioendocapillary proliferation), IV (diffuse proliferation), and V (advanced chronic, >40% of glomeruli are globally sclerotic) [11].
- Each case underwent an EM examination. The researcher reviewed digitalized images of glomeruli. Among the IgAN group, 71 cases had examinable glomeruli, all exhibiting EDD in the mesangium. In the non-IgAN group, all cases had examinable glomeruli, with 29 showing mesangial EDD, while the remaining 10 cases showed no EDD in the mesangium.
- IHC staining and evaluation of KM55
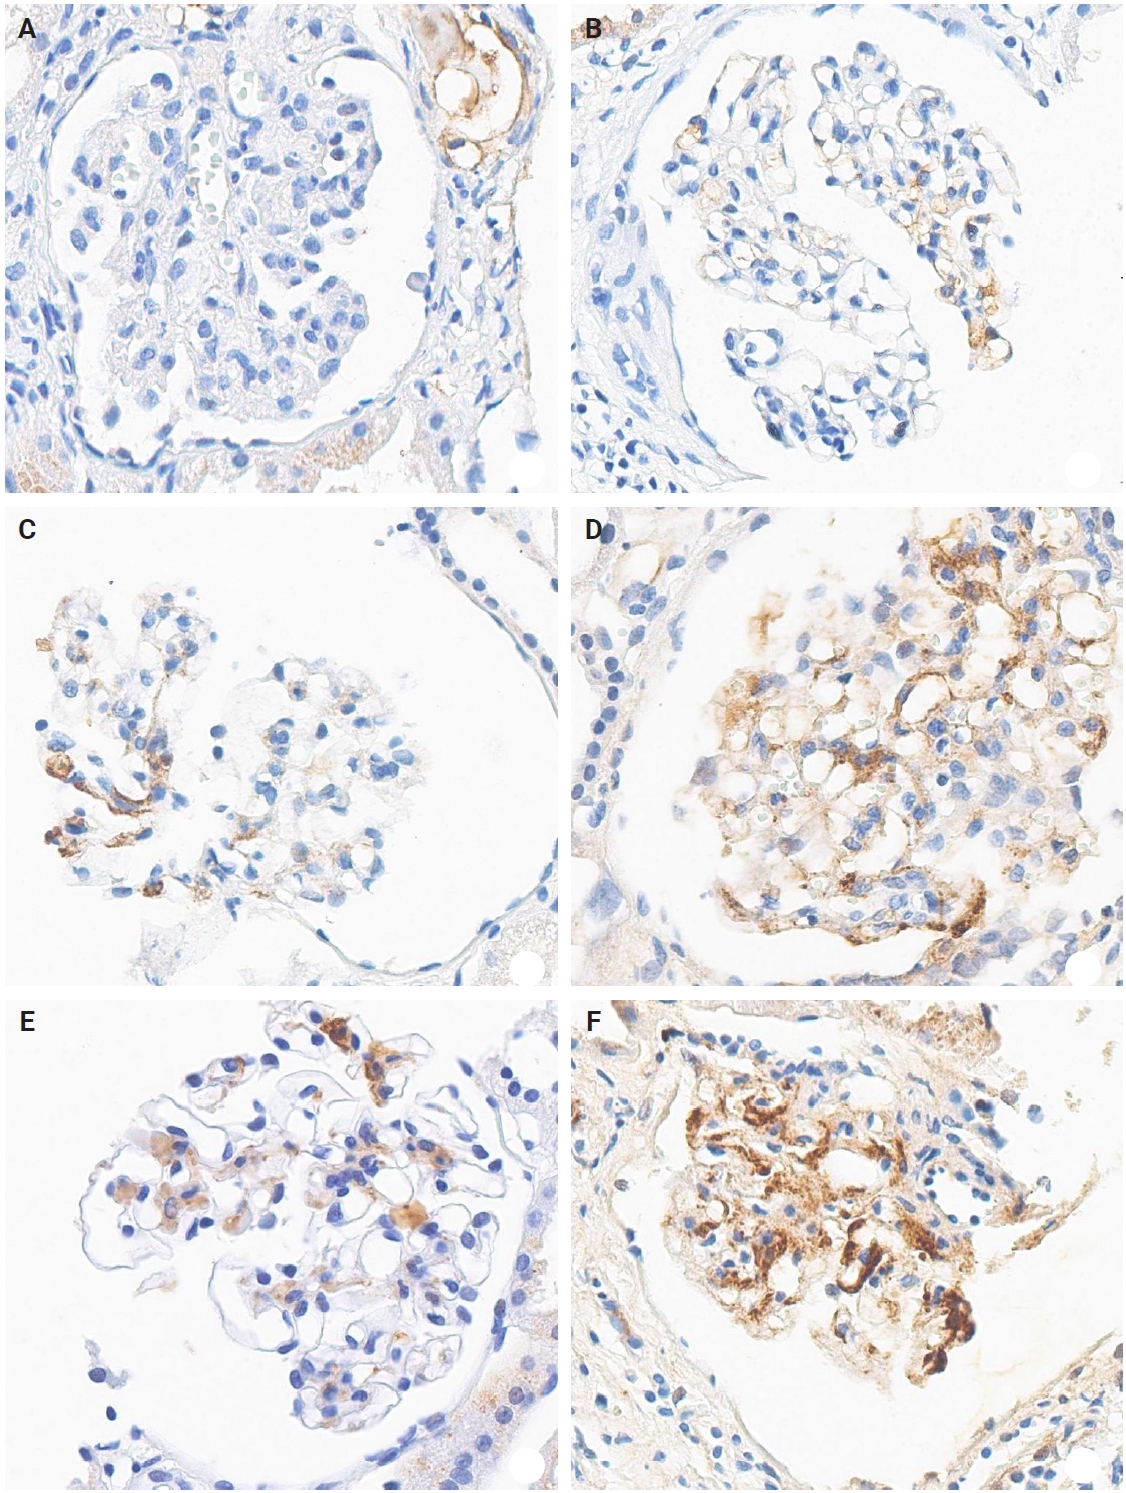
- The IHC staining was performed using an automated IHC stainer (BOND-III, Leica Biosystems, Nussloch, Germany). The FFPE sections (3 μm thick) were dewaxed using BOND Dewax Solution (Leica Biosystems) and 100% alcohol. Heat-induced epitope retrieval was performed with BOND Epitope Retrieval Solution 2 (Leica Biosystems) for 20 minutes. Antigen retrieval was carried out using protease 1 (Ventana Medical Systems, Tucson, AZ, USA) at a concentration of 0.38 mg/mL for 30 minutes. Peroxidation was processed for 10 minutes. The KM55 primary antibody (rat IgG monoclonal antibody against human Gd-IgA1, Immuno-Biological Laboratories, Fujioka, Japan) at a 10 µg/mL concentration was applied for 15 minutes. The secondary antibody (conjugated goat anti-rat IgG antibody) was automatically added for 15 minutes. Then, the Bond Polymer Refine Detection Kit (Leica Biosystems) was used for the polymer, 3,3'-diaminobenzidine (DAB), and hematoxylin staining in an automated process: polymer for 8 minutes, mixed DAB for 8 minutes, and hematoxylin for 3 minutes. The protocol was validated using positive controls (several IgAN cases) and negative controls (nephrectomy specimens from patients without medical kidney disease). In each case, mesangial KM55 expression was assessed via IHC and graded on a scale of 0 (negative), 1+ (faint), 2+ (weak), 3+ (moderate), and 4+ (strong). Representative images for each grade are represented in Fig. 2.
- Clinical information
- Clinical information, including age at diagnosis, sex, presenting complaint, date of initial presentation, and laboratory results at the time of initial biopsy, was obtained from electronic medical records. Laboratory parameters included blood pressure, serum creatinine, albumin, estimated glomerular filtration rate (eGFR), calculated using the CKD-epidemiology collaboration (CKD-EPI) method, urine protein-creatinine ratio, 24-hour urine protein excretion, microscopic red blood cell count in urine, and complete blood count. Follow-up medical records to May 2024 were reviewed for the IgAN group to gather prognostic information. The ESRD state was defined as an eGFR <15 mL/min/1.73 m² along with a clinical plan for renal replacement therapy (dialysis or transplant). CKD stage 4 was defined as an eGFR of 15–29 mL/min/1.73 m². For IgAN cases, the dates of ESRD onset, CKD stage 4 progression, and a ≥75% reduction from baseline eGFR (eGFR-25%) were recorded. Survival time was calculated from the biopsy date to the occurrence of one of these outcomes. In patients with clinical features suggestive of systemic lupus erythematosus (SLE), anti-nuclear antibody (ANA) levels were measured; those with positive ANA results underwent complement testing. Among 17 patients with ANA positivity, six had anti-DNA antibody levels evaluated. At the time of biopsy, serum C3 and C4 levels were measured in 70 IgAN cases, and serum IgA levels were assessed in 65 IgAN cases.
- Statistics
- Depending on data distribution, either the independent two-tailed t-test or the Mann-Whitney U test was used to compare the two groups. For comparisons across three or more groups, normally distributed variables were analyzed using analysis of variance (ANOVA), followed by Bonferroni post-hoc testing. Conversely, non-normally distributed variables were evaluated using the Kruskal-Wallis test. Categorical variables were compared using the chi-square test or Fisher’s exact test, as appropriate. Prognostic analyses for progression to ESRD, CKD stage 4, and eGFR-25% were analyzed using Kaplan-Meier curves, and univariate and multivariate Cox regression models.
MATERIALS AND METHODS
- Discriminative ability of KM55 IHC in diagnosing IgAN
- Seventy-five patients were classified as the IgAN group and 39 as the non-IgAN group. Baseline clinico-epidemiological characteristics are presented in Table 1. For each case, KM55 IHC staining was graded on a five-tier scale based on the intensity and extent of mesangial Gd-IgA1 deposition. The IgAN group exhibited substantially higher KM55 scores than the non-IgAN group (median [interquartile range (IQR)], 3 [2 to 3] vs. 1 [0 to 1]; p < .001) (Fig. 3A). Four patients in the non-IgAN group exhibited a KM55 score of 2+, all diagnosed with lupus nephritis. The receiver operating characteristic curve illustrating the diagnostic performance of KM55 IHC is shown in Fig. 3B. The area under the curve was 0.907 (95% confidence interval [CI], 0.855 to 0.959). The optimal KM55 score cutoff for diagnosing IgAN was 2+, yielding a sensitivity of 0.760 and a specificity of 0.897. Eighteen patients in the IgAN group had a KM55 score of 1+, falling below this cutoff. Further clinical data were analyzed to compare these KM55 1+ IgAN cases with those scoring ≥2+. The serum IgA levels at the time of initial biopsy were available for 16 patients with KM55 1+ and 49 with KM55 ≥2+. The KM55 1+ group had significantly lower IgA levels (mean ± standard deviation, 237.23 ± 78.91 vs. 317.66 ± 136.87; p = .025). However, no considerable differences were found between the groups in IF IgA intensity (p = .327) or the interval between clinical presentation and biopsy (p = .651).
- Relationship between pathologic variables and KM55 score in IgAN
- Among IgAN patients, 21 had an M1 score, 30 had E1, 48 had S1, 11 had T1 or T2, and 29 had C1 or C2 scores. The distribution by Haas classification was as follows: two (grade I), seven (II), 42 (III), 18 (IV), and 6 (V). The M and T scores of the Oxford classification were significantly associated with the KM55 mesangial scores (Table 2). Patients with an M1 score had higher KM55 scores (median [IQR], 3 [2.5 to 3]) than those with an M0 score (2 [1 to 3]) (p = .017). Patients with a T1–2 score had significantly higher KM55 scores (3 [3 to 3]) compared to those scored with a T0 score (2 [1 to 3]) (p = .049). However, E, S, and C scores from the Oxford classification showed no substantial association with mesangial KM55 scores. Similarly, differences in KM55 scores across Haas classification grades were insignificant (p = .233) (Table 2).
- Clinicopathological and prognostic implications of the KM55 score in IgAN
- Given the significant association between the KM55 score and Oxford classification, patients with IgAN were further stratified by mesangial KM55 score. All patients scored 1+, 2+, 3+, or 4+, allowing categorization into four groups. Comparison across these groups revealed significant differences in serum creatinine (p = .015), eGFR (p = .020), and serum albumin (p = .008) (Table 3). Pairwise comparisons showed significant differences in serum creatinine between KM55 2+ vs. KM55 3+ (p = .003), and KM55 2+ vs. KM55 4+ (p = .018); in eGFR between KM55 2+ vs. KM55 4+ (p = .045) and in serum albumin between KM55 1+ vs. KM55 2+ (p = .031), KM55 1+ vs. KM55 3+ (p = .003), and KM55 1+ vs. KM55 4+ (p = .004). Moreover, serum creatinine, uric acid, blood urea nitrogen (BUN), and systolic blood pressure showed a rising trend from KM55 2+ to 4+, though this trend was not observed between 1+ and 2+ (Table 3). The interval from initial clinical presentation to biopsy did not differ substantially across groups (p = .935). Complement levels (C3 and C4) showed no significant differences between the two groups (p = .324 and p = .486) (Table 3). Serum albumin consistently decreased from KM55 1+ to 4+ (Table 3). The urine protein/creatinine ratio (UPCR) and diastolic blood pressure showed a consistent increasing trend as the KM55 score rose from 1+ to 4+, although this change was insignificant (Table 3). Serum IgA levels increased as the KM55 score progressed from 1+ to 3+, while no such trend was observed between 3+ and 4+ (Table 3), with a significant difference in IgA levels (p = .050) (Table 3). Among the Oxford classification variables, only the M score demonstrated a significant difference across the four groups (p = .042), with an increasing trend in the M1 ratio from KM55 1+ to KM55 3+ (Table 3).
- Based on these trends, patients with IgAN were categorized into the KM55-high group (≥3+) and the KM55-low group (≤2+). Thirty-eight patients were classified into the KM55-high group, while 37 were placed in the KM55-low group. The KM55-high group had significantly higher serum creatinine (p = .003), lower eGFR (p = .007), higher UPCR (p = .048), higher BUN (p = .041), lower albumin (p = .010), and higher diastolic blood pressure (p = .027) (Table 4). There was no significant difference in the duration between the initial clinical presentation and biopsy date (p = .937). Moreover, complement levels (C3: p = .522, C4: p =.677) showed no substantial difference between the groups (Table 4). Serum IgA levels were significantly higher in the KM55-high group (p = .012) (Table 4). Among the Oxford classification variables, only the M score, which was higher in the KM55-high group, showed a considerable difference between the two groups (p = .012) (Table 4).
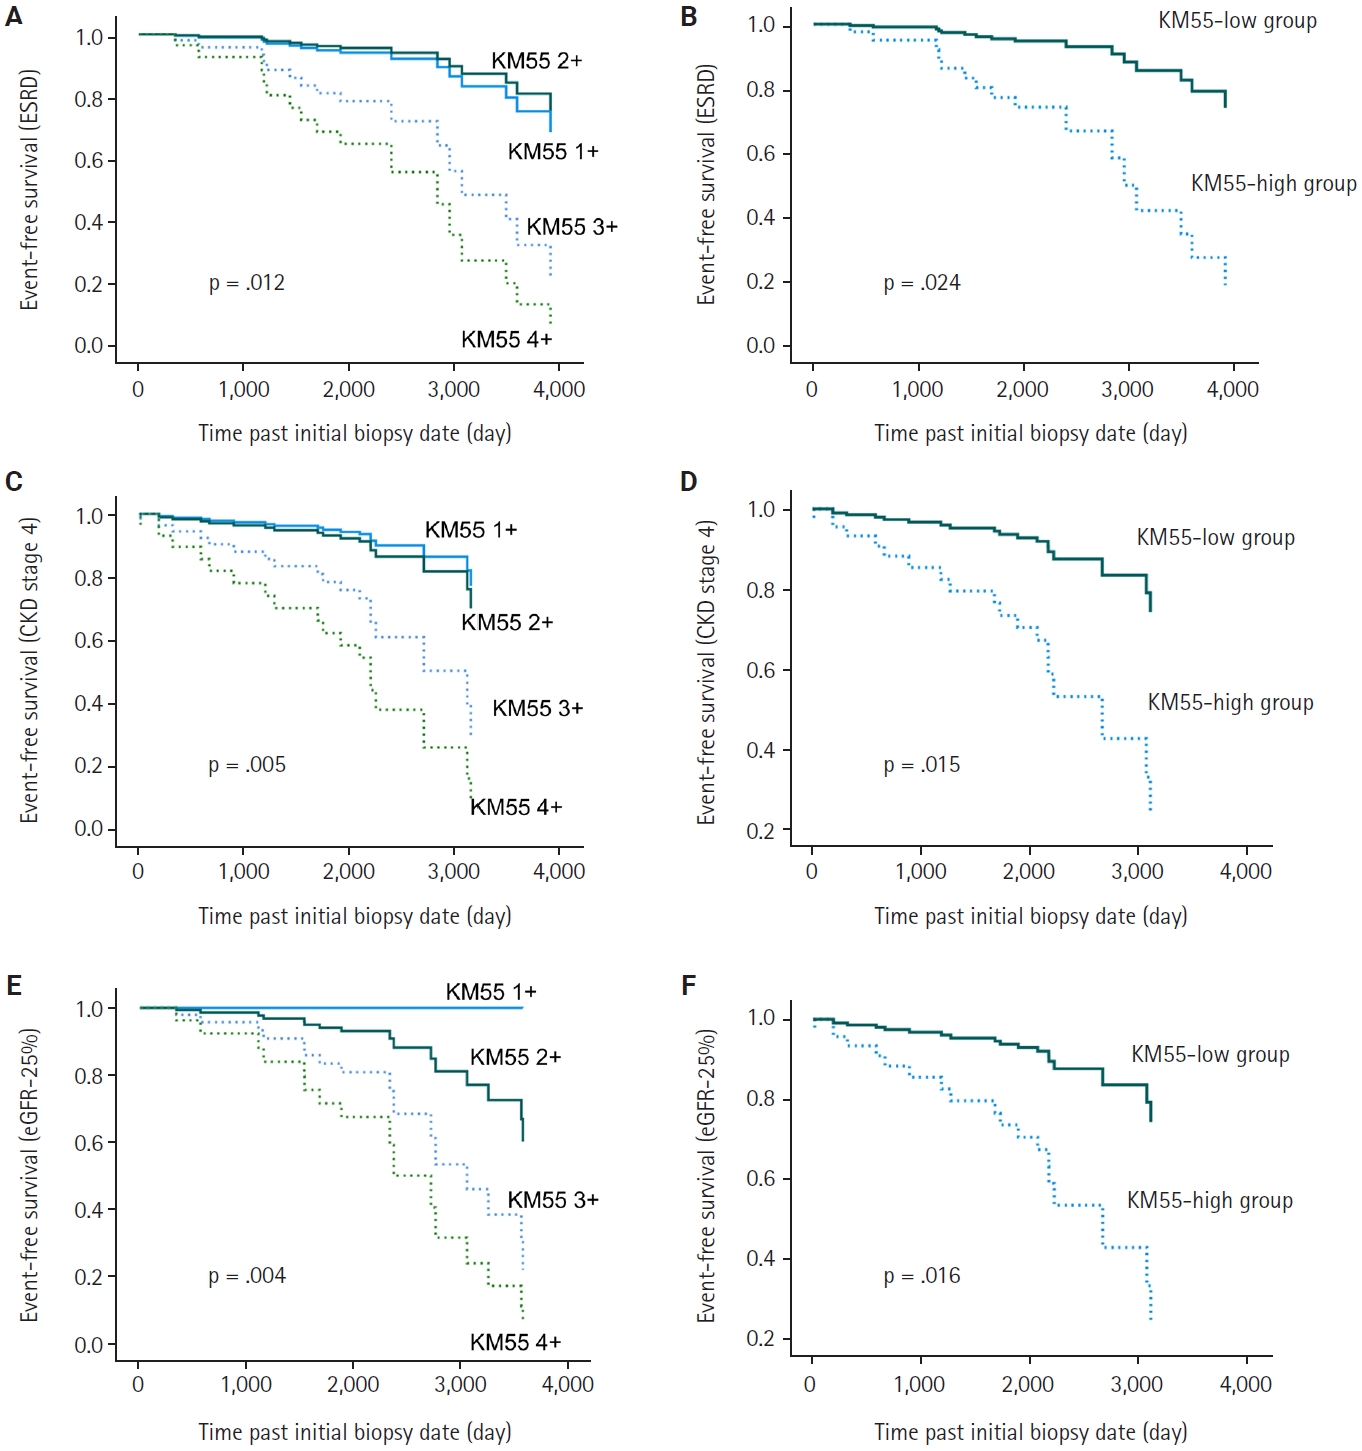
- In univariate Cox regression analysis for event-free survival, the KM55 score was revealed as a significant prognostic factor for ESRD (p = .012), CKD stage 4 (p = .005), and eGFR-25% (p = .004). Event-free survival curves comparing the KM55 1+, 2+, 3+, and 4+ subgroups are shown in Fig. 4A, C, and E. A more distinct gap is observed between the KM55 2+ and KM55 3+ subgroups, while survival differences between 1+ and the 2+, 3+, or 4+ subgroups are relatively ambiguous. This pattern suggests that categorizing the IgAN group into KM55-high (≥3+) and KM55-low groups (≤2+) is reasonable. Among the KM55-high group, 14 (37%) progressed to ESRD, 15 (40%) to CKD stage 4, and 14 (37%) to eGFR-25%, while in the KM55-low group, two (5%) progressed to ESRD, three (8%) to CKD stage 4, and two (5%) to eGFR-25% (Table 4). In univariate survival analysis, the KM55-high group revealed a significantly higher risk for progression to ESRD (hazard ratio [HR], 5.54; 95% CI, 1.26 to 24.45; p = .024), CKD stage 4 (HR, 4.71; 95% CI, 1.36 to 16.36; p = .015), and eGFR-25% (HR, 6.15; 95% CI, 1.39 to 27.12; p = .016) compared to the KM55 low group (Table 5, Fig. 4B, D, and F). Among the Oxford classification variables, only the T score was significantly associated with ESRD (p < .001) (Table 5) and eGFR-25% progression (p < .001) (Table 5). In contrast, M (p =.021), E (p = .030), and T (p < .001) scores were predictive of CKD stage 4 progression (Table 5). In multivariate analysis, after adjusting for significant Oxford classification factors, the KM55 score was not associated with prognosis (ESRD, p = .146; CKD stage 4, p = .249; eGFR-25%, p = .066). However, T score was independently significant for progression to ESRD (HR, 4.73; 95% CI, 1.65 to 13.58; p = .004), CKD stage 4 progression (HR, 11.70; 95% CI, 3.55 to 38.58; p < .001) and eGFR-25% (HR, 3.52; 95% CI, 1.25 to 9.90; p = .017) (Table 5).
- Comparison of COVID-19–related and COVID-19–unrelated IgAN groups
- Among the patients with IgAN, nine were temporally associated with COVID-19 vaccination or infection (Table 6). In the COVID-19–related group, two (22%) were men, averaging 35.0 years. In the COVID-19–unrelated group, 22 (33%) were men, with an average age of 39.1 years. The serum albumin levels in the COVID-19–related and unrelated groups were 4.30 (4.30–4.55) and 4.10 (3.70–4.30), respectively, showing a significant difference (p = .003). No other clinical variables differed significantly between the two groups. Regarding the Oxford classification scores of MEST-C, only the E score showed a significant difference between the groups (p = .018). The percentage of patients with an E1 score was 77% (n = 7) (COVID-19–related group) compared to 35% (n = 23) (COVID-19–unrelated group). Other clinicopathologic variables are summarized in Table 6. In the COVID-19–related group, no patients progressed to ESRD or CKD stage 4, while in the COVID-19–unrelated group, 16 (24%) patients showed ESRD progression, 18 (27%) showed CKD stage 4 progression, and 16 (24%) showed eGFR-25% progression. In KM55 IHC, the COVID-19–unrelated group had a significantly higher mesangial KM55 score (median, 3; IQR, 2 to 3) than the COVID-19–related group (median, 1; IQR, 1 to 2.5) (p = .022).
RESULTS
- Recent biological research has emphasized the importance of Gd-IgA1 in the pathophysiology of IgAN [2]. Gd-IgA1 is proposed to form immune complexes that accumulate in the glomerular mesangium, stimulating mesangial cell proliferation and matrix production [2]. In this context, various studies have focused on measuring Gd-IgA1 levels in the plasma and tissues of patients with IgAN. Earlier methods relied on Helix aspersa agglutinin lectin, but these were limited by batch-dependent bioactivity and stability issues [5]. More recently, Yasutake et al. [5] developed a novel monoclonal antibody, KM55, specifically targeting Gd-IgA1. When integrated with ELISA, KM55 enables several studies to measure serum Gd-IgA1 levels without relying on lectin-based assays or mass spectrometry [3,5,6]. This study applied KM55 IHC to detect mesangial deposition of pathogenic Gd-IgA1 in renal biopsy specimens from patients with IgAN. Significantly higher KM55 scores were observed in IgAN cases compared to the non-IgAN group.
- Several studies have employed KM55 using different methods to understand IgAN. Zhang et al. [3] reported significantly elevated serum Gd-IgA1 concentration in patients with IgAN using the KM55-based assay; qualitative differences in KM55 IHC staining were noted between the IgAN and non-IgAN groups, though no formal statistical analysis of IHC scores was performed. Additional research utilizing KM55 IF staining identified granular Gd-IgA1 deposits in biopsies from primary and secondary IgAN, as well as Henoch-Schönlein purpura (HSP), whereas other glomerular diseases such as membranoproliferative glomerulonephritis, lupus nephritis, and IgA-related monoclonal gammopathy of renal significance, shows significantly lower KM55 intensity [4,12,13]. Ishiko et al. [14] applied IF staining in pediatric patients, including 17 IgAN cases and various other glomerular diseases, to assess the specificity of KM55. However, the study was limited by a small sample size and insufficient glomeruli per case. Raj et al. [4] reported the specificity of KM55 staining in IgAN and HSP. Meanwhile, Zhao et al. [15] evaluated KM55 IF staining in 40 IgAN cases and other glomerular diseases, demonstrating a significant correlation between Gd-IgA1 deposition scores and the odds of IgAN; however, KM55 expression was not entirely IgAN-specific; however, IF staining has limitations, including poor compatibility with long-term storage or paraffin blocks, and the need for specialized equipment and a darkroom.
- In our study, 39 cases were classified as non-IgAN entities. Among them, two were diagnosed with pauci-immune crescentic glomerulonephritis and one with FSGS, not otherwise specified, despite mild IgA expression on IF. The pauci-immune crescentic glomerulonephritis cases were characterized by marked crescent formation on light microscopy and the absence of mesangial EDD on EM. Of those two cases, one demonstrated anti-neutrophil cytoplasmic antibody positivity on serologic testing, presented with rapidly progressive glomerulonephritis, and lacked definite features of mesangial expansion. The diagnosis of the FSGS case was supported by the absence of mesangial hypercellularity on light microscopy and the absence of EDD on EM. Our study assessed the diagnostic utility of KM55 IHC in distinguishing IgAN from other glomerular diseases. The optimal KM55 score cutoff for diagnosing IgAN was determined as ≥2+. Eighteen IgAN cases exhibited only a 1+ score, suggesting the potential for false-negative results. Therefore, KM55 scoring demands a meticulous examination of the mesangial area. Meanwhile, KM55 1+ IgAN cases had significantly lower serum IgA levels than other IgAN cases, implying that serum IgA levels could aid interpretation when KM55 IHC results are borderline. Four non-IgAN cases, all lupus nephritis, showed a KM55 score of 2+, potentially compromising specificity. In these cases, the first patient had IF intensities of IgA, IgG, C3, and C1q at 2+, 3+, 3+, and 3+, respectively. The second patient had ill-defined mesangial EDD, with IF intensities of IgA, IgG, C3, and C1q at 2+, 3+, 1+, and 2+. The third patient exhibited lumpy EDD and IF intensities of IgA, IgG, C3, and C1q at 2+, 3+, 1+, and 1+. The fourth patient showed IF intensities of IgA, IgG, C3, and C1q at 1+, 1+, 2+, and 2+. The EM findings of the first and fourth patients revealed no clear mesangial EDD, though subepithelial and intramembranous deposits were present. These findings underscore the interpretive challenge in distinguishing mesangial from subepithelial regions in glomerular IHC slides. There is a possibility of non-specific staining in IHC, which may lead to overestimation of mesangial Gd-IgA1 deposition in KM55 IHC. In such cases, EM is a useful ancillary tool to exclude false-positives, especially when differential diagnosis is required. All four false-positive cases in our study were lupus nephritis, highlighting the importance of clinical correlation, especially in evaluating for SLE. Although KM55 is a helpful diagnostic adjunct, clinical and serologic data must be carefully considered. Among the patients with KM55 2+ non-IgAN, only one had serum IgA data (247 mg/dL at the time of biopsy), which was comparable to the average in other patients without IgAN (303.0 ± 173.5 mg/dL, p = .249). Although serum IgA levels in the IgAN group tended to increase with higher KM55 scores, this correlation was not observed in the non-IgAN group. This finding suggests that false-positive KM55 scores in non-IgAN cases likely result from non-specific staining rather than actual deposition of circulating aberrant IgA.
- KM55 IHC likely reflects the extent of Gd-IgA1 deposition, and the observed correlation between the M score and KM55 score in our findings supports existing understanding on IgAN pathogenesis —namely, that mesangial Gd-IgA1 deposition promotes matrix formation and mesangial cell proliferation via complement activation [2]. Moreover, tubular atrophy and interstitial fibrosis, reflecting chronicity of disease, correlated with KM55 scores which might be proportional to disease progression time, reinforcing this relationship. Among clinical characteristics, BUN, UPCR, diastolic blood pressure, eGFR, serum albumin, and serum IgA levels were significantly associated with KM55 score, implying that mesangial Gd-IgA1 deposition may influence renal impairment, hypertension, and proteinuria, in line with prior research. Zhang et al. [3] reported that plasma Gd-IgA1 levels measured via ELISA using KM55 significantly correlated with serum uric acid and IgA levels, while Oxford classification variables did not. In the same study, mesangial KM55 IHC scores showed no significant correlation with plasma Gd-IgA1 levels, and the relationship between KM55 scores and clinical variables was not examined [3]. Conversely, Martin-Penagos et al. [6] found the M and T scores of Oxford classification correlating with plasma Gd-IgA1 levels. Our study demonstrated a similar relationship at the IHC level, supporting the potential of KM55 IHC scoring as a clinical biomarker. Moreover, mesangial Gd-IgA1 deposition, semi-quantified by KM55 IHC, may have prognostic value in IgAN. Although the mesangial KM55 score was not significant in multivariate Cox regression, it emerged as an essential risk factor for progression to CKD stage 4 and ESRD progression in univariate Cox and Kaplan-Meier analyses. This predictive value may partially reflect its association with M and T scores, as noted in multivariate analysis. Whether KM55 scoring can be incorporated into the Oxford classification remains uncertain and requires further validation. Its prognostic utility persisted even after adjusting for initial renal function. While lower eGFR at baseline was correlated with KM55 scores, KM55 retained prognostic significance for eGFR-25%.
- Recent reports have documented several new-onset IgAN cases during the COVID-19 pandemic, potentially triggered by vaccines such as BNT162b2 (Pfizer Inc., New York, NY, USA; BioNTech SE, Mainz, Germany) and mRNA-1273 (Moderna, Inc., Cambridge, MA, USA). As of October 2022, at least 52 post-vaccination IgAN cases had been reported, suggesting a possible vaccine-related flare-up [16]. However, the underlying pathophysiologic mechanisms remain unclear. In our cohort, KM55 scores were significantly lower in COVID-19–associated IgAN cases, though the clinical relevance of this result warrants further investigation. The number of COVID-19–related cases was limited. The COVID-19 vaccination may transiently exacerbate renal disease, potentially facilitating earlier detection of IgAN. In our cohort, no patients with COVID-19–related IgAN progressed to ESRD, CKD stage 4, or experienced eGFR-25%. These cases were relatively recent and likely lacked sufficient follow-up duration for renal deterioration. Tang et al. [12] previously reported that primary IgAN cases exhibited significantly higher KM55 intensity and KM55/IgA ratio using IF. Conversely, other studies found no differences in Gd-IgA1 staining intensity [17], plasma Gd-IgA1 levels, IgA1-IgG complexes, or IF features between primary and secondary IgAN [18]. Regarding COVID-19, one cohort study noted significantly lower eGFR in vaccinated individuals with pre-existing IgAN [19]. A case report of post-vaccination IgAN revealed mesangial Gd-IgA1 and C3 co-deposition on IF [20]. Another review of 17 post–COVID-19 infection or vaccination IgAN and IgA vasculitis cases found most had a regressive course [21]. Long-term studies are warranted.
- This study has several limitations. More extensive sample sizes are needed to establish the clinical and prognostic relevance of KM55 scoring. Inter-observer variability in mesangial KM55 grading is possible. Implementing more quantitative approaches, such as digital pathology or artificial intelligence-based scoring, may improve consistency. Although KM55 IHC showed prognostic potential in univariate Cox analysis, no significant hazard ratio was observed in the multivariate model.
- In conclusion, KM55 IHC can be a practical tool for pathologists in evaluating IgAN. It offers significant utility in distinguishing IgAN from other glomerular diseases. Moreover, this study supports the pathophysiological role of mesangial Gd-IgA1 deposition in IgAN development and subsequent renal dysfunction. Given its prognostic potential demonstrated here, KM55 should be considered for integration into the routine pathological assessment of IgAN, pending further validation.
DISCUSSION
Ethics Statement
This research received approval from the Institutional Review Board of Severance Hospital, Seoul, Korea (IRB no. 4-2023-0868). Formal written informed consent was not required with a waiver by the appropriate IRB.
Availability of Data and Material
The datasets generated or analyzed during the study are not publicly available due to protect personal information of patients but are available from the corresponding author on reasonable request.
Code Availability
Not applicable.
Author Contributions
Conceptualization: MJ, HIJ. Data curation: HIJ. Formal analysis: HIJ. Investigation: HIJ. Methodology: HIJ, MJ. Resources: MJ, BJL. Supervision: MJ. Writing—original draft: HIJ. Writing—review & editing: MJ, HIJ. Approval of final manuscript: all authors.
Conflicts of Interest
The authors declare that they have no potential conflicts of interest.
Funding Statement
This work was supported by The Korean Society of Pathologist Grant no. KSPG2023-01. This work was also supported by the National Research Foundation of Korea(NRF) grant funded by the Korea government(MSIT) (RS-2024-00341570).
Acknowledgments
The authors thank the effort of GaYeong Kim from University Industry Foundation, Yonsei University.


| Characteristic | IgAN group (n = 75) | Non-IgAN group (n = 39) | p-value |
|---|---|---|---|
| Male sex | 24 (32.0) | 12 (31.0) | >.99 |
| Age (yr) | 38.6 ± 15.7 | 41.2 ± 12.1 | .226 |
| Microscopic hematuria (≥3 RBC/HPF) | 70 (93.3) | 34 (87.2) | .451 |
| Proteinuria (UPCR, g/g Cr) | 1.33 (0.72–2.50) | 2.81 (1.46–6.78) | <.001 |
| Serum creatinine (mg/dL) | 0.95 (0.71–1.21) | 0.79 (0.55–0.97) | .212 |
| Serum albumin (g/dL) | 4.2 (3.7–4.3) | 2.8 (2.2–3.5) | <.001 |
| eGFR (mL/min/1.73 m2) | 84.0 (60.0–113.0) | 103.0 (78.5–119.5) | .467 |
| Hemoglobin (g/dL) | 13.1 ± 1.7 | 10.4 ± 2.5 | <.001 |
| WBC count (/μL) | 6,740 (5,420–7,960) | 5,570 (2,500–8,540) | .022 |
| Platelet (×10³/μL) | 265 (217–310) | 220 (121–300) | .003 |
| EDD in mesangium | 71/71a (100) | 29/39 (74.4) | <.001 |
| IF IgA intensity (1+, 2+, 3+) | 5, 30, 40 | 20, 15, 4 | <.001 |
Values are presented as number (%), mean ± SD, or median (IQR).
IgAN, IgA nephropathy; RBC, red blood cell; HPF, high-power field; UPCR, urine protein/creatinine ratio; eGFR, estimated glomerular filtration rate; WBC, white blood cell; EDD, electron-dense deposit; IF, immunofluorescence; SD, standard deviation; IQR, interquartile range.
aCase without identifiable glomeruli in electron microscopy is excluded.
| Mesangial KM55 score, median (range) | p-valuea | |
|---|---|---|
| M score | .017 | |
| M0 | 2 (1–3) | |
| M1 | 3 (2.5–3) | |
| E score | .434 | |
| E0 | 2 (1–3) | |
| E1 | 3 (2–3) | |
| S score | .080 | |
| S0 | 2 (1–3) | |
| S1 | 3 (2–3) | |
| T score | .049 | |
| T0 | 2 (1–3) | |
| T1 and T2 | 3 (3–3) | |
| C score | .881 | |
| C0 | 3 (1–3) | |
| C1 and C2 | 2 (2–3) | |
| Haas classification | .233 | |
| I | 2 (1–3) | |
| II | 3 (1–3) | |
| III | 2 (1–3) | |
| IV | 3 (2–3) | |
| V | 3 (1.75–4) |
| Characteristic | KM55 1+ (n = 18) | KM55 2+ (n = 19) | KM55 3+ (n = 29) | KM55 4+ (n = 9) | p-value |
|---|---|---|---|---|---|
| Male sex | 5 (27.8) | 6 (31.6) | 11 (37.9) | 2 (22.2) | .808 |
| Age (yr) | 37.4 ± 18.1 | 35.2 ± 15.3 | 40.0 ± 14.2 | 50.2 ± 12.8 | .111 |
| Microscopic hematuria | 17 (94.4) | 17 (89.5) | 28 (96.6) | 8 (88.9) | .855 |
| UPCR (g/g Cr) | 1.03 (0.64–1.46) | 1.23 (0.45–2.11) | 1.58 (0.73–2.77) | 2.05 (1.02–2.87) | .172 |
| Serum creatinine (mg/dL) | 0.92 (0.75–1.13) | 0.72 (0.58–0.97) | 1.04 (0.82–1.32) | 1.16 (0.81–1.37) | .015 |
| Serum BUN (mg/dL) | 14.0 (11.1–18.6) | 11.3 (8.5–15.5) | 15.8 (11.6–19.5) | 16.1 (12.9–19.4) | .078 |
| Serum uric acid (mg/dL) | 5.25 (3.98–6.48) | 4.90 (3.30–6.40) | 5.30 (4.25–7.20) | 6.50 (4.70–6.95) | .232 |
| eGFR (mL/min/1.73 m2) | 90.33 ± 42.45 | 105.68 ± 32.83 | 78.72 ± 32.45 | 67.67 ± 20.75 | .020 |
| Serum albumin (g/dL) | 4.3 (4.2–4.6) | 4.2 (3.8–4.3) | 4.0 (3.6–4.3) | 3.9 (3.7–4.2) | .008 |
| Systolic blood pressure (mmHg) | 125.0 (112.8–135.3) | 120.0 (105.0–135.0) | 124.0 (120.0–130.5) | 127.0 (121.0–135.0) | .508 |
| Diastolic blood pressure (mmHg) | 73.5 (66.5–79.3) | 75.0 (70.0–85.0) | 80.0 (70.0–85.5) | 80.0 (80.0–87.0) | .083 |
| Hemoglobin (g/dL) | 13.51 ± 1.75 | 12.62 ± 1.34 | 13.12 ± 1.90 | 13.00 ± 2.00 | .487 |
| White blood cell count (/μL) | 7,240 (5,358–7,638) | 6,720 (5,090–7,840) | 6,650 (5,515–7,710) | 9,240 (4,855–10,450) | .774 |
| Platelet count (×10³/μL) | 283.5 (216.0–318.3) | 271.0 (249.0–363.0) | 248.0 (214.5–289.0) | 261.0 (189.0–346.0) | .396 |
| Immunosuppressant use (%) | 3 (16.7) | 9 (47.4) | 14 (48.3) | 5 (55.6) | .113 |
| Serum C3 (mg/dL) | 107.00 (99.73–125.28)a | 108.85 (94.60–133.40)b | 102.00 (92.95–118.90)c | 122.10 (98.40–134.05)d | .324 |
| Serum C4 (mg/dL) | 25.58 (19.18–34.72)a | 25.47 (21.98–31.01)b | 25.36 (19.93–29.70)c | 32.40 (23.25–42.92)d | .486 |
| Serum IgA (mg/dL) | 237.39 ± 76.72e | 280.87 ± 130.57f | 343.42 ± 141.06g | 312.89 ± 54.37h | .050 |
| ESRD progression | 1 (5.6) | 1 (5.3) | 9 (31.0) | 5 (55.6) | .003 |
| CKD stage 4 progression | 1 (5.6) | 2 (10.5) | 9 (31.0) | 6 (66.7) | .002 |
| eGFR-25% occurrence | 0 | 2 (10.5) | 9 (31.0) | 5 (55.6) | .002 |
| Days before biopsy | 74 (31.75–296.5) | 55 (34–238) | 80 (29.5–278.5) | 59 (53–126.5) | .935 |
| Oxford classification | |||||
| M1 | 2 (11.1) | 3 (15.8) | 13 (44.8) | 3 (33.3) | .042 |
| E1 | 5 (27.8) | 8 (42.1) | 14 (48.3) | 3 (33.3) | .542 |
| S1 | 9 (50.0) | 12 (63.2) | 19 (65.5) | 8 (88.9) | .272 |
| T1 and T2 | 1 (5.6) | 1 (5.3) | 7 (24.1) | 2 (22.2) | .172 |
| C1 and C2 | 5 (27.8) | 11 (57.9) | 10 (34.5) | 3 (33.3) | .250 |
Values are presented as number (%), mean ± SD, or median (IQR).
IgAN, IgA nephropathy; UPCR, urine protein/creatinine ratio; BUN, blood urea nitrogen; eGFR, estimated glomerular filtration rate; ESRD, end-stage renal disease; CKD, chronic kidney disease; eGFR-25%, ≥75% reduction from baseline eGFR; SD, standard deviation; IQR, interquartile range.
a18 cases included;
b18 cases included;
c25 cases included;
d9 cases included;
e16 cases included;
f18 cases included;
g22 cases included;
h9 cases included.
| Characteristic | KM55-high group (n = 38) | KM55-low group (n = 37) | p-value |
|---|---|---|---|
| Male sex | 13 (34.2) | 11 (29.7) | .866 |
| Age (yr) | 40.9 ± 14.7 | 36.3 ± 16.6 | .207 |
| Microscopic hematuria | 36 (94.7) | 34 (91.9) | .674 |
| UPCR (g/g Cr) | 1.73 (0.81–2.82) | 1.13 (0.61–1.79) | .048 |
| Serum creatinine (mg/dL) | 1.07 (0.81–1.31) | 0.84 (0.60–0.99) | .003 |
| Serum BUN (mg/dL) | 15.9 (11.7–19.3) | 12.9 (10.2–17.0) | .041 |
| Serum uric acid (mg/dL) | 5.86 ± 1.57 | 5.20 ± 1.65 | .083 |
| eGFR (mL/min/1.73 m2) | 76.11 ± 30.21 | 98.22 ± 38.08 | .007 |
| Serum albumin (g/dL) | 3.90 (3.68–4.30) | 4.20 (4.10–4.45) | .010 |
| SBP (mmHg) | 124.5 (120.0–130.3) | 120.0 (108.0–135.0) | .279 |
| DBP (mmHg) | 80.0 (70.8–85.3) | 75.0 (67.5–80.0) | .027 |
| Hemoglobin (g/dL) | 13.09 ± 1.90 | 13.05 ± 1.60 | .925 |
| White blood cell count (/μL) | 6,665 (5,383–8,948) | 7,010 (5,295–7,775) | .990 |
| Platelet count (×10³/μL) | 250.5 (213.8–291.0) | 272.0 (233.0–324.5) | .101 |
| Immunosuppressant usage | 19 (50.0) | 12 (32.4) | .190 |
| Serum C3 (mg/dL) | 103.85 (93.63–125.43)a | 107.00 (97.05–125.63)b | .522 |
| Serum C4 (mg/dL) | 26.24 (20.93–35.50)a | 25.47 (20.58–32.14)b | .677 |
| Serum IgA (mg/dL) | 334.55 ± 122.13c | 260.41 ± 109.29d | .012 |
| ESRD progression | 14 (36.8) | 2 (5.4) | <.001 |
| CKD stage 4 progression | 15 (39.5) | 3 (8.1) | <.001 |
| eGFR-25% occurrence | 14 (36.8) | 2 (5.4) | <.001 |
| Days before biopsy | 62 (43.25-223.5) | 63 (34-251.5) | .937 |
| Oxford classification | |||
| M1 | 16 (42.1) | 5 (13.5) | .012 |
| E1 | 17 (44.7) | 13 (35.1) | .540 |
| S1 | 27 (71.1) | 21 (56.8) | .294 |
| T1 and T2 | 9 (23.7) | 2 (5.4) | .056 |
| C1 and C2 | 13 (34.2) | 16 (43.2) | .571 |
Values are presented as number (%), mean ± SD, or median (IQR).
IgAN, IgA nephropathy; UPCR, urine protein/creatinine ratio; BUN, blood urea nitrogen; eGFR, estimated glomerular filtration rate; SBP, systolic blood pressure; DBP, diastolic blood pressure; ESRD, end-stage renal disease; CKD, chronic kidney disease; eGFR-25%, ≥75% reduction from baseline eGFR; SD, standard deviation; IQR, interquartile range.
a34 cases included;
b36 cases included;
c31 cases included;
d34 cases included.
Values are presented as number (%) or mean ± SD unless otherwise indicated.
IgAN, IgA nephropathy; COVID-19, coronavirus disease 2019; UPCR, urine protein/creatinine ratio; IQR, interquartile range; eGFR; estimated glomerular filtration rate; CKD-EPI, chronic kidney disease Epidemiology Collaboration; SBP, systolic blood pressure; DBP, diastolic blood pressure; BUN, blood urea nitrogen; ESRD, end-stage renal disease; CKD, chronic kidney disease; eGFR-25%, ≥75% reduction from baseline eGFR; IF, immunofluorescence; SD, standard deviation.
- 1. Seo KJ, Kim TJ, Lee KY, Shim SI, Choi YJ. IgA nephropathy: correlation of WHO classification and morphologic semi-quantitative scoring system. Korean J Pathol 2009; 43: 244-9. Article
- 2. Stamellou E, Seikrit C, Tang SC, et al. IgA nephropathy. Nat Rev Dis Primers 2023; 9: 67.ArticlePubMedPDF
- 3. Zhang K, Li Q, Zhang Y, et al. Clinical significance of galactose-deficient IgA1 by KM55 in patients with IgA nephropathy. Kidney Blood Press Res 2019; 44: 1196-206. ArticlePubMedPDF
- 4. Raj R, Sharma A, Barwad A, et al. KM55 in the evaluation of IgA-containing glomerular diseases. Glomerular Dis 2022; 2: 59-74. ArticlePubMedPDF
- 5. Yasutake J, Suzuki Y, Suzuki H, et al. Novel lectin-independent approach to detect galactose-deficient IgA1 in IgA nephropathy. Nephrol Dial Transplant 2015; 30: 1315-21. ArticlePubMedPMC
- 6. Martin-Penagos L, Fernandez-Fresnedo G, Benito-Hernandez A, et al. Measurement of galactosyl-deficient IgA1 by the monoclonal antibody KM55 contributes to predicting patients with IgA nephropathy with high risk of long-term progression. Nefrologia (Engl Ed) 2021; 41: 311-20. Article
- 7. Aringer M, Costenbader K, Daikh D, et al. 2019 European League Against Rheumatism/American College of Rheumatology classification criteria for systemic lupus erythematosus. Arthritis Rheumatol 2019; 71: 1400-12. PubMedPMC
- 8. Kim HW, Kim EH, Roh YH, et al. Glomerulonephritis following COVID-19 infection or vaccination: a multicenter study in South Korea. Kidney Res Clin Pract 2024; 43: 165-76. ArticlePubMedPMCPDF
- 9. Trimarchi H, Barratt J, Cattran DC, et al. Oxford classification of IgA nephropathy 2016: an update from the IgA Nephropathy Classification Working Group. Kidney Int 2017; 91: 1014-21. PubMed
- 10. Working Group of the International IgA Nephropathy Network and the Renal Pathology Society, Roberts IS, Cook HT, et al. The Oxford classification of IgA nephropathy: pathology definitions, correlations, and reproducibility. Kidney Int 2009; 76: 546-56. PubMed
- 11. Haas M. Histologic subclassification of IgA nephropathy: a clinicopathologic study of 244 cases. Am J Kidney Dis 1997; 29: 829-42. ArticlePubMed
- 12. Tang X, Zheng J, Jiang X, et al. The significance of galactose-deficient immunoglobulin A1 staining in kidney diseases with IgA deposition. Int Urol Nephrol 2023; 55: 2119-29. ArticlePubMedPDF
- 13. Bu L, Ye B, Kouri AM, Kim Y. Diagnostic utility of galactose-deficient immunoglobulin A1 immunostaining in the differentiation of lupus nephritis and immunoglobulin A nephropathy. Glomerular Dis 2021; 1: 34-9. ArticlePubMedPMCPDF
- 14. Ishiko S, Horinouchi T, Fujimaru R, et al. Glomerular galactose-deficient IgA1 expression analysis in pediatric patients with glomerular diseases. Sci Rep 2020; 10: 14026.ArticlePubMedPMCPDF
- 15. Zhao L, Peng L, Yang D, et al. Immunostaining of galactose-deficient IgA1 by KM55 is not specific for immunoglobulin A nephropathy. Clin Immunol 2020; 217: 108483.ArticlePubMed
- 16. Mima A, Lee S. IgA nephropathy after COVID-19 vaccination and analysis of reported cases. Heliyon 2023; 9: e17206. ArticlePubMedPMC
- 17. Cassol CA, Bott C, Nadasdy GM, et al. Immunostaining for galactose-deficient immunoglobulin A is not specific for primary immunoglobulin A nephropathy. Nephrol Dial Transplant 2020; 35: 2123-9. ArticlePubMedPDF
- 18. Wang M, Lv J, Zhang X, Chen P, Zhao M, Zhang H. Secondary IgA nephropathy shares the same immune features with primary IgA nephropathy. Kidney Int Rep 2020; 5: 165-72. ArticlePubMed
- 19. Chen CH, Wu MJ, Tsai SF. Safety and effectiveness of COVID-19 vaccines in patients with IgA nephropathy: a retrospective cohort study from the TriNetX global collaborative networks. EClinicalMedicine 2023; 65: 102306.ArticlePubMedPMC
- 20. Nihei Y, Kishi M, Suzuki H, et al. IgA nephropathy with gross hematuria following COVID-19 mRNA vaccination. Intern Med 2022; 61: 1033-7. ArticlePubMedPMC
- 21. Farooq H, Aemaz Ur Rehman M, Asmar A, Asif S, Mushtaq A, Qureshi MA. The pathogenesis of COVID-19-induced IgA nephropathy and IgA vasculitis: a systematic review. J Taibah Univ Med Sci 2022; 17: 1-13. ArticlePubMed
REFERENCES
Figure & Data
References
Citations
- IgA Nephropathy: Mechanisms, Risk Stratification, and Precision Therapy
Sami Alobaidi
Diagnostics.2026; 16(9): 1259. CrossRef
 PubReader
 ePub Link
-
 Cite this Article
- Cite this Article
-
- Close
- Download Citation
- Close
- Figure
-


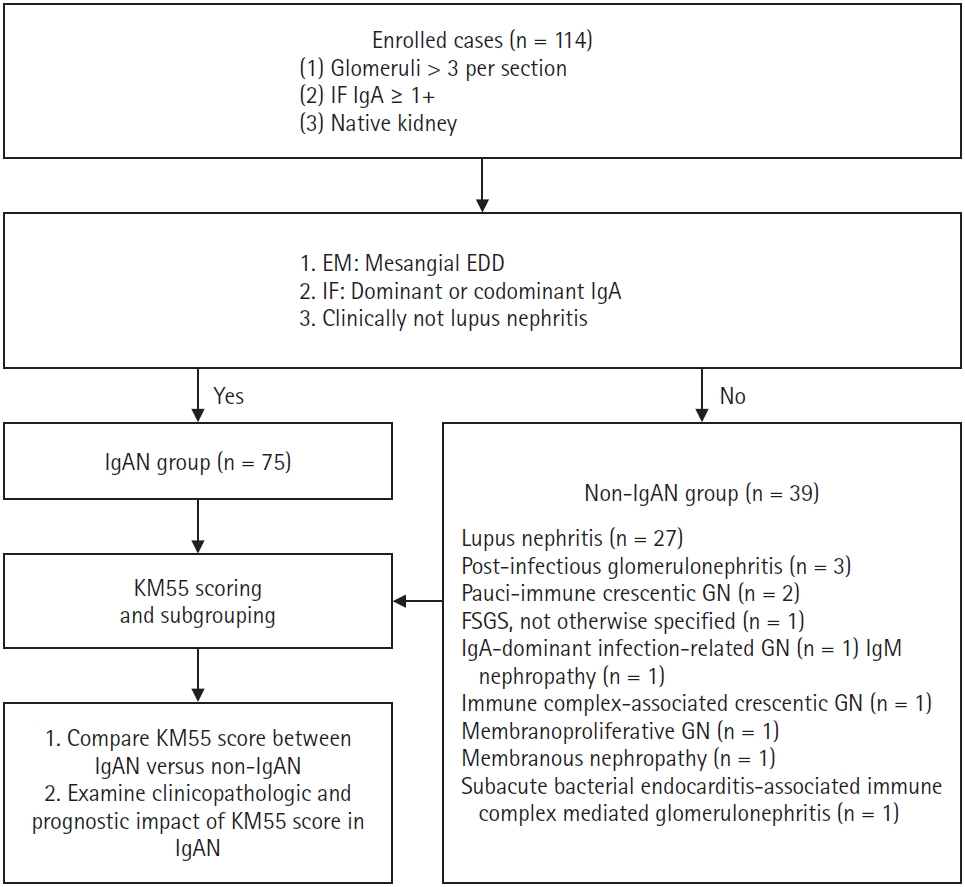

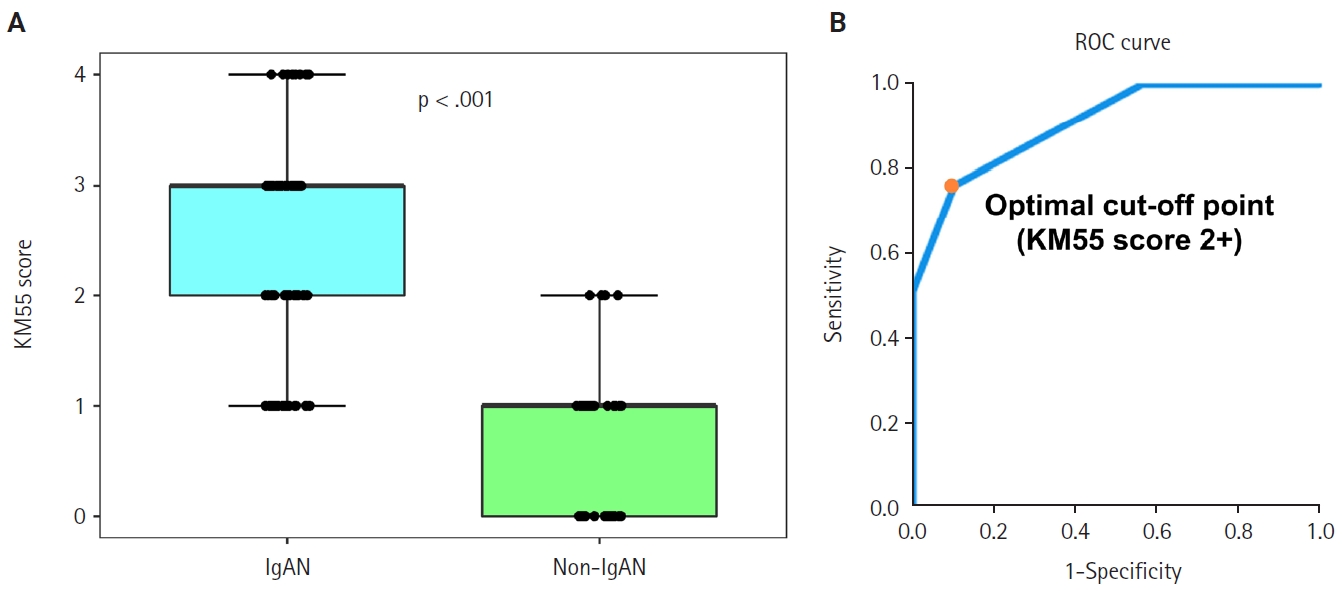

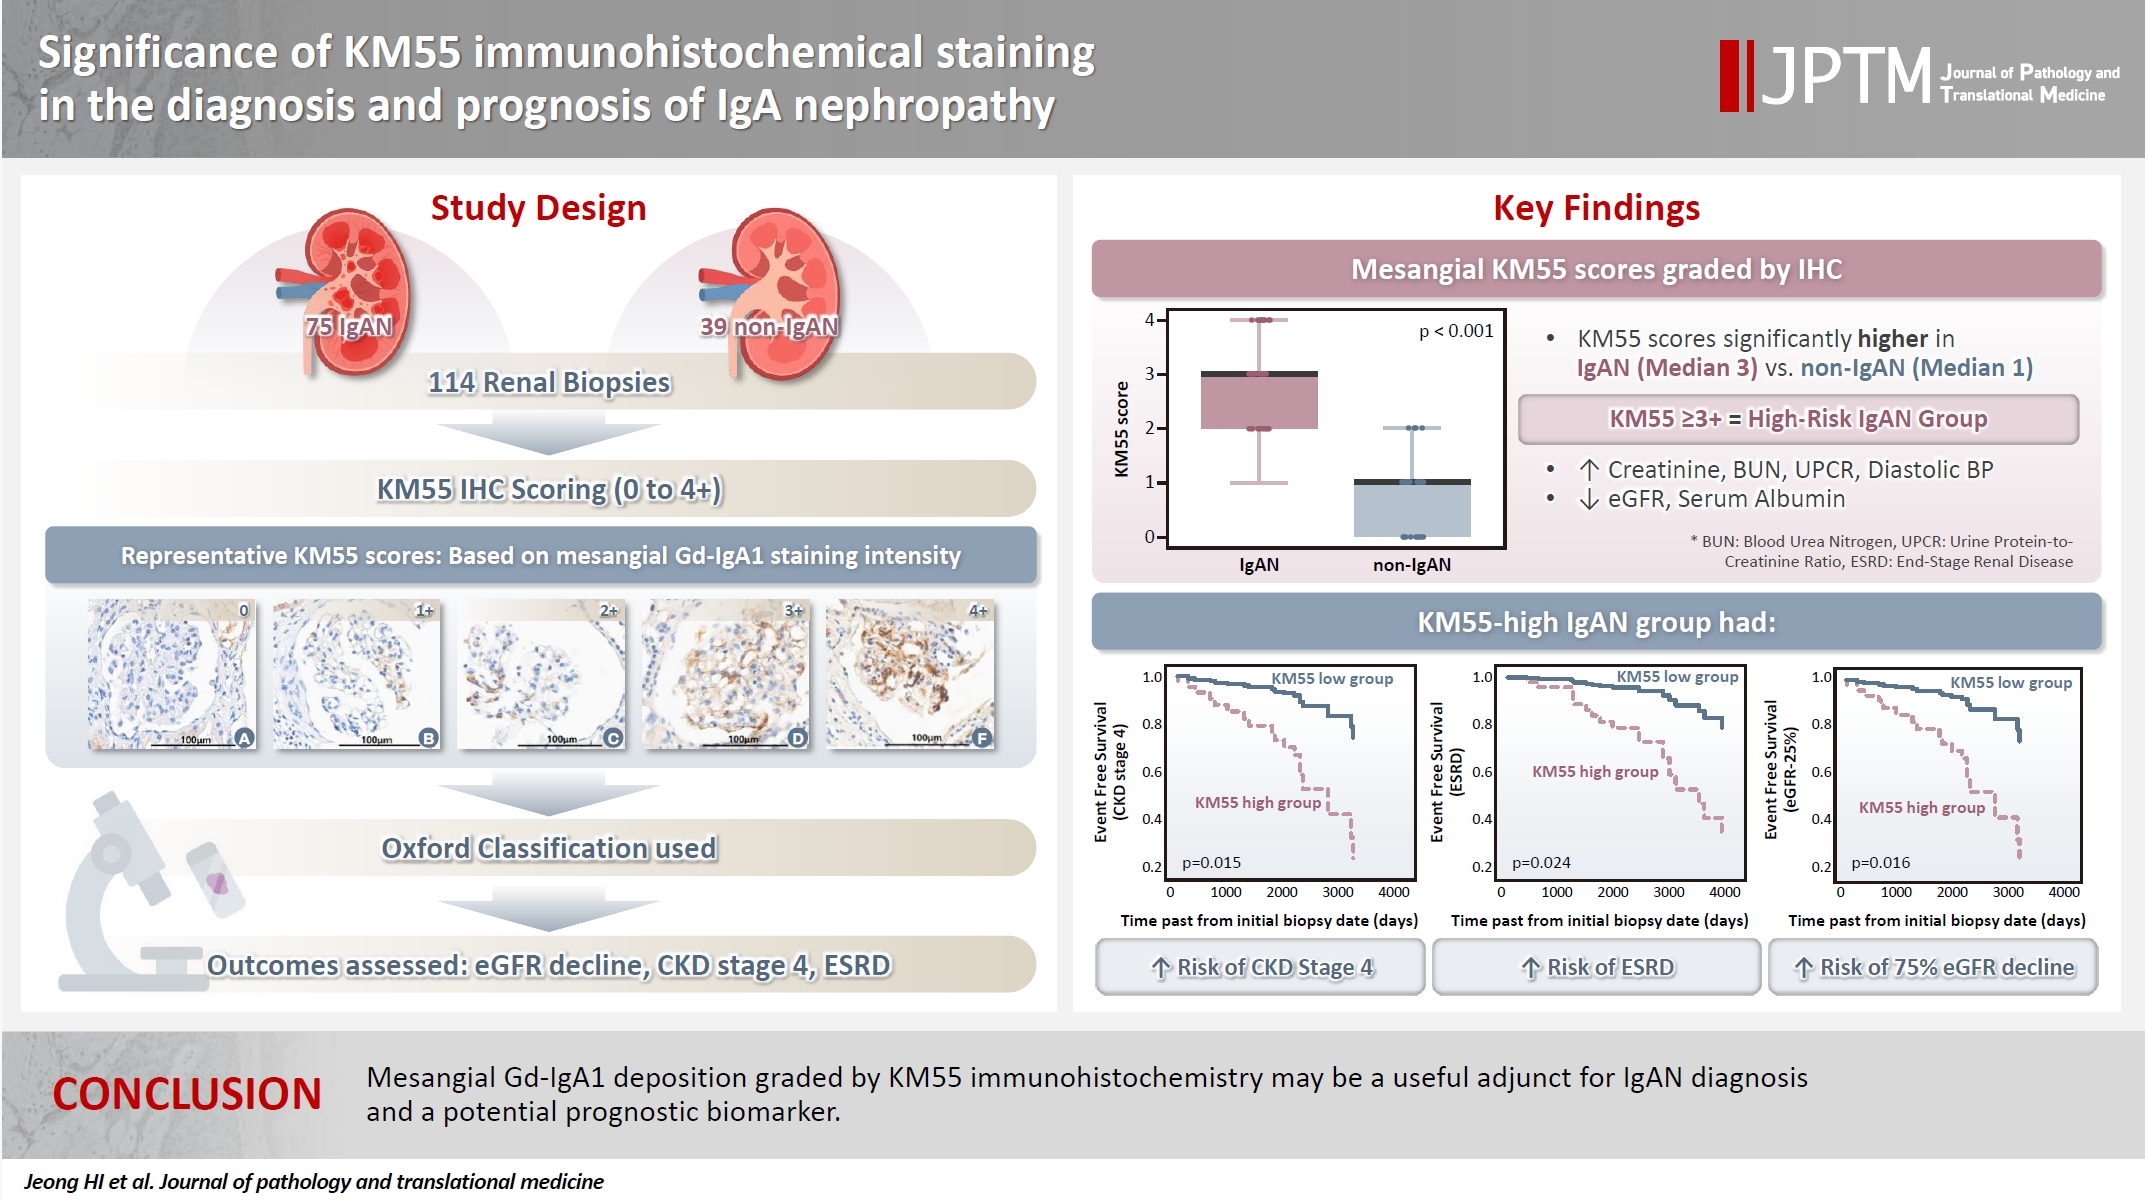
Fig. 1.
Fig. 2.
Fig. 3.
Fig. 4.
Graphical abstract
| Characteristic | IgAN group (n = 75) | Non-IgAN group (n = 39) | p-value |
|---|---|---|---|
| Male sex | 24 (32.0) | 12 (31.0) | >.99 |
| Age (yr) | 38.6 ± 15.7 | 41.2 ± 12.1 | .226 |
| Microscopic hematuria (≥3 RBC/HPF) | 70 (93.3) | 34 (87.2) | .451 |
| Proteinuria (UPCR, g/g Cr) | 1.33 (0.72–2.50) | 2.81 (1.46–6.78) | <.001 |
| Serum creatinine (mg/dL) | 0.95 (0.71–1.21) | 0.79 (0.55–0.97) | .212 |
| Serum albumin (g/dL) | 4.2 (3.7–4.3) | 2.8 (2.2–3.5) | <.001 |
| eGFR (mL/min/1.73 m2) | 84.0 (60.0–113.0) | 103.0 (78.5–119.5) | .467 |
| Hemoglobin (g/dL) | 13.1 ± 1.7 | 10.4 ± 2.5 | <.001 |
| WBC count (/μL) | 6,740 (5,420–7,960) | 5,570 (2,500–8,540) | .022 |
| Platelet (×10³/μL) | 265 (217–310) | 220 (121–300) | .003 |
| EDD in mesangium | 71/71 |
29/39 (74.4) | <.001 |
| IF IgA intensity (1+, 2+, 3+) | 5, 30, 40 | 20, 15, 4 | <.001 |
| Mesangial KM55 score, median (range) | p-value |
|
|---|---|---|
| M score | .017 | |
| M0 | 2 (1–3) | |
| M1 | 3 (2.5–3) | |
| E score | .434 | |
| E0 | 2 (1–3) | |
| E1 | 3 (2–3) | |
| S score | .080 | |
| S0 | 2 (1–3) | |
| S1 | 3 (2–3) | |
| T score | .049 | |
| T0 | 2 (1–3) | |
| T1 and T2 | 3 (3–3) | |
| C score | .881 | |
| C0 | 3 (1–3) | |
| C1 and C2 | 2 (2–3) | |
| Haas classification | .233 | |
| I | 2 (1–3) | |
| II | 3 (1–3) | |
| III | 2 (1–3) | |
| IV | 3 (2–3) | |
| V | 3 (1.75–4) |
| Characteristic | KM55 1+ (n = 18) | KM55 2+ (n = 19) | KM55 3+ (n = 29) | KM55 4+ (n = 9) | p-value |
|---|---|---|---|---|---|
| Male sex | 5 (27.8) | 6 (31.6) | 11 (37.9) | 2 (22.2) | .808 |
| Age (yr) | 37.4 ± 18.1 | 35.2 ± 15.3 | 40.0 ± 14.2 | 50.2 ± 12.8 | .111 |
| Microscopic hematuria | 17 (94.4) | 17 (89.5) | 28 (96.6) | 8 (88.9) | .855 |
| UPCR (g/g Cr) | 1.03 (0.64–1.46) | 1.23 (0.45–2.11) | 1.58 (0.73–2.77) | 2.05 (1.02–2.87) | .172 |
| Serum creatinine (mg/dL) | 0.92 (0.75–1.13) | 0.72 (0.58–0.97) | 1.04 (0.82–1.32) | 1.16 (0.81–1.37) | .015 |
| Serum BUN (mg/dL) | 14.0 (11.1–18.6) | 11.3 (8.5–15.5) | 15.8 (11.6–19.5) | 16.1 (12.9–19.4) | .078 |
| Serum uric acid (mg/dL) | 5.25 (3.98–6.48) | 4.90 (3.30–6.40) | 5.30 (4.25–7.20) | 6.50 (4.70–6.95) | .232 |
| eGFR (mL/min/1.73 m2) | 90.33 ± 42.45 | 105.68 ± 32.83 | 78.72 ± 32.45 | 67.67 ± 20.75 | .020 |
| Serum albumin (g/dL) | 4.3 (4.2–4.6) | 4.2 (3.8–4.3) | 4.0 (3.6–4.3) | 3.9 (3.7–4.2) | .008 |
| Systolic blood pressure (mmHg) | 125.0 (112.8–135.3) | 120.0 (105.0–135.0) | 124.0 (120.0–130.5) | 127.0 (121.0–135.0) | .508 |
| Diastolic blood pressure (mmHg) | 73.5 (66.5–79.3) | 75.0 (70.0–85.0) | 80.0 (70.0–85.5) | 80.0 (80.0–87.0) | .083 |
| Hemoglobin (g/dL) | 13.51 ± 1.75 | 12.62 ± 1.34 | 13.12 ± 1.90 | 13.00 ± 2.00 | .487 |
| White blood cell count (/μL) | 7,240 (5,358–7,638) | 6,720 (5,090–7,840) | 6,650 (5,515–7,710) | 9,240 (4,855–10,450) | .774 |
| Platelet count (×10³/μL) | 283.5 (216.0–318.3) | 271.0 (249.0–363.0) | 248.0 (214.5–289.0) | 261.0 (189.0–346.0) | .396 |
| Immunosuppressant use (%) | 3 (16.7) | 9 (47.4) | 14 (48.3) | 5 (55.6) | .113 |
| Serum C3 (mg/dL) | 107.00 (99.73–125.28) |
108.85 (94.60–133.40) |
102.00 (92.95–118.90) |
122.10 (98.40–134.05) |
.324 |
| Serum C4 (mg/dL) | 25.58 (19.18–34.72) |
25.47 (21.98–31.01) |
25.36 (19.93–29.70) |
32.40 (23.25–42.92) |
.486 |
| Serum IgA (mg/dL) | 237.39 ± 76.72 |
280.87 ± 130.57 |
343.42 ± 141.06 |
312.89 ± 54.37 |
.050 |
| ESRD progression | 1 (5.6) | 1 (5.3) | 9 (31.0) | 5 (55.6) | .003 |
| CKD stage 4 progression | 1 (5.6) | 2 (10.5) | 9 (31.0) | 6 (66.7) | .002 |
| eGFR-25% occurrence | 0 | 2 (10.5) | 9 (31.0) | 5 (55.6) | .002 |
| Days before biopsy | 74 (31.75–296.5) | 55 (34–238) | 80 (29.5–278.5) | 59 (53–126.5) | .935 |
| Oxford classification | |||||
| M1 | 2 (11.1) | 3 (15.8) | 13 (44.8) | 3 (33.3) | .042 |
| E1 | 5 (27.8) | 8 (42.1) | 14 (48.3) | 3 (33.3) | .542 |
| S1 | 9 (50.0) | 12 (63.2) | 19 (65.5) | 8 (88.9) | .272 |
| T1 and T2 | 1 (5.6) | 1 (5.3) | 7 (24.1) | 2 (22.2) | .172 |
| C1 and C2 | 5 (27.8) | 11 (57.9) | 10 (34.5) | 3 (33.3) | .250 |
| Characteristic | KM55-high group (n = 38) | KM55-low group (n = 37) | p-value |
|---|---|---|---|
| Male sex | 13 (34.2) | 11 (29.7) | .866 |
| Age (yr) | 40.9 ± 14.7 | 36.3 ± 16.6 | .207 |
| Microscopic hematuria | 36 (94.7) | 34 (91.9) | .674 |
| UPCR (g/g Cr) | 1.73 (0.81–2.82) | 1.13 (0.61–1.79) | .048 |
| Serum creatinine (mg/dL) | 1.07 (0.81–1.31) | 0.84 (0.60–0.99) | .003 |
| Serum BUN (mg/dL) | 15.9 (11.7–19.3) | 12.9 (10.2–17.0) | .041 |
| Serum uric acid (mg/dL) | 5.86 ± 1.57 | 5.20 ± 1.65 | .083 |
| eGFR (mL/min/1.73 m2) | 76.11 ± 30.21 | 98.22 ± 38.08 | .007 |
| Serum albumin (g/dL) | 3.90 (3.68–4.30) | 4.20 (4.10–4.45) | .010 |
| SBP (mmHg) | 124.5 (120.0–130.3) | 120.0 (108.0–135.0) | .279 |
| DBP (mmHg) | 80.0 (70.8–85.3) | 75.0 (67.5–80.0) | .027 |
| Hemoglobin (g/dL) | 13.09 ± 1.90 | 13.05 ± 1.60 | .925 |
| White blood cell count (/μL) | 6,665 (5,383–8,948) | 7,010 (5,295–7,775) | .990 |
| Platelet count (×10³/μL) | 250.5 (213.8–291.0) | 272.0 (233.0–324.5) | .101 |
| Immunosuppressant usage | 19 (50.0) | 12 (32.4) | .190 |
| Serum C3 (mg/dL) | 103.85 (93.63–125.43) |
107.00 (97.05–125.63) |
.522 |
| Serum C4 (mg/dL) | 26.24 (20.93–35.50) |
25.47 (20.58–32.14) |
.677 |
| Serum IgA (mg/dL) | 334.55 ± 122.13 |
260.41 ± 109.29 |
.012 |
| ESRD progression | 14 (36.8) | 2 (5.4) | <.001 |
| CKD stage 4 progression | 15 (39.5) | 3 (8.1) | <.001 |
| eGFR-25% occurrence | 14 (36.8) | 2 (5.4) | <.001 |
| Days before biopsy | 62 (43.25-223.5) | 63 (34-251.5) | .937 |
| Oxford classification | |||
| M1 | 16 (42.1) | 5 (13.5) | .012 |
| E1 | 17 (44.7) | 13 (35.1) | .540 |
| S1 | 27 (71.1) | 21 (56.8) | .294 |
| T1 and T2 | 9 (23.7) | 2 (5.4) | .056 |
| C1 and C2 | 13 (34.2) | 16 (43.2) | .571 |
| Univariate analysis | Multivariate analysis | |||
|---|---|---|---|---|
| HR (95% CI) | p-value | HR (95% CI) | p-value | |
| ESRD progression | ||||
| KM55-high vs. KM55-low | 5.54 (1.26–24.45) | .024 | 3.23 (0.67–15.66) | .146 |
| M1 vs. M0 | 2.71 (0.89–8.22) | .079 | - | - |
| E1 vs. E0 | 2.46 (0.72–8.41) | .150 | - | - |
| S1 vs. S0 | 3.42 (0.77–15.19) | .105 | - | - |
| T1 vs. T0 | 7.04 (2.60–19.08) | <.001 | 4.73 (1.65–13.58) | .004 |
| C1, 2 vs. C0 | 1.09 (0.39–3.07) | .876 | - | - |
| CKD4 progression | ||||
| KM55-high vs. KM55-low | 4.71 (1.36–16.36) | .015 | 2.34 (0.55–9.91) | .249 |
| M1 vs. M0 | 3.11 (1.18–8.16) | .021 | 1.07 (0.27–4.27) | .920 |
| E1 vs. E0 | 3.25 (1.12–9.43) | .030 | 2.12 (0.52–8.61) | .291 |
| S1 vs. S0 | 2.88 (0.83–9.94) | .095 | - | - |
| T1 vs. T0 | 17.71 (6.09–51.53) | <.001 | 11.70 (3.55–38.58) | <.001 |
| C1, 2 vs. C0 | 1.47 (0.58–3.76) | .419 | - | - |
| eGFR-25% | ||||
| KM55-high vs. KM55-low | 6.15 (1.39–27.12) | .016 | 4.25 (0.91–19.83) | .066 |
| M1 vs. M0 | 2.84 (0.95–8.50) | .062 | - | - |
| E1 vs. E0 | 3.46 (0.90–13.34) | .071 | - | - |
| S1 vs. S0 | 3.68 (0.84–16.22) | .085 | - | - |
| T1 vs. T0 | 5.42 (2.00–14.65) | <.001 | 3.52 (1.25–9.90) | .017 |
| C1, 2 vs. C0 | 1.10 (0.40–3.02) | .849 | - | - |
| Characteristics | IgAN related to COVID-19 (n = 9) | IgAN unrelated to COVID-19 (n = 66) | p-value |
|---|---|---|---|
| Male sex | 2 (22.2) | 22 (33.3) | .710 |
| Age (yr) | 35.0 ± 16.5 | 39.1 ± 15.7 | .468 |
| Follow up period (day), median (min–max) | 452 (98–560) | 2,115.5 (245–4,580) | - |
| Microscopic hematuria | 9 (100) | 61 (92.4) | >.99 |
| UPCR (g/g Cr), median (IQR) | 1.13 (0.86–1.38) | 1.49 (0.69–2.65) | .405 |
| Serum creatinine (mg/dL), median (IQR) | 0.77 (0.58–0.99) | 0.97 (0.72–1.23) | .157 |
| Serum albumin (g/dL), median (IQR) | 4.30 (4.30–4.55) | 4.10 (3.70–4.30) | .003 |
| eGFR-CKD-EPI (mL/min/1.73 m2) | 101.8 ± 34.8 | 85.0 ± 35.8 | .190 |
| SBP (mmHg) | 122.3 ± 19.2 | 124.7 ± 13.2 | .643 |
| DBP (mmHg) | 74.0 ± 8.0 | 77.5 ± 10.7 | .352 |
| Uric acid (mg/dL) | 5.60 ± 1.47 | 5.52 ± 1.67 | .895 |
| BUN (mg/dL), median (IQR) | 12.6 (8.2–15.7) | 14.9 (11.2–18.7) | .108 |
| ESRD progression | 0 | 16 (24.2) | <.001 |
| CKD stage 4 progression | 0 | 18 (27.3) | <.001 |
| eGFR-25% occurrence | 0 | 16 (24.2) | <.001 |
| Days before biopsy, median (IQR) | 63 (45–118) | 62 (33.75–250.75) | .813 |
| Haas classification (I, II, III, IV, V) | 0, 1, 7, 1, 0 | 2, 6, 35, 17, 6 | .672 |
| Oxford classification | |||
| M (M0, M1) | 9, 0 | 45, 21 | .054 |
| E (E0, E1) | 2, 7 | 43, 23 | .018 |
| S (S0, S1) | 2, 7 | 25, 41 | .475 |
| T (T0, T1, T2) | 9, 0, 0 | 55, 11, 0 | .340 |
| C (C0, C1, C2) | 5, 4, 0 | 41, 23, 2 | .485 |
| IF intensity of IgA (1+, 2+, 3+) | 0, 4, 5 | 5, 26, 35 | .893 |
| KM55 score, median (IQR) | 1 (1–2.5) | 3 (2–3) | .022 |
Values are presented as number (%), mean ± SD, or median (IQR). IgAN, IgA nephropathy; RBC, red blood cell; HPF, high-power field; UPCR, urine protein/creatinine ratio; eGFR, estimated glomerular filtration rate; WBC, white blood cell; EDD, electron-dense deposit; IF, immunofluorescence; SD, standard deviation; IQR, interquartile range. Case without identifiable glomeruli in electron microscopy is excluded.
IgAN, IgA nephropathy. Mann-Whitney U test for MEST-C score, Kruskal-Wallis test for Haas classification score.
Values are presented as number (%), mean ± SD, or median (IQR). IgAN, IgA nephropathy; UPCR, urine protein/creatinine ratio; BUN, blood urea nitrogen; eGFR, estimated glomerular filtration rate; ESRD, end-stage renal disease; CKD, chronic kidney disease; eGFR-25%, ≥75% reduction from baseline eGFR; SD, standard deviation; IQR, interquartile range. 18 cases included; 18 cases included; 25 cases included; 9 cases included; 16 cases included; 18 cases included; 22 cases included; 9 cases included.
Values are presented as number (%), mean ± SD, or median (IQR). IgAN, IgA nephropathy; UPCR, urine protein/creatinine ratio; BUN, blood urea nitrogen; eGFR, estimated glomerular filtration rate; SBP, systolic blood pressure; DBP, diastolic blood pressure; ESRD, end-stage renal disease; CKD, chronic kidney disease; eGFR-25%, ≥75% reduction from baseline eGFR; SD, standard deviation; IQR, interquartile range. 34 cases included; 36 cases included; 31 cases included; 34 cases included.
ESRD, end-stage renal disease; CKD4, chronic kidney disease stage 4; eGFR-25%, ≥75% reduction from baseline eGFR; HR, hazard ratio; CI, confidential interval; eGFR, estimated glomerular filtration rate.
Values are presented as number (%) or mean ± SD unless otherwise indicated. IgAN, IgA nephropathy; COVID-19, coronavirus disease 2019; UPCR, urine protein/creatinine ratio; IQR, interquartile range; eGFR; estimated glomerular filtration rate; CKD-EPI, chronic kidney disease Epidemiology Collaboration; SBP, systolic blood pressure; DBP, diastolic blood pressure; BUN, blood urea nitrogen; ESRD, end-stage renal disease; CKD, chronic kidney disease; eGFR-25%, ≥75% reduction from baseline eGFR; IF, immunofluorescence; SD, standard deviation.

