 E-submission
Articles
- Page Path
- HOME > J Pathol Transl Med > Volume 60(1); 2026 > Article
-
Original Article
Correlations and prognostic impacts of tumor spread through airspaces in surgically resected non–small cell lung cancer: a retrospective study from Jordan -
Ola Abu Al Karsaneh1
 , Amani Al-Rousan2, Sofian Al Shboul3, Mohammed El-Sadoni2, Anas Hayajneh4, Moath Alrjoub4, Sura Al-Rawabdeh2, Tareq Saleh3,5
 -
Journal of Pathology and Translational Medicine 2026;60(1):92-106.
DOI: https://doi.org/10.4132/jptm.2025.10.15
Published online: January 9, 2026
1Department of Microbiology, Pathology and Forensic Medicine, Faculty of Medicine, The Hashemite University, Zarqa, Jordan
2Princess Iman Center for Research and Laboratory Sciences, King Hussein Medical Center, Royal Medical Services, Amman, Jordan
3Department of Pharmacology and Public Health, Faculty of Medicine, The Hashemite University, Zarqa, Jordan
4Department of Pathology and Microbiology, Faculty of Medicine, Jordan University of Science and Technology, Irbid, Jordan
5Department of Pharmacology & Therapeutics, College of Medicine & Health Sciences, Arabian Gulf University, Manama, Bahrain
- Corresponding Author: Ola Abu Al Karsaneh, MD Department of Microbiology, Pathology and Forensic Medicine, Faculty of Medicine, The Hashemite University, Zarqa 13133, Jordan Tel: +962-062-5-390-3333 (5577), Fax: +962-5-3903352, E-mail: olaa@hu.edu.jo
© The Korean Society of Pathologists/The Korean Society for Cytopathology
This is an Open Access article distributed under the terms of the Creative Commons Attribution Non-Commercial License (https://creativecommons.org/licenses/by-nc/4.0) which permits unrestricted non-commercial use, distribution, and reproduction in any medium, provided the original work is properly cited.
- 4,025 Views
- 162 Download
Abstract
-
Background
- Spread through air spaces (STAS) has been identified as an invasion pattern in non–small cell lung cancer (NSCLC). This study evaluated the association between tumor STAS and various clinicopathological parameters of NSCLC, with emphasis on the prognostic role of STAS.
-
Methods
- We evaluated 96 cases of NSCLC for STAS. STAS-positive cases were graded according to the distance between the edge of the primary tumor and the furthest STAS, in millimeters, or the number of alveoli separating STAS from the tumor.
-
Results
- STAS was observed in 33 patients (34.4%). In 28 cases, STAS was located in airspaces >3 alveoli away from the primary tumor. In 18 cases, STAS was found in airspaces > 2.5 mm away from the edge of the primary tumor. Morphologically, 18 cases of STAS demonstrated a solid nest pattern, eight showed a micropapillary cluster pattern, and seven exhibited a single-cell pattern. In multivariate analysis, only high tumor grade (p = .001) was independently associated with STAS in NSCLC. The presence of STAS (p = .047), lymphovascular invasion (p = .001), positive surgical margin (p = .021), adenocarcinoma histology (p = .020), and postoperative therapy (p = .049) showed a statistically significant lower overall survival (OS). However, multivariate analyses showed that STAS is not an independent predictor of OS in NSCLC. In addition, STAS-positive cases with an extension of >2.5 mm had significantly lower disease-free survival (DFS) (p = .018).
-
Conclusions
- The findings demonstrated that STAS is independently associated with a higher tumor grade and appears to have an adverse impact on OS and DFS in the examined subpopulation.
- Lung cancer remains a primary cause of cancer-related mortality worldwide, despite the reported decline in cancer mortality rates, significantly driven by lung cancer due to early detection and advances in treatment [1]. Non–small cell lung cancer (NSCLC) accounts for about 85% of lung cancer cases. In Jordan, lung cancer is the third most common cancer in both sexes and the most common cause of cancer-related mortality in males [2].
- Metastasis and invasion are the major prognostic factors in cancer patients. Invasive mechanisms in lung cancer include non-lepidic histological patterns and stromal, vascular, lymphatic, and pleural invasions. Shiono et al. [3] suggested that the presence of 10 or more floating clusters of cancer cells in the airspaces surrounding main tumors in cases of pulmonary metastasis from colorectal cancer was significantly related to local recurrence in these patients. Subsequently, Onozato et al. [4] reported the presence of tumor islands outside the borders of the primary tumors in cases of primary lung adenocarcinoma (ADC); these islands were located at least a few alveoli away from the main tumor. Moreover, cases associated with these tumor islands carried a significantly worse prognosis and a higher risk of recurrence compared to those without these tumor islands. In 2015, the concept of spread through air spaces (STAS) was considered by the World Health Organization (WHO) as a mechanism of invasion in lung ADC [5] based on a validation of the concept in two large studies [6,7].
- STAS is defined as the spread of single cells, solid nests, or micropapillary clusters of cancer cells into air spaces in the lung parenchyma beyond the edge of the primary tumor. The presence of STAS diagnoses lepidic ADC and excludes a diagnosis of adenocarcinoma in situ (AIS) or minimally invasive adenocarcinoma (MIA) in small tumors [5]. Although most of the studies investigated the characteristics of STAS in conventional lung ADC, it has also been described in other primary lung tumors, including invasive mucinous ADC [8], squamous cell carcinoma (SqCC) [9], and neuroendocrine tumors [10]. The reported incidence of STAS in lung cancer ranges between 15% and 73%, according to different studies and depending on the different stages of the involved tumors [11-17]. Some studies found that the presence of STAS was associated with higher tumor grade, higher tumor stage, lymph node metastasis, high-grade architectural patterns (micropapillary and solid growth patterns), absence of lepidic component, pleural invasion, and lymphovascular and perineural invasion [12-14,16]. More importantly, several reports indicated that STAS is associated with shorter overall survival (OS) and recurrence-free survival (RFS) in patients with lung ADC treated with surgery, suggesting its potential role as a significant risk factor for recurrence [11,18-26]. Different attempts have been made to score STAS according to the number of floating tumor clusters [27] or the distance from the edge of the primary tumor [7,14,28]; however, no consensus has been reached.
- Lobectomy has been considered the primary surgical procedure for early-stage lung cancer. However, depending on the overall conditions of the patient, sub-lobar resections, including wedge resection and segmentectomy, are considered an acceptable alternative [29,30]. Although there is no consensus on whether these limited resections increase the risk of regional recurrence compared to lobectomy in patients with STAS, some studies reported that sub-lobar resection was associated with a higher recurrence risk in patients with early-stage lung cancer who have STAS [22,31,32]. Considering this reported adverse effect, it appears that STAS-positive patients who receive sublobar resection may benefit from a completion lobectomy or adjuvant therapy to lower the chance of recurrence. However, an undocumented observation in Jordanian hospitals indicated that a majority of surgeons and pathologists do not consider the prognostic effect of STAS. Hence, this study aimed to assess the incidence of STAS in NSCLC, its correlation with various clinicopathological variables, and its prognostic value in a subpopulation of Jordanian patients. This may help in the prognostic stratification of the patients and the determination of the need for any further treatment.
INTRODUCTION
- Study setting and patients' sample
- In this work, we retrospectively collected the data and tissue samples of the patients who underwent surgical resection of their primary lung cancer at Jordan Royal Medical Services (JRMS) and King Abdullah University Hospital (KAUH) between 2005 and 2024. The inclusion criteria included patients with a primary lung cancer diagnosis of any stage and any histological subtype who underwent wedge resection, segmentectomy, lobectomy, or pneumonectomy. The exclusion criteria included the following: (1) postoperative diagnosis of AIS or MIA; (2) the utilization of preoperative neoadjuvant therapy; (3) patients with multiple primary lung tumors; (4) lack of tumor slides or tissue for review; and (5) incomplete clinical and follow-up data. After applying these criteria, 96 cases (63 from JRMS and 33 from KAUH) were enrolled. The patients' relevant clinicopathological parameters, including age, sex, smoking history, tumor location, surgical procedure, histological subtypes, margin status, pathological stage, and follow-up data, were obtained from the patients' original medical records and pathological reports.
- The surgically resected lung cancer specimens were fixed using the conventional fixation method, where the specimens were immersed and fixed in 10% neutral-buffered formalin within 5 minutes of the resection. Formalin was injected into the bronchi or through the pleura until the lung was dilated, allowing the formalin to permeate the specimen. The fixation duration ranged from 18 to 48 hours. Paraffin-embedded 4-µm sections, hematoxylin and eosin (H&E)–stained slides of all cases were thoroughly reviewed by two pathologists to confirm the histological features and assess other features not included in the pathology report (O.A.A.K. and A.A.R.). Tumor subtypes were determined according to the WHO guidelines [5,33]. Grading of the ADC cases was determined based on the combination of the predominant and the worst architectural patterns [33,34]. Briefly, tumors predominantly having a lepidic architecture with less than 20% of high-grade patterns (solid, micropapillary, cribriform, or complex glands) were classified as well differentiated ADC (grade 1); tumors predominantly having acinar and papillary patterns with less than 20% of high-grade patterns were classified as moderately differentiated ADC (grade 2), and any ADC with more than 20% of high-grade patterns was categorized as poorly differentiated (grade 3). SqCC cases were graded as well differentiated (grade 1), moderately differentiated (grade 2), or poorly differentiated (grade 3), based on the degree of tumor keratinization, histological, and cytomorphological features. For the purposes of disease-free survival (DFS) analysis only, tumor grades were categorized into two groups: low-grade tumors (including grades 1 and 2) and high-grade tumors (grade 3), due to the limited number of patients who experienced recurrence or progression of their disease. Depending on the time of diagnosis, the stages were determined according to the seventh and eighth editions of the American Joint Committee on Cancer (AJCC) TNM classification system [35,36]. Positive pleural invasion was defined as tumor invasion beyond the elastic lamina of the pleura.
- Histopathological evaluation of STAS
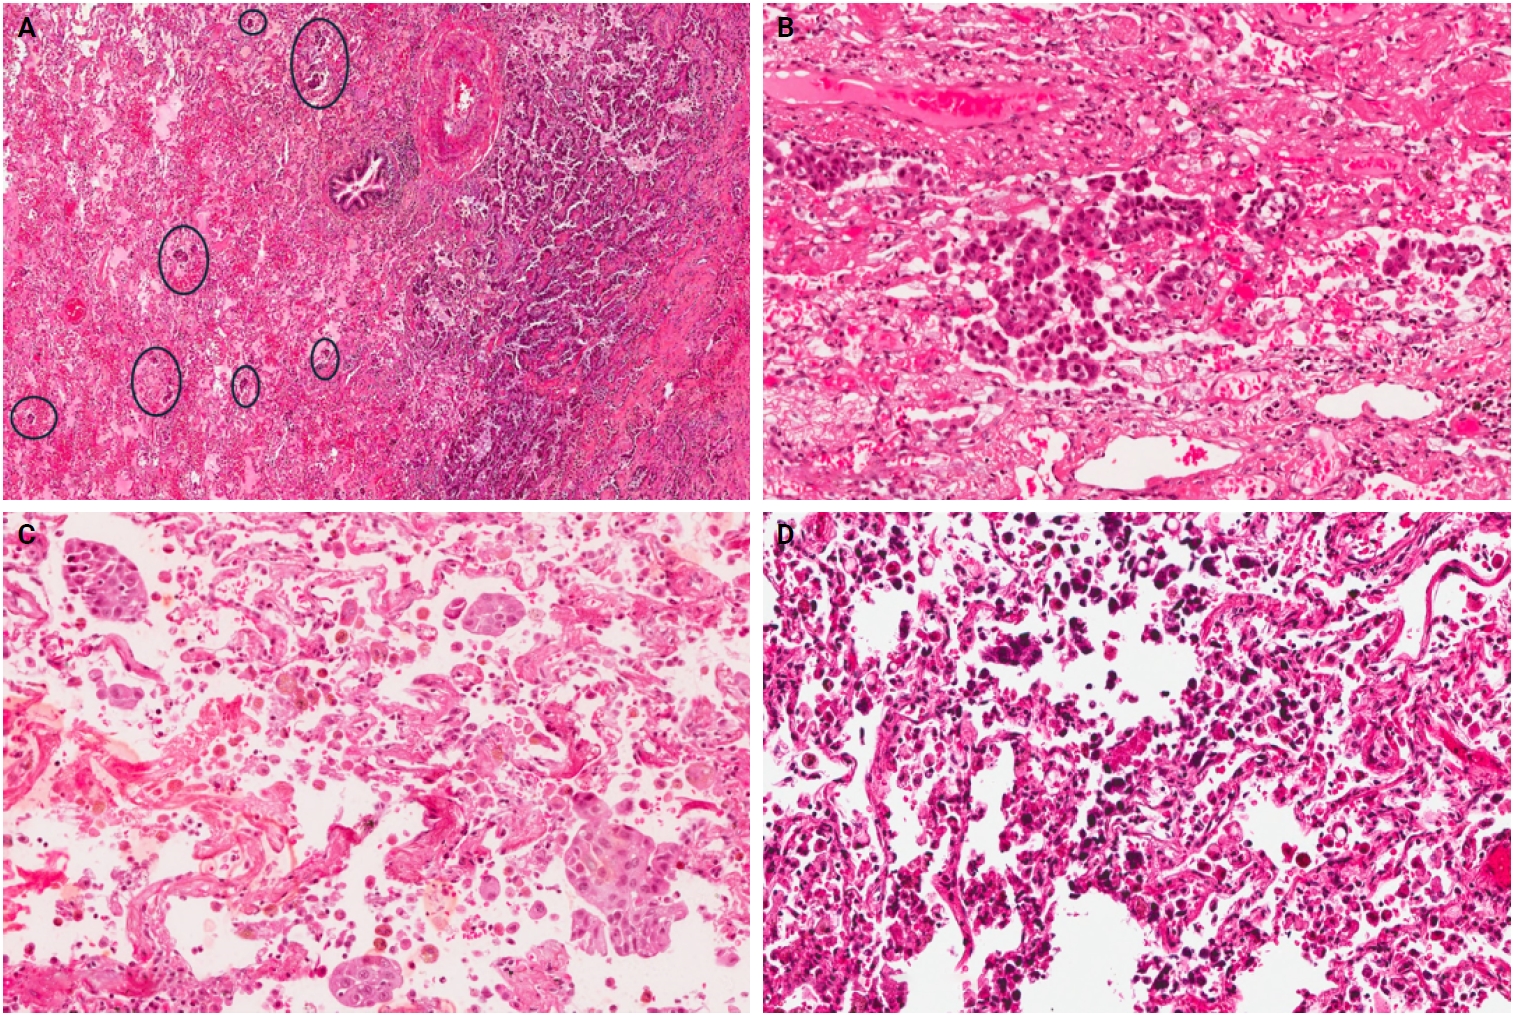
- The H&E-stained tumor sections were independently examined by two expert pathologists (O.A.A.K. and A.A.R.), who were unaware of the clinical data, and a consensus was reached in cases of disagreement. STAS was defined as the presence of tumor cells within the air spaces beyond the edge of the primary tumor, as previously documented in the literature [37,38]. The edge of the primary tumor was defined as the outer border of the tumor, which is clearly appreciated during low-power histological examination. To reliably assess the presence of STAS, all selected cases had a circumferential rim of normal lung tissue surrounding the edge of the tumor in at least one slide. Certain considerations were taken to avoid confusion with artificially detached tumor cells that result from section processing. Tumor cells were considered STAS if they were present continuously in the air spaces from the tumor edge, and individual isolated tumor cells or rare tumor clusters found far away from the tumor without spreading continuously were considered artifacts. Additionally, random tumor clusters scattered across the tissue surface or located at the edge of the tissue section, along with clusters exhibiting jagged edges due to fragmentation or knife cuts during processing, were also classified as artifacts. Linear strips of tumor cells that appeared lifted from the alveolar wall or stroma due to poor preservation, as well as benign-looking ciliated bronchial cells or pneumocytes, and tumor cell clusters mixed with ciliated cell strips were similarly considered artifacts [6,10,14,28]. Furthermore, tumor cells were distinguished from alveolar macrophages based on their morphological features, where tumor cells exhibited nuclear atypia characterized by a high nuclear-to-cytoplasmic ratio, hyperchromasia, and frequent nucleoli. In contrast, macrophages do not show atypical features; they have small, uniform nuclei with inconspicuous or absent nucleoli and foamy cytoplasm in nonsmokers or cytoplasmic brown to black pigments in smokers [28].
- Three morphological patterns of STAS were appreciated: (1) single cell pattern composed of discohesive single tumor cells within the alveoli, (2) solid nest pattern, where clusters of tumor cells present in the air spaces, and (3) micropapillary cluster pattern, defined as papillary structures without fibrovascular cores. Initially, the cases were divided into two groups: STAS-positive and STAS-negative. After that, due to a lack of consensus on a grading method, STAS-positive cases were reclassified in various ways to assess the prognostic value of STAS extension. In the first method, the extension of STAS was assessed by measuring the distance between the edge of the primary tumor and the furthest intraalveolar tumor cell clusters in millimeters (mm). Then, the cases were divided into two groups: group I, where all tumor clusters were present ≤2.5 mm away from the tumor, and group II, where any tumor clusters were present >2.5 mm away from the main tumor [14]. In the second approach, the number of alveoli between the edge of the primary tumor and STAS was counted, and cases were categorized into two groups: those with limited spread when ≤3 alveolar spaces separated STAS from the primary tumor, and those with extensive spread when >3 alveoli separated STAS from the primary tumor [7].
- Statistical analysis
- All statistical analyses were performed using IBM SPSS Statistics ver. 25 (IBM Corp., Armon, NY, USA). OS was determined from the time of surgery to the time of death or the last follow-up visit. DFS was measured from the time of surgery to the time of disease recurrence or progression. OS and DFS were calculated using the Kaplan-Meier method with the log-rank test. Multivariate analysis was conducted using a Cox proportional hazards regression model to identify independent prognostic factors associated with OS. Categorical variables were analyzed using the chi-square test or Fisher’s exact test, as appropriate. The association between clinicopathological variables and the presence of STAS was assessed using multivariate logistic regression, with results reported as odds ratios (OR) and 95% confidence intervals (CI). A p-value < .05 was considered statistically significant.
MATERIALS AND METHODS
- Basic characteristics of patients
- The baseline demographic and clinicopathological characteristics of NSCLC patients are summarized in Table 1, categorized by STAS status. A total of 96 patients were included in the study (n = 96). Most patients were males (n = 70, 72.9%), with a median age of 63 years (range, 26 to 80 years). Sixty-one patients (63.5%) were current or former smokers. Most tumors (n = 60, 62.5%) were on the right side, and the right upper lobe was the most common location. Fifty-four patients (56.3%) underwent lobectomy, while the remainder had sublobar resection. A total of 18 patients (18.8%) had positive bronchial or parenchymal margins. Histologically, 61 patients (63.5%) had ADC, 17 patients (17.7%) had SqCC, and 18 patients (18.8%) had other lung cancer subtypes. Regarding the histological grade, 16.7% (n = 16) of the patients had grade 1 tumors, while 47.9% (n = 46) and 35.4% (n = 34) had grades 2 and 3 tumors, respectively. Just more than half of the patients had pathological stage I or II (n = 51, 53.1%). The majority of patients (n = 58, 60.4%) had a tumor size of 3 cm or less, and a minority of cases had confirmed lymph node metastasis (24%). Visceral pleural invasion was present in 24% of the cases, lymphovascular invasion (LVI) was identified in 31.3%, and necrosis was found in 34.4% of the cases. The most frequent histological growth pattern in ADC cases was the acinar pattern (n = 34, 55.7%), followed by the solid pattern (n = 10, 16.4%), while the least frequent one was the micropapillary growth pattern (n = 3, 4.9%). Only 39.6% of the patients received postoperative chemo/radiation therapy.
- STAS presence and association with the clinicopathological variables in NSCLC
- Among the 96 NSCLC samples, STAS was identified in 33 patients (34.4%). Of these, twenty-eight cases showed extensive STAS, with tumor cells presenting in airspaces more than three alveoli away from the primary tumor. In 18 cases, STAS was found in airspaces more than 2.5 mm away from the edge of the primary tumor. Morphologically, eighteen cases of STAS demonstrated a solid nest pattern, eight demonstrated a micropapillary cluster pattern, and seven showed a single-cell pattern. Representative images of STAS with different morphological patterns are shown in Fig. 1A–D.
- The presence of STAS was more frequently observed in ADC cases (44.3% vs. 17.7% in SqCC vs. 16.7% in other subtypes) and in patients with a history of smoking (39.3% vs. 25.7% in never-smokers). Moreover, STAS occurrence was more frequent in patients with grade 3 tumors (61.8% vs. 23.9% and 6.3% in grades 2 and 1 tumors, respectively), in patients with stage III or IV, in patients with positive LVI, positive visceral pleural invasion, and in tumor cases with necrosis. ADC cases with predominant solid or micropapillary growth patterns showed the highest frequency of STAS. Interestingly, STAS was slightly more frequent in sublobar resections (wedge resection or segmentectomy) than in lobectomy cases (38.1% vs. 31.4%). Among the clinicopathological variables, ADC histological subtype (p = .031), grade 3 tumors (p < .001), and presence of LVI (p = .030) were significantly associated with the presence of STAS; however, no significant association was found with the other parameters in the univariate analysis (Table 1).
- Furthermore, we performed multivariate logistic regression analysis on variables that showed a statistically significant association (p < .05) with STAS presence in the univariate analyses. Only tumor grade remained significantly associated with STAS. Specifically, with grade 1 as a reference, patients with grade 3 tumors had higher odds of having STAS (OR, 3.994; 95% CI, 0.434 to 36.709; p = .002). In comparison, histological subtype (using ADC as a reference) and LVI (with absent LVI as a reference) were not independently associated with STAS (Table 2).
- Survival analyses of STAS and other clinicopathological variables
- The mean OS for the patients was 26 months (range, 0 to 191 months), and the mean DFS was 28 months (range, 0 to 86 months). During the follow-up period, 16 patients (16.7%) experienced recurrence, comprising six with locoregional recurrence, nine with distant metastatic recurrence, and one with both. In NSCLC patients, Kaplan-Meier analysis with a log-rank test demonstrated a statistically significant lower OS with the presence of STAS (p = .047), with the mean OS dropping from 141 months in patients without STAS to 65.4 months in patients with STAS (Fig. 2A). No statistically significant difference in OS was identified among different subgroups of STAS-positive cases, either according to morphology or the distance of extension. Further, positive surgical margin, LVI, ADC tumor histology, and postoperative therapy showed statistically significant associations with lower OS (p = .021, p = .001, p = .020, and p = .049, respectively) (Fig. 2B–E).
- In NSCLC patients, the mean DFS rate was slightly lower in patients with STAS than in those without STAS. However, no statistically significant difference was identified (p = .681). Nonetheless, STAS-positive cases with an extension of ≤2.5 mm showed statistically significant (p = .018) higher DFS compared to those with an extension of >2.5 mm (Fig. 2F); however, no statistically significant difference in DFS was identified using three alveoli as a cutoff point for STAS extension (p = .953) (Fig. 2G). Moreover, patients with high-grade tumors and those who underwent sublobar resection had a statistically significant lower DFS (p = .044 and p = .032, respectively) (Fig. 2H, I). Of note, these findings could not be further evaluated in a multivariate analysis due to the limited number of cases that experienced disease recurrence or progression.
- When we stratified NSCLC cases by different subgroups of clinicopathological parameters and investigated the impact of STAS on OS, we found a statistically significant negative impact of STAS on OS in subgroups with tumor size ≤3 cm, negative visceral pleural invasion, and pT1 tumor stage (Fig. 3A–C). Regarding the surgical procedure, patients who underwent sublobar resection had lower mean OS and DFS, regardless of whether they had STAS or not, and no significant difference was identified.
- In the subsequent step, we examined the impact of STAS and other clinicopathological variables on OS within the cohort of ADC cases (n = 61). Kaplan-Meier curves with a log-rank test revealed no statistically significant difference in OS between STAS-positive and STAS-negative tumors (p > .30). Similarly, neither the morphological subtype of STAS nor its distance of extension (≤2.5 mm vs. >2.5 mm or ≤3 alveoli vs. >3 alveoli) influenced the OS. In contrast, patients whose tumors exhibited LVI experienced markedly poorer OS (p = .033) (Supplementary Fig. S1) and showed a steeper early mortality slope. Other factors, including tumor grade, pathological stage, and additional clinicopathological variables, did not convincingly stratify survival in ADC cases. Due to the limited number of cases that had disease recurrence or progression in the ADC cohort, no analysis on DFS was performed. Additionally, for SqCC, the cohort size was small (n = 17), and only two deaths occurred during the follow-up period, which rendered the Kaplan-Meier and Cox proportional hazards regression model analyses unreliable.
- Prognostic value of clinicopathological variables for OS in NSCLC patients
- We performed Cox proportional hazards regression analyses to evaluate the prognostic significance of the clinicopathological variables and to identify potential independent predictors of OS. Univariate analysis identified several clinicopathological variables significantly associated with OS. For example, histological subtype was significantly associated with OS (p = .049); patients with other histological subtypes of lung cancer had a significantly lower hazard of death compared to ADC (HR, 0.127; 95% CI, 0.017 to 0.953; p = .045). However, the survival difference between SqCC and ADC was not statistically significant (HR, 0.316; 95% CI, 0.074 to 1.354; p = .121). Additionally, the presence of LVI (HR, 3.743; 95% CI, 1.613 to 8.684; p = .002) and positive margin status (HR, 2.644; 95% CI, 1.119 to 6.251; p = .027) significantly increased the risk of death. Other variables tested in the univariate analysis were not significantly associated with OS (p > .05). Moreover, variables significantly associated with OS in univariate analysis were included in the multivariate Cox regression model. In this analysis, only LVI (HR, 3.143; 95% CI, 1.347 to 7.338; p = .008) and positive margin status (HR, 2.448; 95% CI, 1.033 to 5.801; p = .042) remained significant independent predictors of poorer OS, while the histological subtype was not independently predictive of OS after adjustment for other variables (p = .087) (Table 3).
- Prognostic value of clinicopathological variables for OS in ADC patients
- Finally, we conducted a Cox proportional hazards regression model to further evaluate the prognostic impact of clinicopathological variables, including STAS, for the ADC cohort but not for SqCC due to an insufficient number of cases and events. In the univariate analysis, LVI was identified as the only significant prognostic factor for OS (HR, 2.559; 95% CI, 1.041 to 6.288; p = .041). Margin positivity showed a strong but non-significant trend towards increased mortality (HR, 2.19; p = .097). In contrast, STAS status—along with its extent, morphological subtypes, tumor grade, tumor stage, smoking history, and other variables—did not show an independent association with mortality (e.g., STAS; HR, 1.474; p = .395) (Table 4). Because only one variable (LVI) reached a statistical significance in the univariate analysis, we did not construct a multivariate model for the ADC cohort.
RESULTS
- This study found that STAS is significantly associated with high histological tumor grade of lung cancer, where high tumor grade (grade 3) serves as an independent predictor for STAS. STAS presence, positive surgical margin, LVI, ADC histology, and postoperative therapy were associated with statistically significant lower OS in NSCLC cases. However, based on multivariate analysis, only positive surgical margin and LVI were identified as independent predictors of poorer OS. Furthermore, STAS was associated with a statistically significant lower OS in patients with a tumor size of ≤3 cm, pT1 tumor stage, and negative pleural invasion.
- In the ADC cohort, only LVI showed a statistically significant lower OS in a univariate analysis, which prevented conducting a multivariate analysis. Although the mean DFS rate was slightly lower in patients with STAS than in those without STAS, no statistically significant difference was identified in NSCLC cases. However, an extension of STAS > 2.5 mm away from the edge of the primary tumor, high tumor grade, and sublobar resection were found to be significantly associated with a lower DFS in a univariate analysis.
- The incidence of STAS found in this study was 34.4% across the different histological subtypes, which falls within the range reported by other studies [10,12,13,16,39-42]. The solid nest pattern was the most frequently observed (54.5%). STAS was slightly more frequent in sublobar resections than in lobectomy specimens. Interestingly, a completion lobectomy may potentially be beneficial for these patients with STAS-positive tumors, reducing the risk of tumor recurrence or progression [43]. In this study, we found that ADC histology, high histological tumor grade, and the presence of LVI were associated with STAS in the univariate analysis. Further, the multivariate analysis proved that high tumor grade is an independent predictor of STAS. Several studies analyzed the correlation between STAS and other clinicopathological parameters. Consistent with our findings, some studies found an association between STAS and high tumor grade/poor differentiation [4,39,40,44,45] or LVI [11,27,40,46]. For example, Lee et al. [40] investigated STAS in 316 cases of lung ADC and found that STAS was significantly associated with high-grade histology, LVI, higher stage, and lymph node metastasis. Uruga et al. [27] studied 208 cases of early-stage lung ADC and found a significant association between higher STAS and LVI, solid predominant ADC, visceral pleural invasion, and tumor size ≥ 10 mm. Other studies also reported a significant association between STAS and different parameters, including micropapillary growth pattern, nodal involvement, higher stage, perineural invasion, and pleural invasion; however, none of these variables were associated with STAS in our work [12,16,31,39,40,47]. It is possible that we were not able to identify a statistically significant association between STAS and these variables due to the small sample size.
- The association of STAS with poor OS and DFS has been extensively suggested. A meta-analysis involving 3754 patients demonstrated a significant association between STAS and worse RFS and OS in NSCLC [26]. Another meta-analysis, including 47 studies, also concluded that STAS presence is associated with poor prognosis [48]. A study by Chen et al. [23] reported that STAS is significantly associated with lower OS and RFS in stage IB NSCLC. Another study included STAS among the pathological features that adversely affect the OS and progression-free survival (PFS) in stage I lung ADC [49]. Another interesting study reported that STAS presence negatively impacts OS and RFS in stage IB patients. Furthermore, it observed that adjuvant chemotherapy improves RFS outcomes in stage IB STAS-positive patients with high-risk recurrence factors, such as LVI, pleural invasion, and poor differentiation [50]. Moreover, other studies included lung cancer cases of stages I–IV and reported the same adverse effect of STAS on survival [6,7,16,19,21,40,51-54]. On the other hand, a recent study did not find an association between STAS and worse survival or higher recurrence rates; however, they attributed this to a limited follow-up duration [55].
- Herein, we included NSCLC cases of stages I–IV and found a significant association between STAS and lower OS but not DFS in a univariate analysis. However, based on our multivariate analysis, STAS was not an independent predictor of prognosis, which is likely due to the small sample size. Furthermore, STAS did not reveal an independent prognostic impact on OS in univariate analysis in the ADC cohort. In line with previous results, we found that STAS presence has a negative impact on OS in subgroups of early-stage lung cancer, defined as tumor stage pT1, tumor size ≤ 3 cm, and negative visceral pleural invasion.
- Due to a lack of consensus on measuring the extension of STAS in lung cancer, in this study, we measured the distance between STAS and primary tumor in mm using a cut-off value of 2.5 mm and according to the number of alveoli using a cut-off value of 3 alveoli. In both grading methods, no significant association was found between STAS extension and OS, either in the entire patient cohort or the ADC cohort; however, STAS extension of >2.5 mm from the edge of the primary tumor was significantly associated with lower DFS in the NSCLC cohort. However, this finding could not be further assessed in a multivariate analysis due to the small number of cases showing disease recurrence or progression. Few studies have assessed the prognostic significance of STAS distance using different methodologies to define STAS distance. Han et al. [14] measured the distance between the edge of the primary tumor and the furthest STAS in mm and observed that STAS II, defined as STAS ≥ 2.5 mm away from the edge of the primary tumor, is an independent poor prognostic factor for recurrence in stage I lung ADC, regardless of the extent of resection. Hashinokuchi et al. [53] categorized cases of STAS as limited (≤1 mm) and extended (>1 mm) based on the median maximum spread distance between the edge of the primary tumor and the furthest STAS and demonstrated that extended STAS was an independent prognostic factor for OS and RFS. On the other hand, Yanagawa et al. [9] used a cutoff value of 0.8 mm between the edge of the primary tumor and the furthest STAS and found no difference in OS or RFS between near STAS (<0.8 mm) and far STAS (>0.8 mm).
- Similar to the results of this study, Warth et al. [7], Lu et al. [42], Kadota et al. [28], and Dai et al. [41] defined STAS distance as the number of alveoli between the edge of the main tumor and the furthest STAS, and using a cutoff point of 3 alveoli between limited STAS (< 3 alveoli) and extensive STAS (>3 alveoli), they reported no significant prognostic impact of STAS distance in NSCLC. Taken together, these results suggest that the prognostic significance of STAS distance depends on the methodology used and how the cutoff value was determined. Therefore, further research is warranted to explore STAS's biological perspectives, establish a method to measure STAS distance, and determine the clinically significant cutoff value.
- Emphasizing the significance of STAS, a large staging study of lung cancer conducted by the International Association for the Study of Lung Cancer (IASLC) supported the recommendation to include STAS as a histological descriptor for the Ninth Edition of the TNM Classification of Lung Cancer [56]. Additionally, the IASLC aims to gather more information in the coming years to assess the relative importance of STAS in comparison to LVI and visceral pleural invasion in the staging of lung cancer, which will aid in the development of the 10th edition of the TNM stage classification.
- While our study's strength includes using different classifications of STAS and being the first study to investigate STAS in lung cancer among Jordanian patients, it has several potential limitations. First, this is a retrospective study, which may introduce some selection bias, and some data were missing, which could have negatively affected the results and sample size. Second, the small sample size may have influenced the results, and furthermore, it hindered the proper stratification and analysis of the data based on histological subtypes or different stages, which may have introduced biases in the results, given the different prognoses associated with different tumor histological subtypes or other parameters. Third, formalin fixation may have affected STAS distance. Finally, due to the small number of patients who experienced disease recurrence, no further DFS analysis was performed.
- In conclusion, our data indicated that a high histological grade is an independent predictor of STAS in lung cancer. Additionally, the results suggested that STAS may have a negative impact on prognosis. However, it is essential to consider that STAS may be merely a characteristic of high-grade tumors rather than a significant, independent prognostic indicator. Therefore, additional extensive multicenter and prospective studies are necessary to clarify the prognostic role of STAS in lung cancer and to establish a clinically significant cutoff value for STAS distance. This may help clinicians in the prognostic stratification of patients and inform decisions regarding further treatment.
DISCUSSION
Supplementary Information
Ethics Statement
This study received approval from the Institutional Review Boards at the Hashemite University (Protocol No.5/1/2023/2024 on 19 November, 2023) and JRMS (Protocol No. 5/2024 on 2 April, 2024). All procedures followed the 1964 Helsinki Declaration and its relevant amendments. Because the study was retrospective and no patient identifications were used, the Institutional Review Board committees waived the need for formally written informed consent.
Availability of Data and Material
The data used and analyzed during the current study are available from the corresponding author upon reasonable request.
Code Availability
Not applicable.
Author Contributions
Conceptualization: OAAK. Data curation: OAAK. Formal analysis: SAS. Investigation: OAAK, AAR, MES, MA, AH, SAR. Funding acquisition: OAAK. Methodology: OAAK, AAR. Project administration: OAAK. Resources: OAAK. Software: SAS. Supervision: OAAK. Validation: OAAK, TS. Visualization: OAAK, TS. Writing—original draft: OAAK. Writing—review & editing: OAAK, TS. Approval of final manuscript: all authors.
Conflicts of Interest
The authors declare that they have no potential conflicts of interest.
Funding Statement
The Deanship of Scientific Research, Hashemite University, Zarqa, Jordan, supported Dr. Ola Abu Al Karsaneh for this work (OAAK: grant no. 746/57/2022).
Acknowledgments
All authors would like to thank the Department of Pathology at King Abdullah University Hospital for granting access to their slide scanner.


- 1. Siegel RL, Miller KD, Fuchs HE, Jemal A. Cancer statistics, 2022. CA Cancer J Clin 2022; 72: 7-33. ArticlePubMedPDF
- 2. Jordan Cancer Registry. Cancer incidence in Jordan-2022. Amman: Ministry of Health, Jordan, 2022.
- 3. Shiono S, Ishii G, Nagai K, et al. Predictive factors for local recurrence of resected colorectal lung metastases. Ann Thorac Surg 2005; 80: 1040-5. ArticlePubMed
- 4. Onozato ML, Kovach AE, Yeap BY, et al. Tumor islands in resected early-stage lung adenocarcinomas are associated with unique clinicopathologic and molecular characteristics and worse prognosis. Am J Surg Pathol 2013; 37: 287-94. ArticlePubMedPMC
- 5. Travis WD, Brambilla E, Nicholson AG, et al. The 2015 World Health Organization classification of lung tumors: impact of genetic, clinical and radiologic advances since the 2004 classification. J Thorac Oncol 2015; 10: 1243-60. ArticlePubMed
- 6. Kadota K, Nitadori JI, Sima CS, et al. Tumor spread through air spaces is an important pattern of invasion and impacts the frequency and location of recurrences after limited resection for small stage I lung adenocarcinomas. J Thorac Oncol 2015; 10: 806-14. ArticlePubMedPMC
- 7. Warth A, Muley T, Kossakowski CA, et al. Prognostic impact of intra-alveolar tumor spread in pulmonary adenocarcinoma. Am J Surg Pathol 2015; 39: 793-801. ArticlePubMed
- 8. Lee MA, Kang J, Lee HY, et al. Spread through air spaces (STAS) in invasive mucinous adenocarcinoma of the lung: incidence, prognostic impact, and prediction based on clinicoradiologic factors. Thorac Cancer 2020; 11: 3145-54. ArticlePubMedPMC
- 9. Yanagawa N, Shiono S, Endo M, Ogata SY. Tumor spread through air spaces is a useful predictor of recurrence and prognosis in stage I lung squamous cell carcinoma, but not in stage II and III. Lung Cancer 2018; 120: 14-21. ArticlePubMed
- 10. Aly RG, Rekhtman N, Li X, et al. Spread through air spaces (STAS) is prognostic in atypical carcinoid, large cell neuroendocrine carcinoma, and small cell carcinoma of the lung. J Thorac Oncol 2019; 14: 1583-93. ArticlePubMedPMC
- 11. Shiono S, Yanagawa N. Spread through air spaces is a predictive factor of recurrence and a prognostic factor in stage I lung adenocarcinoma. Interact Cardiovasc Thorac Surg 2016; 23: 567-72. ArticlePubMed
- 12. Alvarez Moreno JC, Aljamal AA, Bahmad HF, et al. Correlation between spread through air spaces (STAS) and other clinicopathological parameters in lung cancer. Pathol Res Pract 2021; 220: 153376.ArticlePubMed
- 13. Cao L, Jia M, Sun PL, Gao H. Histopathologic features from preoperative biopsies to predict spread through air spaces in early-stage lung adenocarcinoma: a retrospective study. BMC Cancer 2021; 21: 913.ArticlePubMedPMCPDF
- 14. Han YB, Kim H, Mino-Kenudson M, et al. Tumor spread through air spaces (STAS): prognostic significance of grading in non-small cell lung cancer. Mod Pathol 2021; 34: 549-61. ArticlePubMedPDF
- 15. Tian Y, Feng J, Jiang L, et al. Integration of clinicopathological and mutational data offers insight into lung cancer with tumor spread through air spaces. Ann Transl Med 2021; 9: 985.ArticlePubMedPMC
- 16. Xie H, Su H, Zhu E, et al. Morphological subtypes of tumor spread through air spaces in non-small cell lung cancer: prognostic heterogeneity and its underlying mechanism. Front Oncol 2021; 11: 608353.ArticlePubMedPMC
- 17. Xie H, Dou S, Huang X, Wen Y, Yang L. The effect of spread through air spaces on postoperative recurrence-free survival in patients with multiple primary lung cancers. World J Surg Oncol 2024; 22: 75.ArticlePubMedPMCPDF
- 18. Liu H, Yin Q, Yang G, Qie P. Prognostic impact of tumor spread through air spaces in non-small cell lung cancers: a meta-analysis including 3564 patients. Pathol Oncol Res 2019; 25: 1303-10. ArticlePubMedPDF
- 19. Terada Y, Takahashi T, Morita S, et al. Spread through air spaces is an independent predictor of recurrence in stage III (N2) lung adenocarcinoma. Interact Cardiovasc Thorac Surg 2019; 29: 442-8. ArticlePubMedPDF
- 20. Chen D, Wang X, Zhang F, et al. Could tumor spread through air spaces benefit from adjuvant chemotherapy in stage I lung adenocarcinoma?: a multi-institutional study. Ther Adv Med Oncol 2020; 12: 1758835920978147.ArticlePubMedPMCPDF
- 21. Jia M, Yu S, Yu J, Li Y, Gao H, Sun PL. Comprehensive analysis of spread through air spaces in lung adenocarcinoma and squamous cell carcinoma using the 8th edition AJCC/UICC staging system. BMC Cancer 2020; 20: 705.ArticlePubMedPMCPDF
- 22. Mantovani S, Pernazza A, Bassi M, et al. Prognostic impact of spread through air spaces in lung adenocarcinoma. Interact Cardiovasc Thorac Surg 2022; 34: 1011-5. ArticlePubMedPMCPDF
- 23. Chen Z, Wu X, Fang T, et al. Prognostic impact of tumor spread through air spaces for T2aN0 stage IB non-small cell lung cancer. Cancer Med 2023; 12: 15246-55. ArticlePubMedPMC
- 24. Wang S, Hao J, Qian C, Wang H. Tumor spread through air spaces is a survival predictor in non-small-cell lung cancer. Clin Lung Cancer 2019; 20: e584-91. ArticlePubMed
- 25. Shiono S, Endo M, Suzuki K, Hayasaka K, Yanagawa N. Spread through air spaces in lung cancer patients is a risk factor for pulmonary metastasis after surgery. J Thorac Dis 2019; 11: 177-87. ArticlePubMedPMC
- 26. Chen D, Mao Y, Wen J, et al. Tumor spread through air spaces in non-small cell lung cancer: a systematic review and meta-analysis. Ann Thorac Surg 2019; 108: 945-54. ArticlePubMed
- 27. Uruga H, Fujii T, Fujimori S, Kohno T, Kishi K. Semiquantitative assessment of tumor spread through air spaces (STAS) in early-stage lung adenocarcinomas. J Thorac Oncol 2017; 12: 1046-51. ArticlePubMed
- 28. Kadota K, Kushida Y, Katsuki N, et al. Tumor spread through air spaces is an independent predictor of recurrence-free survival in patients with resected lung squamous cell carcinoma. Am J Surg Pathol 2017; 41: 1077-86. ArticlePubMed
- 29. Kodama K, Higashiyama M, Okami J, et al. Oncologic outcomes of segmentectomy versus lobectomy for clinical T1a N0 M0 non-small cell lung cancer. Ann Thorac Surg 2016; 101: 504-11. ArticlePubMed
- 30. Wang J, Yao Y, Tang D, Gao W. Spread through air spaces (STAS) in surgically resected lung adenocarcinoma prognosis. Indian J Surg 2023; 85: 483-90. ArticlePDF
- 31. Cao D, Sha J, Cui R, Han S. Advances in research of spreading through air spaces and the effects on the prognosis of lung cancer. Cancer Manag Res 2019; 11: 9725-32. ArticlePubMedPMC
- 32. Jia M, Yu S, Gao H, Sun PL. Spread through air spaces (STAS) in lung cancer: a multiple-perspective and update review. Cancer Manag Res 2020; 12: 2743-52. ArticlePubMedPMC
- 33. Nicholson AG, Tsao MS, Beasley MB, et al. The 2021 WHO classification of lung tumors: impact of advances since 2015. J Thorac Oncol 2022; 17: 362-87. ArticlePubMed
- 34. Moreira AL, Ocampo PS, Xia Y, et al. A grading system for invasive pulmonary adenocarcinoma: a proposal from the International Association for the Study of Lung Cancer Pathology Committee. J Thorac Oncol 2020; 15: 1599-610. ArticlePubMedPMC
- 35. Mirsadraee S, Oswal D, Alizadeh Y, Caulo A, van Beek E Jr. The 7th lung cancer TNM classification and staging system: review of the changes and implications. World J Radiol 2012; 4: 128-34. ArticlePubMedPMC
- 36. Detterbeck FC. The eighth edition TNM stage classification for lung cancer: what does it mean on main street? J Thorac Cardiovasc Surg 2018; 155: 356-9. ArticlePubMed
- 37. Ma K, Zhan C, Wang S, Shi Y, Jiang W, Wang Q. Spread through air spaces (STAS): a new pathologic morphology in lung cancer. Clin Lung Cancer 2019; 20: e158-62. ArticlePubMed
- 38. Huang L, Tang L, Dai L, Shi Y. The prognostic significance of tumor spread through air space in stage I lung adenocarcinoma. Thorac Cancer 2022; 13: 997-1005. ArticlePubMedPMCPDF
- 39. Hu SY, Hsieh MS, Hsu HH, et al. Correlation of tumor spread through air spaces and clinicopathological characteristics in surgically resected lung adenocarcinomas. Lung Cancer 2018; 126: 189-93. ArticlePubMed
- 40. Lee JS, Kim EK, Kim M, Shim HS. Genetic and clinicopathologic characteristics of lung adenocarcinoma with tumor spread through air spaces. Lung Cancer 2018; 123: 121-6. ArticlePubMed
- 41. Dai C, Xie H, Su H, et al. Tumor spread through air spaces affects the recurrence and overall survival in patients with lung adenocarcinoma >2 to 3 cm. J Thorac Oncol 2017; 12: 1052-60. ArticlePubMed
- 42. Lu S, Tan KS, Kadota K, et al. Spread through air spaces (STAS) is an independent predictor of recurrence and lung cancer-specific death in squamous cell carcinoma. J Thorac Oncol 2017; 12: 223-34. ArticlePubMedPMC
- 43. Eguchi T, Kameda K, Lu S, et al. Lobectomy is associated with better outcomes than sublobar resection in spread through air spaces (STAS)-positive T1 lung adenocarcinoma: a propensity score-matched analysis. J Thorac Oncol 2019; 14: 87-98. ArticlePubMedPMC
- 44. Masai K, Sakurai H, Sukeda A, et al. Prognostic impact of margin distance and tumor spread through air spaces in limited resection for primary lung cancer. J Thorac Oncol 2017; 12: 1788-97. ArticlePubMed
- 45. Chen X, Zhou H, Wu M, et al. Prognostic impact of spread through air spaces in patients with ≤2 cm stage IA lung adenocarcinoma. J Thorac Dis 2024; 16: 2432-42. ArticlePubMedPMC
- 46. Choi S, Kim HS, Min KW, et al. JAK2 loss arising from tumor-spread-through-air-spaces (STAS) promotes tumor progression by suppressing CD8+ T cells in lung adenocarcinoma: a machine learning approach. J Korean Med Sci 2024; 39: e16. ArticlePubMedPMCPDF
- 47. Yildirim S, Alan O, Yuksel Yasar Z, et al. Prognostic impact and clinical features of spread through air spaces in operated lung cancer: real-world analysis. Medicina (Kaunas) 2024; 60: 1374.ArticlePubMedPMC
- 48. Pyo JS, Kim NY. Clinicopathological impact of the spread through air space in non-small cell lung cancer: a meta-analysis. Diagnostics (Basel) 2022; 12: 1112.ArticlePubMedPMC
- 49. Wang S, Li Y, Sun X, et al. Proposed novel grading system for stage I invasive lung adenocarcinoma and a comparison with the 2020 IASLC grading system. Thorac Cancer 2024; 15: 519-28. ArticlePubMedPMC
- 50. Lv Y, Li S, Liu Z, et al. Impact of surgery and adjuvant chemotherapy on the survival of stage I lung adenocarcinoma patients with tumor spread through air spaces. Lung Cancer 2023; 177: 51-8. ArticlePubMed
- 51. Morimoto J, Nakajima T, Suzuki H, et al. Impact of free tumor clusters on prognosis after resection of pulmonary adenocarcinoma. J Thorac Cardiovasc Surg 2016; 152: 64-72. ArticlePubMed
- 52. Liu A, Sun X, Xu J, et al. Relevance and prognostic ability of Twist, Slug and tumor spread through air spaces in lung adenocarcinoma. Cancer Med 2020; 9: 1986-98. ArticlePubMedPMCPDF
- 53. Hashinokuchi A, Akamine T, Toyokawa G, et al. Impact of the distance of spread through air spaces in non-small cell lung cancer. Interdiscip Cardiovasc Thorac Surg 2024; 40: ivae181.ArticlePubMedPMCPDF
- 54. Toyokawa G, Yamada Y, Tagawa T, et al. Significance of spread through air spaces in resected lung adenocarcinomas with lymph node metastasis. Clin Lung Cancer 2018; 19: 395-400. ArticlePubMed
- 55. Huang L, Petersen RH. Tumour spread through air spaces is a determiner for treatment of clinical stage I non-small cell lung cancer: thoracoscopic segmentectomy vs lobectomy. Lung Cancer 2025; 201: 108438.ArticlePubMed
- 56. Travis WD, Eisele M, Nishimura KK, et al. The International Association for the Study of Lung Cancer (IASLC) Staging Project for Lung Cancer: recommendation to introduce spread through air spaces as a histologic descriptor in the ninth edition of the TNM classification of lung cancer. Analysis of 4061 pathologic stage I NSCLC. J Thorac Oncol 2024; 19: 1028-51. ArticlePubMed
REFERENCES
Figure & Data
References
Citations
 PubReader
 ePub Link
-
 Cite this Article
- Cite this Article
-
- Close
- Download Citation
- Close
- Figure
-


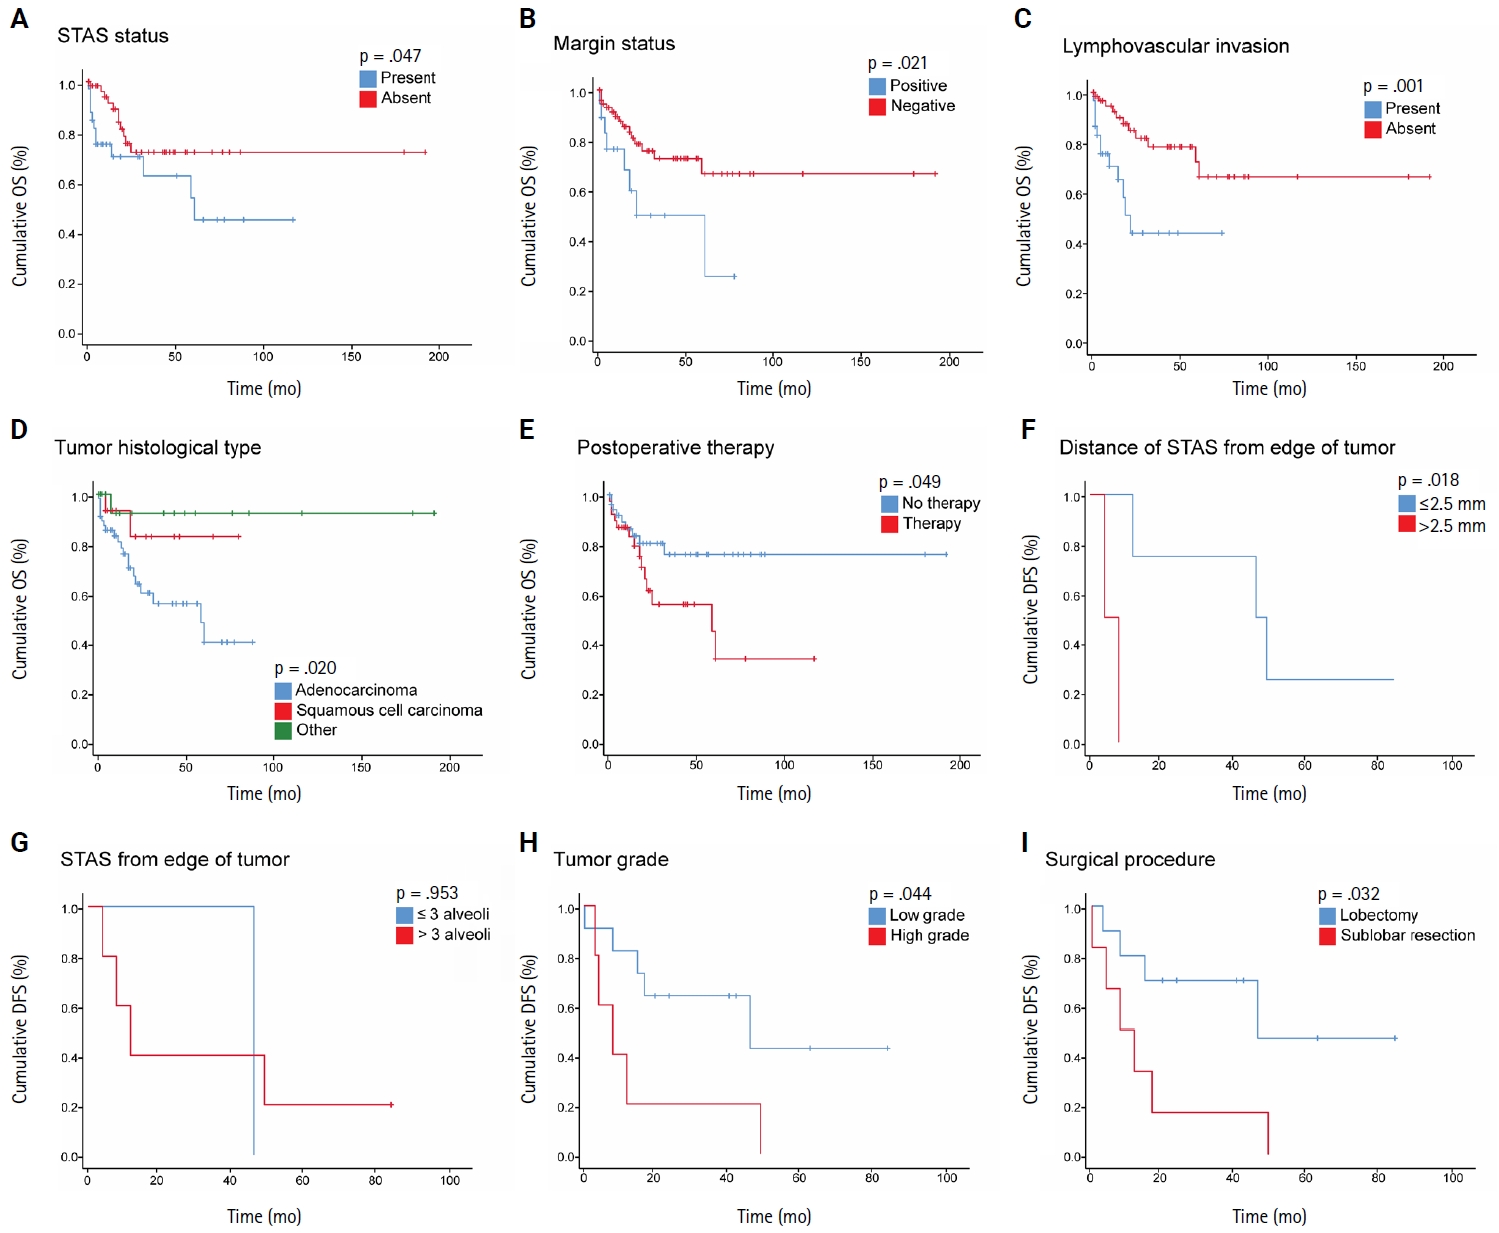
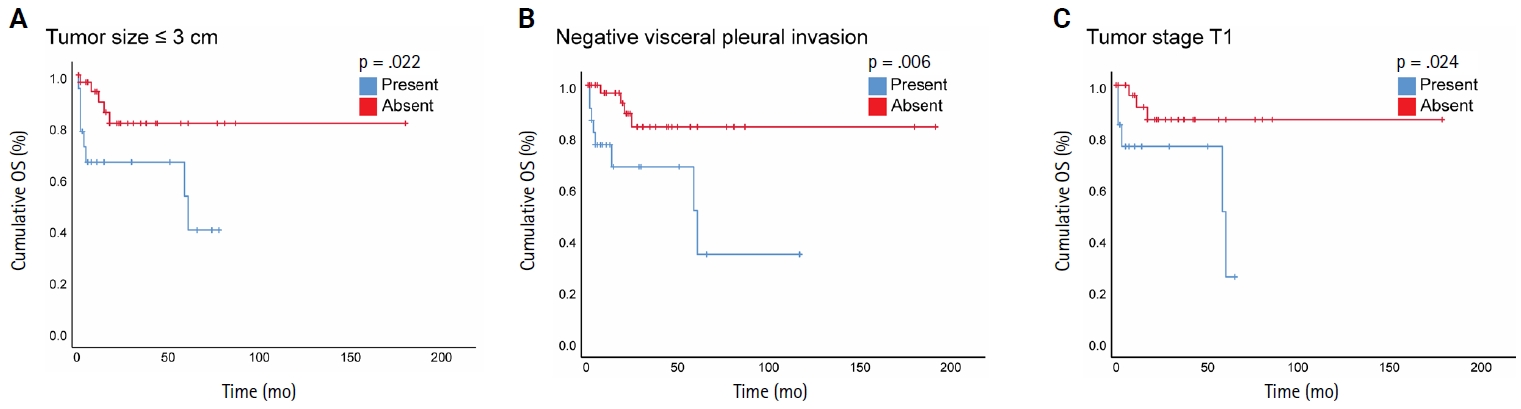

Fig. 1.
Fig. 2.
Fig. 3.
Graphical abstract
| Variable | Total (n = 96) | STAS status | p-value | |
|---|---|---|---|---|
| Present | Absent | |||
| Age (yr) | ||||
| ≤60 | 36 (37.5) | 12 (33.3) | 24 (66.7) | .868 |
| >60 | 60 (62.5) | 21 (35.0) | 39 (65.0) | |
| Sex | ||||
| Male | 70 (72.9) | 27 (38.6) | 43 (61.4) | .155 |
| Female | 26 (27.1) | 6 (23.1) | 20 (76.9) | |
| Smoking status | ||||
| Former or current smoker | 61 (63.5) | 24 (39.3) | 37 (60.7) | .176 |
| Never-smoker | 35 (36.5) | 9 (25.7) | 26 (74.3) | |
| Tumor side | ||||
| Right | 60 (62.5) | 22 (36.7) | 38 (63.3) | .542 |
| Left | 36 (37.5) | 11 (30.6) | 25 (69.4) | |
| Tumor site | ||||
| RUL | 37 (38.5) | 13 (35.1) | 24 (64.9) | .828 |
| RML | 7 (7.3) | 2 (28.6) | 5 (71.4) | |
| RLL | 16 (16.7) | 7 (43.8) | 9 (56.2) | |
| LUL | 20 (20.8) | 5 (25.0) | 15 (75.0) | |
| LLL | 16 (16.7) | 6 (37.5) | 10 (62.5) | |
| Surgical procedure | ||||
| Lobectomy | 54 (56.3) | 17 (31.4) | 37 (68.6) | .499 |
| Sublobar resection (wedge resection or segmentectomy) | 42 (43.7) | 16 (38.1) | 26 (61.9) | |
| Margin status | ||||
| Positive | 18 (18.8) | 9 (50.0) | 9 (50.0) | .122 |
| Negative | 78 (81.3) | 24 (30.8) | 54 (69.2) | |
| Histological subtypes | ||||
| Adenocarcinoma | 61 (63.5) | 27 (44.3) | 34 (55.7) | .031 |
| Squamous cell carcinoma | 17 (17.7) | 3 (17.7) | 14 (82.3) | |
| Other | 18 (18.8) | 3 (16.7) | 15 (83.3) | |
| Tumor grade | ||||
| Grade 1 | 16 (16.7) | 1 (6.3) | 15 (93.7) | <.001 |
| Grade 2 | 46 (47.9) | 11 (23.9) | 35 (76.1) | |
| Grade 3 | 34 (35.4) | 21 (61.8) | 13 (38.2) | |
| pT stage classification | ||||
| pT1 | 48 (50.0) | 14 (29.1) | 34 (70.9) | .513 |
| pT2 | 26 (27.1) | 12 (46.2) | 14 (53.8) | |
| pT3 | 16 (16.7) | 5 (31.3) | 11 (68.7) | |
| pT4 | 5 (5.2) | 2 (40.0) | 3 (60.0) | |
| Not assessable | 1 (1.0) | 0 | 1 (100) | |
| pN stage classification | ||||
| pN0 | 43 (44.8) | 13 (30.2) | 30 (69.8) | .801 |
| pN1 | 15 (15.6) | 5 (33.3) | 10 (66.7) | |
| pN2 | 8 (8.3) | 3 (37.5) | 5 (62.5) | |
| pNx | 30 (31.3) | 12 (40.0) | 18 (60.0) | |
| Pathological stage | ||||
| Stage I, II | 51 (53.1) | 18 (35.3) | 33 (64.7) | .313 |
| Stage III, IV | 17 (17.7) | 8 (47.1) | 9 (52.9) | |
| NA | 28 (29.2) | 7 (25.0) | 21 (75.0) | |
| Tumor size | ||||
| ≤3 cm | 58 (60.4) | 19 (32.8) | 39 (67.2) | .545 |
| >3 cm | 36 (37.5) | 14 (38.9) | 22 (61.1) | |
| Not assessable | 2 (2.1) | 0 | 2 (100) | |
| Visceral pleural invasion | ||||
| Present | 23 (24.0) | 10 (43.5) | 13 (56.5) | .291 |
| Absent | 70 (72.9) | 22 (31.4) | 48 (68.6) | |
| Not assessable | 3 (3.1) | 1 (33.3) | 2 (66.7) | |
| Lymphovascular invasion | ||||
| Present | 30 (31.3) | 15 (50.0) | 15 (50.0) | .03 |
| Absent | 66 (68.7) | 18 (27.3) | 48 (72.7) | |
| Necrosis | ||||
| Present | 33 (34.4) | 15 (45.5) | 18 (54.5) | .098 |
| Absent | 63 (65.6) | 18 (28.6) | 45 (71.4) | |
| Predominant growth pattern (ADC cases = 61) | 61(100) | 27 (44.3) | 34 (55.7) | .065 |
| Lepidic | 9 (14.8) | 2 (22.2) | 7 (77.8) | |
| Acinar | 34 (55.7) | 13 (38.2) | 21 (61.8) | |
| Papillary | 5 (8.2) | 2 (40.0) | 3 (60.0) | |
| Solid | 10 (16.4) | 7 (70.0) | 3 (30.0) | |
| Micropapillary | 3 (4.9) | 3 (100) | 0 | |
| Postoperative chemo/radiotherapy | ||||
| Yes | 38 (39.6) | 17 (44.8) | 21 (55.2) | .084 |
| No | 58 (60.4) | 15 (25.9) | 43 (74.1) | |
| Predictor | OR | 95% CI | p-value |
|---|---|---|---|
| Histological subtype (reference: ADC) | - | - | .135 |
| SqCC | 3.908 | 0.926–16.493 | .064 |
| Other | 2.201 | 0.470–10.317 | .566 |
| Tumor grade (reference: grade 1) | .001 | ||
| Grade 2 | 0.209 | 0.076–0.575 | .221 |
| Grade 3 | 3.994 | 0.434–36.709 | .002 |
| LVI (reference: absent) | 0.621 | 0.219–1.760 | .370 |
| Variable | Reference category | Univariate analysis | Multivariate analysis | ||||
|---|---|---|---|---|---|---|---|
| HR | 95% CI | p-value | HR | 95% CI | p-value | ||
| Age | ≤60 yr | 2.017 | 0.793–5.128 | .141 | |||
| Sex | Female | 0.679 | 0.267–1.730 | .679 | |||
| Histological subtype (overall) | ADC | - | - | .049 | .087 | ||
| SqCC | ADC | 0.316 | 0.074–1.354 | .121 | 0.343 | 0.080–1.474 | .151 |
| Other | ADC | 0.127 | 0.017–0.953 | .045 | 0.162 | 0.021–1.215 | .077 |
| Lymphovascular invasion | Absent | 3.743 | 1.613–8.684 | .002 | 3.143 | 1.347–7.338 | .008 |
| Margin status | Negative | 2.644 | 1.119–6.251 | .027 | 2.448 | 1.033–5.801 | .042 |
| Necrosis | Absent | 1.272 | 0.537–3.016 | .584 | |||
| Pathological stage | Stage I–II | 2.746 | 0.930–8.107 | .067 | |||
| pN category (overall) | pN0 | - | - | .396 | |||
| pN1 | pN0 | 2.162 | 0.704–6.640 | .178 | |||
| pN2 | pN0 | 1.108 | 0.136–9.021 | .924 | |||
| Predominant growth pattern (ADC overall) | Acinar | - | - | .222 | |||
| Solid | Acinar | 2.706 | 0.883–8.294 | .081 | |||
| Papillary | Acinar | 1.057 | 0.285–3.920 | .934 | |||
| Micropapillary | Acinar | 0.750 | 0.095–5.946 | .786 | |||
| Lepidic | Acinar | 0.264 | 0.034–2.071 | .205 | |||
| pT category (overall) | pT1 | - | - | .387 | |||
| T2 | pT1 | 1.831 | 0.662–5.064 | .244 | |||
| T3 | pT1 | 2.011 | 0.657–6.161 | .221 | |||
| T4 | pT1 | 2.766 | 0.567–0.724 | .137 | |||
| Smoking status | Smoker | 0.502 | 0.197–1.276 | .147 | |||
| STAS distance from tumor edge | ≤2.5 mm | 0.901 | 0.287–2.825 | .858 | |||
| STAS from edge of tumor | ≤3 alveoli | 0.611 | 0.159–2.341 | .472 | |||
| STAS morphological subtype (overall) | Single cells | - | - | .259 | |||
| Solid nests | Single cells | 554.268 | 0.233–1,316,585.998 | .111 | |||
| Micropapillary | Single cells | 16.782 | 0.037–7,547.348 | .366 | |||
| STAS status | Absent | 2.250 | 0.987–5.129 | .054 | |||
| Surgical procedure | Lobectomy | 1.635 | 0.717–3.728 | .242 | |||
| Treatment history (adjuvant) | Treated | 0.441 | 0.190–1.022 | .056 | |||
| Tumor grade | Grade 1 | .126 | |||||
| Grade 2 | Grade 1 | 5.786 | 0.744–45.001 | .093 | |||
| Grade 3 | Grade 1 | 8.096 | 1.041–62.954 | .046 | |||
| Tumor location | Left | 1.122 | 0.474–2.658 | .794 | |||
| Tumor size | ≤3 cm | 1.171 | 0.512–2.677 | .708 | |||
| Visceral pleural invasion | Negative | 2.164 | 0.911–5.141 | .080 | |||
| Variable | Reference category | Univariate analysis | ||
|---|---|---|---|---|
| HR | 95% CI | p-value | ||
| Age | ≤60 yr | 1.317 | 0.525–3.578 | .519 |
| Sex | Female | 1.103 | 0.332–3.663 | .873 |
| Lymphovascular invasion | Absent | 2.559 | 1.041–6.288 | .041 |
| Margin status | Negative | 2.190 | 0.868–5.527 | .097 |
| Necrosis | Absent | 2.200 | 0.837–5.784 | .110 |
| Pathologic stage | Stage I–II | 2.121 | 0.646–6.961 | .215 |
| pN category (overall) | pN0 | - | - | .516 |
| pN1 | pN0 | 1.969 | 0.620–6.961 | .250 |
| pN2 | pN0 | 0.000 | 0.000 | .983 |
| Predominant growth pattern | Acinar | - | - | .222 |
| Solid | Acinar | 2.706 | 0.883–8.294 | .081 |
| Papillary | Acinar | 1.057 | 0.285–3.920 | .934 |
| Micropapillary | Acinar | 0.750 | 0.095–5.946 | .786 |
| Lepidic | Acinar | 0.264 | 0.034–2.071 | .205 |
| pT category (overall) | pT1 | - | - | .654 |
| T2 | pT1 | 1.219 | 0.383–3.880 | .737 |
| T3 | pT1 | 1.833 | 0.579–5.802 | .303 |
| T4 | pT1 | 2.040 | 0.518–8.031 | .308 |
| Smoking status | Smoker | 0.578 | 0.200–1.518 | .266 |
| STAS distance from tumor edge | ≤2.5 mm | 1.103 | 0.332–3.663 | .873 |
| STAS from edge of tumor | ≤3 alveoli | 0.725 | 0.184–2.861 | .646 |
| STAS morphologic subtype (overall) | Single cells | - | - | .411 |
| Solid nests | Single cells | 954.001 | 0.021–44,129,592.574 | .211 |
| Micropapillary | Single cells | 17.077 | 0.004-77,386.721 | .509 |
| STAS status | Absent | 1.474 | 0.603-3.603 | .395 |
| Surgical procedure | Lobectomy | 0.985 | 0.408-2.382 | .974 |
| Treatment history (adjuvant) | Treated | 0.832 | 0.339-2.039 | .668 |
| Tumor grade | Grade 1 | .510 | ||
| Grade 2 | Grade 1 | 3.226 | 0.410-25.403 | .266 |
| Grade 3 | Grade 1 | 3.361 | 0.424-26.660 | .251 |
| Tumor location | Left | 1.658 | 0.634-4.337 | .303 |
| Tumor size | ≤3 cm | 1.163 | 0.480-2.816 | .738 |
| Visceral pleural invasion | Negative | 1.232 | 0.478-3.175 | .666 |
Values are presented as number (%). p < .05 is considered significant. STAS, spread through air spaces; RUL, right upper lobe; RML, right middle lobe; RLL, right lower lobe; LUL, left upper lobe; LLL, left lower lobe; ADC, adenocarcinoma.
p < .05 is considered significant. STAS, spread through air spaces; OR, odds ratio; CI, confidence interval; ADC, adenocarcinoma; SqCC, squamous cell carcinoma; LVI, lymphovascular invasion.
p < .05 is considered significant. HR, hazard ratio; CI, confidence interval; SqCC, squamous cell carcinoma; ADC, adenocarcinoma; STAS, spread through air spaces.
p < .05 is considered significant. HR, hazard ratio; CI, confidence interval; STAS, spread through air spaces.

