 E-submission
Articles
- Page Path
- HOME > J Pathol Transl Med > Volume 60(1); 2026 > Article
-
Original Article
PSMA expression in hepatic colorectal cancer metastasis -
Eundong Park1
 , Michel Kmeid2, Xin Wang1, Haiyan Qiu1, Clifton G. Fulmer2, Marcello P. Toscano2, Nusret Bekir Subasi1, Maciej Gracz1, Hwajeong Lee1
 -
Journal of Pathology and Translational Medicine 2026;60(1):107-123.
DOI: https://doi.org/10.4132/jptm.2025.10.20
Published online: January 14, 2026
1Department of Pathology and Laboratory Medicine, Albany Medical Center, Albany, NY, USA
2Department of Pathology, Cleveland Clinic, Cleveland, OH, USA
- Corresponding Author: Hwajeong Lee, MD Department of Pathology and Laboratory Medicine, Albany Medical Center, Mail Code 81, 47 New Scotland Avenue, Albany, NY 12208, USA Tel: +1-518-262-6254, Fax: +1-518-262-3663, E-mail: leeh5@amc.edu
© The Korean Society of Pathologists/The Korean Society for Cytopathology
This is an Open Access article distributed under the terms of the Creative Commons Attribution Non-Commercial License (http://creativecommons.org/licenses/by-nc/4.0) which permits unrestricted non-commercial use, distribution, and reproduction in any medium, provided the original work is properly cited.
Abstract
-
Background
- Prostate-specific membrane antigen (PSMA) is expressed in the neovasculature of various malignancies, such as colorectal cancer (CRC) and hepatocellular carcinoma (HCC). However, PSMA expression in hepatic CRC metastasis has not been studied in detail.
-
Methods
- The PSMA expression in primary CRC and corresponding hepatic metastasis was evaluated by immunohistochemistry in a metastatic CRC cohort (n = 56), which was divided into subgroups according to treatment history and timing of metastasis. Demographic and histological characteristics of primary CRC were collected and their relationships with PSMA expression were examined. Additionally, the PSMA expression in resected HCC (n = 76) was compared with that of hepatic CRC metastasis.
-
Results
- In primary CRC, PSMA level showed a positive association with tumor size. Lower PSMA expression in hepatic metastasis was associated with higher primary CRC grade, advanced pTNM stage at the time of CRC resection, presence of tumor deposit, and unresectability of metastatic lesion. PSMA expression in primary CRC correlated with that in hepatic metastasis only in concurrent and untreated metastasis subgroup. PSMA expression in primary CRC and hepatic metastasis, regardless of treatment history and timing of metastasis, was not significantly different from that of HCC.
-
Conclusions
- Several adverse pathological features of primary CRC were associated with a lower PSMA expression in hepatic metastasis. PSMA expression in hepatic metastasis correlated with that of primary CRC only in concurrent and untreated subgroup. Primary HCC and hepatic CRC metastasis show comparable levels of PSMA expression.
- Prostate-specific membrane antigen (PSMA) is a transmembrane protein first identified in prostate cancer cell line LNCaP [1]. Although its role in cancer development is unclear, PSMA expression in prostate cancer is significantly higher than in benign prostate tissue [2]. PSMA-directed approaches, one of which was approved by the Food and Drug Administration for use in metastatic castration-resistant prostate cancer, are regarded as promising novel treatments for prostate cancer [3].
- Notably, immunohistochemistry (IHC) studies reported PSMA expression in neovasculature of various non-prostatic malignancies [2,4]. Moreover, PSMA expression was found to have diagnostic and prognostic significance in non-prostatic cancers, including hepatocellular carcinoma (HCC) and colorectal cancer (CRC). Compared to conventional CD34 IHC, PSMA IHC can differentiate HCC from benign hepatic lesions more accurately [5]. HCC patients with higher PSMA expression have more aggressive histology and worse prognosis [6,7]. While higher PSMA expression in CRC tumor neovasculature was associated with several unfavorable clinical and histologic features [8,9], our previous study [10] suggested a contrasting trend.
- Due to its distinct expression profile, PSMA serves as a diagnostic and therapeutic target for various non-prostatic solid cancers [11], such as HCC and CRC. PSMA–positron emission tomography computed tomography (PET/CT) had a comparable [12] or higher [13] detection rate for HCC than conventional fluorodeoxyglucose-PET/CT. A series of case reports have described primary and metastatic CRC being incidentally detected by PSMA-PET/CT [14-17]. Additionally, preliminary analysis suggested that as in prostate cancer patients [18], PSMA-PET/CT radiotracer uptake in HCC patients reflects PSMA IHC results [19], which suggests IHC studies can provide insight into the potential applicability of PSMA theranostics in non-prostatic cancers.
- Liver is the most common site for CRC metastasis [20]. 20% of CRC patients have a distant metastasis at diagnosis [21], and 30%–50% of patients develop hepatic metastasis at some time point [22]. Therefore, considering its prevalence, a detailed investigation of PSMA expression in hepatic CRC metastasis could advance the understanding of the disease and support the development of novel treatments. However, currently, there are no comprehensive studies examining PSMA expression and its association with clinical and pathological features in hepatic CRC metastasis. Pilot studies reported that most liver metastasis in CRC patients were PSMA (+), with identical PSMA staining pattern and degrees to that of primary CRC from the same patient [8].
- This study aims to evaluate PSMA expression in hepatic CRC metastasis. CRC patients who underwent primary CRC resection without neoadjuvant therapy (n = 56) and with hepatic metastasis were identified and grouped by treatment history (untreated subgroup; n = 47 and treated subgroup; n = 9, see Materials and Methods below) and timing of metastasis (concurrent metastasis subgroup; n = 41 and metachronous metastasis subgroup; n = 15, see Materials and Methods below). Clinicopathological features associated with PSMA expression in primary CRC and hepatic metastasis were identified. PSMA expression in primary CRC and hepatic metastasis were examined to assess their possible correlation. Since PSMA-targeted imaging has shown some promise in HCC, PSMA expression in hepatic CRC metastasis and HCC were compared in an attempt to examine whether such modalities could be applied in hepatic CRC metastasis. To improve readability, hepatic CRC metastasis is referred to as hepatic metastasis in the main text.
INTRODUCTION
- Study populations
- The study cohort includes 56 patients with CRC who underwent primary surgical resection without neoadjuvant therapy at Albany Medical Center (AMC) with concurrent or metachronous hepatic metastasis. Cases with available tumor tissue were included. The timing of metastatic tissue sampling was either synchronous (n = 41) or metachronous (metastasis was not detected at the time of initial staging work-up and CRC resection; n = 15) relative to the CRC resection. Hepatic metastases were sampled by Tru-cut/wedge biopsy (n = 23) or resection (n = 33). Patients who underwent needle core biopsy for their hepatic metastasis by vascular and interventional radiology were excluded.
- Fig. 1 outlines the patient cohorts, subgroups, and analyses presented in this study. All primary CRC were untreated at the time of resection. Three sets of subgroup analysis were conducted: (1) untreated (n = 47; biopsied or resected) vs. chemotherapy-treated (n = 9; resected following chemotherapy) hepatic metastasis, (2) concurrent (n = 41) vs. metachronous (n = 15) metastasis, and (3) untreated and concurrent metastasis (n = 34) vs. treated and/or metachronous (n = 22) metastasis. The rationale for this grouping was based on our observation that tumor characteristics and treatment status are associated with PSMA expression in CRC [10].
- Clinical data were extracted from electronic medical records, which included age, sex, colorectal tumor location, tumor size, and survival outcomes from the time of CRC resection. For hepatic metastasis, presence of multifocal hepatic metastasis, size of hepatic lesion, tissue acquisition method, operability as determined by surgeon and timing of tissue retrieval were recorded. Demographics, primary CRC characteristics, and hepatic metastasis characteristics by treatment status are summarized in Table 1. For the control HCC group, the previously described cohort of 76 HCC patients who underwent hepatic resection in AMC from 2003 to 2019 was used [5].
- Histologic review
- Hematoxylin and eosin–stained slides of primary CRC and corresponding hepatic metastasis were retrieved for histologic review. Primary CRC was graded according to American Joint Committee on Cancer grading criteria. Examined histologic parameters included pT category, pN category, pTNM stage at the time of primary CRC resection, the number of positive lymph nodes, tumor deposits, tumor budding score, presence of precursor lesions, tumor-stroma ratio, lymphovascular invasion, perineural invasion, and primary CRC resection margin. For each case, representative tumor block was selected for IHC. When available, sections harboring tumor-benign tissue junction were selected.
- PSMA and CD34 IHC analysis
- The ratio of PSMA expression to that of pan-endothelial markers, such as CD31 or CD34, has been used as a part of scoring systems [23,24] or a direct measure [25-27] of vascular PSMA expression. In our laboratory, CD34 staining was more robust and easier to interpret than CD31. The PSMA/CD34 ratio, assessed by visual estimation (H.L.), was used as a score of PSMA expression. The ratio was categorized as high (≥50%) and low (<50%) expression for survival analyses, consistent with the threshold used in a previous study of primary CRC across all stages [10]. PSMA and CD34 IHC were performed on 5-µm-thick formalin-fixed paraffin-embedded tissue sections from the selected blocks using the same antibodies, protocols and detection kits as described before [5] (PSMA: 1D6, mouse monoclonal, 1:25, Novocastra, Leica, Buffalo Grove, IL, USA; CD34: QBEnd/10, mouse monoclonal, Ventana Medical Systems, Inc., Tucson, AZ, USA). Staining was carried out with Discovery Ultra Ventana System and OptiView DAB Detection Kit (Ventana Medical Systems, Inc.). Human prostate tissue and tonsillar tissue served as positive controls for PSMA and CD34 IHC, respectively. Benign colon and liver tissue from every inspected slide was PSMA-negative. Representative PSMA and CD34 IHC images of hepatic metastases and their corresponding primary CRCs are shown in Figs. 2 and 3.
- Statistical analysis
- Statistical analysis was performed using R version 4.3.3 (R Foundation for Statistical Computing, Vienna, Austria). Threshold for statistical significance was set as p-value < .05. Each continuous variable was assessed by Shapiro-Wilk test, with p > .05 as a cutoff for assuming normal distribution. The relationship with the PSMA/CD34 ratio and dichotomous variables were analyzed using the Wilcoxon rank-sum test, ordinal and continuous variables using Kendall’s tau (τ), and multi-level categorical variables using the Kruskal-Wallis test. Clinicopathological characteristics according to treatment history were assessed using the Wilcoxon rank-sum test and Fisher’s exact test.
- Cox proportional hazards (PH) model was used for the time-to-event analysis of overall survival (OS) and recurrence-free survival (RFS) for concurrent metastasis cases. Metachronous metastasis cases were excluded from the time-to-event analysis. Goodness-of-fit test with p > 0.05 was considered to meet the PH assumption. Hazard ratio (HR) and 95% confidence interval (CI) for each Cox PH model was reported. Representative values for continuous variables were range, mean, and median. Categorical variables were reported as frequencies and percentages (%).
MATERIALS AND METHODS
- PSMA expression in primary CRC and hepatic metastasis
- The summary statistics of the PSMA/CD34 ratio for the entire cohort, as well as subgroups stratified by treatment status and timing of metastasis, as shown in Fig. 1, are outlined in Table 2. In the entire cohort (n = 56), the PSMA/CD34 ratio in primary CRC had a mean of 27.1 (range, 0 to 85.0) and a median of 20.0. For hepatic metastasis, the mean was 29.2 (range, 0 to 95.0), with a median of 20.0.
- PSMA expression in primary CRC and clinicopathological features
- The associations between the clinicopathological parameters and PSMA expression in the primary CRC are summarized in Table 3. At the time of CRC resection, 1 (2%) case was pTNM stage I, two (4%) were II, 12 (21%) were III, and 41 (73%) were IV (Table 1). Patients with larger CRC (p = .013, τ = 0.241) had higher PSMA expression.
- PSMA expression in hepatic metastasis and clinicopathological features: entire cohort
- The associations between the clinicopathological characteristics and the PSMA expression in the hepatic metastasis are summarized in Table 4 and Supplementary Table S1. In the entire cohort (n = 56), the PSMA expression in hepatic metastasis was lower in high grade primary CRC (p = .005, τ = –0.318), higher pTNM stage at the time of CRC resection (p = .020, τ = –0.262) and the presence of tumor deposit (p = .037). Although pN stage was not related to PSMA levels, the presence of nodal involvement (pN0 vs. pN1–2) was marginally associated with a lower PSMA level (p = .065) in hepatic metastasis. Regarding the characteristics of hepatic metastasis, biopsy (p = .004), inoperable lesions (p = .005), and lesion acquired synchronously with CRC resection (p = .024) were associated with lower PSMA expression in hepatic metastasis. Prior chemotherapy did not have a significant impact on PSMA expression in hepatic metastasis (p = .653). Boxplots and scatterplots for variables showing significant associations with PSMA expression in primary CRC and hepatic metastasis are presented in Supplementary Fig. S1.
- PSMA expression in hepatic metastasis and clinicopathological features: grouped by treatment status
- In the untreated subgroup (n = 47), high grade primary CRC (p = .032, τ = –0.267), higher pTNM stage at the time of CRC resection (p = .048, τ = –0.244), the presence of tumor deposit (p = .036), biopsy (p = 0.004), and inoperable metastasis (p = .005) were significantly associated with lower PSMA expression in hepatic metastasis. Patients with nodal involvement (p = .051) tended to exhibit lower PSMA expression. In the chemotherapy-treated patients (n = 9), older age was associated with higher PSMA expression in hepatic metastasis (p = .035, τ = 0.572). Treated patients with higher primary CRC tumor grade tended to exhibit lower PSMA expression in hepatic metastasis; however, the association was marginal (p = .055)
- PSMA expression in hepatic metastasis and clinicopathological features: grouped by timing of metastasis
- In the concurrent metastasis subgroup (n = 41), lower PSMA expression in hepatic metastasis was associated with higher CRC grade (p = .006, τ = –0.372). However, regarding hepatic lesions, biopsy specimens (p = .045) and inoperable lesions (p = .049) were associated with lower PSMA expression in hepatic metastasis. In metachronous metastasis subgroup (n = 15), no significant associations were found between PSMA expression in hepatic metastasis and clinicopathological characteristics.
- PSMA expression in hepatic metastasis and clinicopathological features: concurrent and untreated metastasis vs. metachronous and/or treated metastasis
- In the concurrent and untreated metastasis subgroup (n = 34), negative associations between higher primary CRC grade (p = .036, τ = –0.314), biopsy specimens of hepatic lesions (p = .036), inoperable lesions (p = .040), and PSMA expression in hepatic metastasis were maintained. In contrast, in metachronous and/or treated subgroup (n = 22), PSMA expression in hepatic metastasis was not associated with any of the aforementioned clinicopathological parameters.
- PSMA expression in primary CRC and concurrent hepatic metastasis vs. survival outcomes
- Results for survival analysis are outlined in Supplementary Table S2. PSMA expression was grouped into PSMA-high (PSMA/CD34 ratio ≥ 50%) and PSMA-low (PSMA/CD34 ratio < 50%, see Materials and Methods). In concurrent metastasis cases, PSMA expression in primary CRC was not associated with OS (HR, 2.154; 95% CI, 0.891 to 5.204; p = .088) and RFS (HR, 5.480; 95% CI, 0.496 to 60.52; p = .165). Likewise, PSMA expression in the concurrent hepatic metastasis subgroup was not associated with OS and RFS (OS: HR, 0.546; 95% CI, 0.189 to 1.578; p = .264; RFS: HR, 0.348; 95% CI, 0.041 to 2.961; p = .334). Similarly, no association was found in the concurrent and untreated subgroup (OS: HR, 0.441; 95% CI, 0.131 to 1.490; p = .188, RFS: HR, 0.429; 95% CI, 0.046 to 4.003; p = .458). Sensitivity analyses using different cutoffs showed no significant association between PSMA expression in hepatic metastasis and prognosis (Supplementary Table S3). Kaplan-Meier plots and corresponding p-values from log-rank test are outlined in Supplementary Fig. S2.
- PSMA expression in hepatic metastasis compared to HCC
- To evaluate the potential of targeting PSMA in hepatic metastasis, PSMA expression in hepatic metastasis was compared with that of HCC. PSMA expression in hepatic metastasis was not significantly different from HCC in the entire cohort (p = .334). None of the subgroups showed significant differences in PSMA expression in hepatic metastasis compared to HCC (untreated subgroup: p = .313, treated subgroup: p = .818, concurrent metastasis subgroup: p = .084, metachronous metastasis subgroup: p = .327, concurrent and untreated subgroup: p = .096, metachronous and/or treated subgroup: p = .699) (Supplementary Fig. S3).
- Correlation of PSMA expression between hepatic metastasis and primary CRC
- The PSMA expression in primary CRC and matched hepatic metastasis from the same case were compared to assess possible association. A significant correlation in PSMA expression in primary CRC and hepatic metastasis was found in the entire cohort (p = .022, τ = 0.227) and untreated subgroup (p = .045, τ = 0.219), while no significant association was observed in the treated subgroup (p = .392, τ = 0.239) (Figs. 2, 3).
- When stratified by the timing of metastasis, a significant correlation in PSMA expression between primary CRC and hepatic metastasis was observed in the concurrent metastasis subgroup (p = 0.022, τ = 0.270), but not in the metachronous metastasis subgroup (p = 0.544, τ = 0.123). As expected, a similar pattern was observed when comparing concurrent and untreated metastasis subgroup (p = 0.033, τ = 0.279) with metachronous and/or treated subgroup (p = 0.302, τ = 0.167).
RESULTS
- Unlike previous studies that included CRC patients with or without metastasis, our cohort consists solely of hepatic metastasis cases. Haffner et al. [8] reported 16 (84.2%) of 19 liver CRC metastases were PSMA-positive, when low intensity staining in less than <10% of endothelium was considered negative [8]. Study by Abdel-Hadi et al. [9] included 13 CRC patients with distant metastasis and their results paralleled that of Haffner et al. [8]. However, tissue collection methods and treatment history were not specified in Haffner et al.’s study [8]. Abdel-Hadi et al. [9] excluded previously treated CRC cases but did not specify sites of sampled metastatic lesions. Our cohort consists of a larger number of patients (n = 56) with defined hepatic metastasis, treatment history, tissue collection method, and timing of metastasis. Further, correlation between PSMA expression in hepatic metastasis and pathological variables of primary CRC was examined in this study.
- Although it is relatively well documented that PSMA is upregulated as the cancer progresses [6,28-30], several conflicting findings have been reported [10,31]. PSMA expression in CRC patients was reported to be associated with higher CRC grade, male sex, presence of distant metastasis, and vascular invasion [8,9]. However, our previous study on a larger CRC cohort found that unfavorable prognostic features, such as higher pT, pN, and pTNM stage; the presence and greater number of tumor deposits; and the use of post-operative adjuvant treatment, were associated with lower PSMA expression [10]. In our current CRC cohort with concurrent or metachronous hepatic metastasis, except for tumor size, most clinicopathological variables previously reported to be associated with PSMA expression did not show statistically significant association. The discrepancy might stem from differences in study populations, or other factors may alter/impact PSMA expression in CRC with hepatic metastasis.
- In our entire cohort, PSMA level in hepatic metastasis was lower in high-grade primary CRC, advanced pTNM stage at the time of primary CRC resection and the presence of tumor deposit. In addition, nodal involvement in primary CRC showed a modest association with a lower PSMA expression in hepatic metastasis (p = .065). In terms of clinicopathological characteristics of hepatic lesions, biopsy, inoperable hepatic lesion and synchronous sampling with CRC resection were associated with lower PSMA expression in hepatic metastasis. The presence of tumor deposit is an independent adverse prognostic factor in CRC patients who undergo radical resection [32]. High pTNM stage, lymph node involvement and higher tumor grade are unfavorable prognostic features. Inoperable hepatic metastasis invariably portends a grim prognosis [33]. In our cohort, all inoperable hepatic metastasis underwent biopsy, which may account for a lower PSMA expression in biopsied tissues. It appears that several adverse pathological and clinical features are associated with a lower PSMA expression in hepatic metastasis, as it is the case in primary CRCs [10]. One possible explanation for this pattern is that PSMA regulation may be site- (primary versus metastatic) or tumor-dependent. Endothelial cells from different anatomic locations exhibit considerable differences in gene expression profiles [34]. Furthermore, studies comparing benign and tumor-associated vasculature found that most differentially regulated genes were organ- or stage-specific [35,36]. Thus, although PSMA is widely expressed in the neovasculature of non-prostatic cancers, its regulatory mechanism in CRC and its hepatic metastases may differ from that in other cancers, potentially reflecting variations in the tumor microenvironment. This notion is supported by an animal study showing that protein expression profiles in the tumor vasculature of pancreatic islet tumor cells differed by anatomic sites (orthotopic vs. heterotopic), highlighting the influence of the tumor microenvironment on endothelial cell phenotypes [37].
- To evaluate the effect of treatment status and timing of metastasis in PSMA expression, we performed a subgroup analysis (Fig. 1). The impact of chemotherapy on PSMA expression is yet to be investigated in detail. In a study of serous epithelial ovarian carcinoma, there was no change in PSMA expression between pre- and post-chemotherapy samples, although PSMA staining was nearly absent in their cohort [38]. In our previous analysis of rectal adenocarcinoma, the chemoradiotherapy-treated subgroup exhibited lower PSMA expression compared to the untreated subgroup [10]. However, in hepatic metastasis, no significant difference in PSMA expression was observed between chemotherapy-treated and untreated subgroups. It appears that the impact of chemotherapy on PSMA expression is dependent on tumor type, location, setting (primary vs. metastasis), and possibly the treatment regimen, warranting further investigations.
- In the untreated subgroup, clinicopathological features of primary CRC previously linked to lower PSMA expression in the hepatic metastasis in the entire cohort-such as higher primary CRC grade, advanced pTNM stage, presence of tumor deposit, biopsied hepatic lesions, and inoperable hepatic lesions-remained significantly associated. However, none of the aforementioned features showed a significant association with PSMA expression in hepatic metastasis from the treated subgroup. Although older patients showed higher PSMA expression in the treated subgroup, due to a small number of cases (n = 9), we cannot confirm the clinical significance of this observation or hypothesize the pathophysiologic mechanism behind it. However, a marginal association with higher primary CRC grade and lower PSMA scores (p = .055) was still observed in the treated subgroup. This raises the possibility that the association between adverse pathological features and lower PSMA expression persists to a certain extent in treated subgroup, as they are in the entire cohort and untreated subgroup.
- When stratified by the timing of metastasis, concurrent metastasis subgroup with the above adverse prognostic features exhibited a lower PSMA expression in hepatic metastasis. However, in metachronous metastasis subgroup, no such association was observed. In addition, in the same subgroup with metachronous metastasis, no association between pTNM stage at the time of primary CRC resection and PSMA expression in hepatic metastasis was observed (p = .615, τ = –0.112). A similar trend was found when concurrent and untreated subgroup versus treated and/or metachronous subgroup were compared.
- These findings suggest that PSMA expression profiles differ between concurrent and untreated cases versus metachronous and/or treated cases. Concurrent metastasis cases presented with hepatic lesions at the time of CRC resection, whereas metachronous cases developed metastasis later. This time lag between CRC resection and the development of hepatic lesions may alter the relationship between PSMA expression in metastasis and the clinicopathological features of the primary CRC. In other words, PSMA expression in metachronous hepatic metastasis may no longer reflect the tumor biology of primary (previous) CRC. Likewise, treatment status is likely to influence PSMA expression in hepatic metastasis, similar to our observation in treated rectal cancer [10].
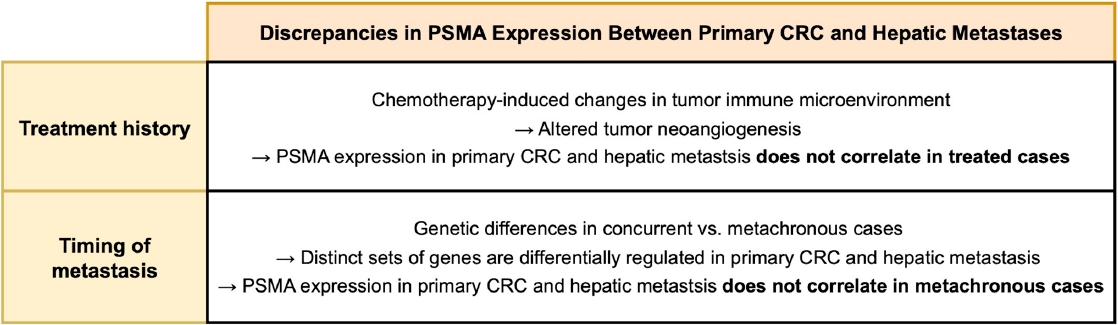
- In our entire cohort, the PSMA expression in hepatic metastasis exhibited a positive correlation with that of primary CRC. This finding suggests that PSMA expression in primary CRC specimen may be used to estimate that in hepatic metastasis. However, these correlations remained significant only in concurrent and untreated subgroup, but not in metachronous and/or treated subgroup, indicating that the time interval and treatment history influence PSMA expression in hepatic metastasis. A recent study compared the gene mutation profiles of synchronous and metachronous hepatic metastases with their corresponding primary CRCs [39]. Primary CRCs giving rise to concurrent metastases harbored a distinct set of mutations compared with those leading to metachronous metastases. Likewise, the mutational landscapes of hepatic metastases differed by metastasis timing. Notably, when mutation profiles were compared between primary CRCs and paired hepatic metastases from the same individual, the genes showing the greatest discrepancies varied according to the timing of metastasis. These findings indicate that primary CRCs leading to concurrent versus metachronous metastases are biologically distinct, which could account for observed differences in the association of PSMA expression between primary CRC and hepatic metastases by the timing of metastasis. Regarding treatment history, it is possible that chemotherapy-induced alterations in tumor microenvironment could be the cause of the observed discrepancy. Neoadjuvant chemotherapy induces various stromal histologic changes across multiple cancers, including CRC hepatic metastases [40-42]. Additionally, chemotherapeutic agent modifies tumor immune microenvironment [43,44], which contributes to tumor neoangiogenesis [45,46] and is associated with intratumoral PSMA expression [47]. A schematic diagram outlining how chemotherapy and metastasis timing may influence the association of PSMA expression between primary CRC and metastatic lesions is shown in Fig. 4.
- Haffner et al. [8] reported among 11 cases with both primary CRC and nodal/hepatic metastasis available, eight pairs (73%) showed identical PSMA staining patterns and scores. Treatment history and the timing of metastasis were not provided in their manuscript and their scoring system involved staining extent and intensity, while the PSMA/CD34 ratio in our study is based on the staining extent. Despite the differences in scoring methods, their findings align with our results for entire cohort, as well as concurrent and untreated subgroup. A lack of such association in metachronous and/or treated subgroup is possibly due to altered PSMA expression in these cases related to progression of the disease (time lag) or treatment. Alternatively, it is also possible that the previous study did not include treated patients.
- In our study, PSMA expression in hepatic metastasis, regardless of treatment history and timing of metastasis, was not markedly different from HCC. This suggests that hepatic metastasis is expected to sequester PSMA-targeted radiotracer to a similar extent as HCC does, making PSMA-PET/CT a potential option in detecting hepatic metastasis. Preliminary studies in HCC demonstrated that PSMA-PET/CT can detect primary and metastatic HCC [19,48,49], and the degree of tracer uptake tends to correlate with PSMA IHC [19]. Given that some adverse features of CRC are associated with lower PSMA levels in hepatic metastasis, PSMA-targeted modalities might be more useful for patients with seemingly less aggressive CRC with occult metastasis.
- However, it is worthy of noting that PSMA expression is generally lower in non-prostatic cancers, potentially complicating imaging [50]. Indeed, Cuda et al. [51] argued that liver metastasis in CRC patients does not avidly sequester PSMA-targeted radiotracer, limiting the utility of PSMA-based therapy in such patients. However, a small number of patients (n = 10) were enrolled for PSMA-targeted imaging, and neither resected tumors nor their IHC data were available in their 10 patients. Thus, we believe that the clinical utility of PSMA-directed imaging in metastatic CRC should be validated in a larger cohort with corresponding IHC results obtained using a standardized protocol. Also, intratumoral staining heterogeneity needs to be addressed and assessed in a systematic manner to validate the clinical applicability of this tool, given that metastatic lesions will likely be biopsied for biomarker testing.
- There are several limitations in this study. Non-prostate cancers may show heterogenous PSMA expression within a single specimen [5,52], thus small biopsies of hepatic metastasis could be subjected to sampling error. However, we used Tru-cut/wedge biopsies or resected specimens, rather than thin image-guided biopsies, to mitigate this limitation. In addition, relatively small cohort size, especially the treated subgroup (n = 9), may account for the limited statistical power. Thirdly, methods for more precise quantification of PSMA IHC results, such as double staining techniques or digital pathology modalities, were not available due to limited resources. Similarly, the IHC slides were reviewed by one author; thus, potential interobserver variability could not be addressed.
- To the best of our knowledge, this is the first study to systematically analyze the association of the PSMA expression and clinicopathological attributes in metastatic CRC cohort, with clearly defined tissue acquisition methods, metastatic site (all liver), and treatment history. Lower PSMA expression in hepatic metastasis is associated with several adverse features of the primary CRC. PSMA expression in hepatic metastasis correlates with that of the primary CRC, only in concurrent and untreated metastasis. Regardless of treatment history or timing of metastasis, PSMA expression in hepatic metastasis is similar to that in primary HCC. Further research is needed to evaluate the clinical potential of PSMA-targeted modalities in hepatic CRC metastasis.
DISCUSSION
Supplementary Information
Ethics Statement
The study was conducted according to the guidelines of the Declaration of Helsinki and approved by the Institutional Review Board at Albany Medical College (protocol #5718, Approval date 06/18/2020) with a waiver of informed patient consent. Patient consent was waived as IRB granted a waiver of patient consent, determining that the study qualified as secondary research for which patient consent is not required.
Availability of Data and Material
The data that support the findings of this study are available from the corresponding author upon reasonable request.
Code Availability
Not applicable.
Author Contributions
Conceptualization: HL. Data acquisition and analysis: EP, MK, XW, HQ, NBS, MG, HL. Writing—original draft: EP. Writing—review & editing: MK, XW, HQ, CGF, MPT, NBS, MG, HL. Approval of final manuscript: all authors.
Conflicts of Interest
The authors declare that they have no potential conflicts of interest.
Funding
No funding to declare.
Acknowledgments
We thank Ms. Rebecca Pirri and Dr. Timothy Jennings for their support.


| Clinical characteristic | All patients (n = 56) | Previously untreated patients (n = 47) | Chemotherapy-treated patients (n = 9) | p-value (previously untreated patients vs. chemotherapy treated patients) |
|---|---|---|---|---|
| Demographics | ||||
| Sex | ||||
| Female | 28 (50.0) | 22 (46.8) | 6 (66.7) | .469 |
| Male | 28 (50.0) | 25 (53.2) | 3 (33.3) | |
| Age (yr) | ||||
| Median (range) | 59 (40–87) | 59 (40–87) | 65 (50–75) | .173 |
| Mean | 59.5 | 58.8 | 63.0 | |
| Treatment status | ||||
| Untreated | 47 (83.9) | NA | NA | NA |
| Treated | 9 (16.1) | |||
| Primary CRC characteristics | ||||
| Primary CRC size (cm) | ||||
| Median (range) | 4.5 (1.4–13.5) | 4.5 (1.4–13.5) | 4.5 (3.0–9.0) | .858 |
| Mean | 5.2 | 5.2 | 4.9 | |
| Locationa | ||||
| Right | 26 (46.4) | 21 (44.7) | 5 (55.6) | .875 |
| Left | 5 (8.9) | 5 (10.6) | 0 | |
| Rectum | 25 (44.6) | 21 (44.7) | 4 (44.4) | |
| Gradea | ||||
| 1 | 2 (3.6) | 2 (4.3) | 0 | .584 |
| 2 | 44 (78.6) | 37 (78.7) | 7 (77.8) | |
| 3 | 10 (17.9) | 8 (17.0) | 2 (22.2) | |
| pT category | ||||
| 2 | 3 (5.4) | 2 (4.3) | 1 (11.1) | .386 |
| 3 | 35 (62.5) | 29 (61.7) | 6 (66.7) | |
| 4 | 18 (32.1) | 16 (34.0) | 2 (22.2) | |
| pN category | ||||
| 0 | 10 (17.9) | 9 (19.1) | 1 (11.1) | .951 |
| 1 | 18 (32.1) | 14 (29.8) | 4 (44.4) | |
| 2 | 28 (50.0) | 24 (51.1) | 4 (44.4) | |
| pTNM stage | ||||
| I | 1 (1.8) | 1 (2.1) | 0 | .686 |
| II | 2 (3.6) | 2 (4.3) | 0 | |
| III | 12 (21.4) | 10 (21.3) | 2 (22.2) | |
| IV | 41 (73.2) | 34 (72.3) | 7 (77.8) | |
| Tumor deposit | ||||
| Absent | 18 (32.1) | 16 (34.0) | 2 (22.2) | .703 |
| Present | 38 (67.9) | 31 (66.0) | 7 (77.8) | |
| Lymphovascular invasion | ||||
| Absent | 19 (33.9) | 15 (31.9) | 4 (44.4) | .470 |
| Present | 37 (66.1) | 32 (68.1) | 5 (55.6) | |
| Perineural invasion | ||||
| Absent | 29 (51.8) | 27 (57.4) | 2 (22.2) | .073 |
| Present | 27 (48.2) | 20 (42.6) | 7 (77.8) | |
| Primary CRC margin | ||||
| Negative | 50 (89.3) | 45 (95.7) | 5 (55.6) | .004 |
| Positive | 6 (10.7) | 2 (4.3) | 4 (44.4) | |
| Tumor-stroma ratio | ||||
| Stroma low | 18 (32.1) | 14 (29.8) | 4 (44.4) | .448 |
| Stroma high | 38 (67.9) | 33 (70.2) | 5 (55.6) | |
| Precursor lesion | ||||
| Absent | 36 (64.3) | 31 (66.0) | 5 (55.6) | .707 |
| Present | 20 (35.7) | 16 (34.0) | 4 (44.4) | |
| Tumor budding score | ||||
| 1 | 29 (51.8) | 26 (55.3) | 3 (33.3) | .058 |
| 2 | 15 (26.8) | 14 (29.8) | 1 (11.1) | |
| 3 | 12 (21.4) | 7 (14.9) | 5 (55.6) | |
| No. of tumor buds | ||||
| Median (range) | 4 (0–23) | 3 (0–17) | 11 (0–23) | .072 |
| Mean | 5.8 | 4.9 | 10.4 | |
| No. of positive lymph nodes | ||||
| Median (range) | 3.5 (0–13) | 4 (0–13) | 2 (0–9) | .777 |
| Mean | 3.4 | 3.5 | 3.0 | |
| No. of tumor deposits | ||||
| Median (range) | 2 (0–13) | 2 (0–13) | 2 (0–5) | .891 |
| Mean | 2.71 | 2.9 | 2.0 | |
| Hepatic metastasis characteristics | ||||
| No. of hepatic metastasis | ||||
| Single | 27 (48.2) | 21 (44.7) | 4 (44.4) | >.99 |
| Multiple | 25 (44.6) | 22 (46.8) | 5 (55.6) | |
| Hepatic metastasis size (cm) | NA = 4 | NA = 4 | ||
| Median (range) | 2.9 (0.6–22.5) | 2.7 (0.6–22.5) | 3.2 (1–8) | .513 |
| Mean | 3.5 | 3.5 | 3.6 | |
| Tissue acquisition method | ||||
| Biopsy | 23 (41.1) | 23 (48.9) | 0 | .007 |
| Resection | 33 (58.9) | 24 (51.1) | 9 (100) | |
| Operability | ||||
| Operable | 34 (60.7) | 25 (53.2) | 9 (100) | .008 |
| Inoperable | 22 (39.3) | 22 (46.8) | 0 | |
| Tissue acquisition time | ||||
| Synchronous | 41 (73.2) | 34 (72.3) | 7 (77.8) | >.99 |
| Asynchronous | 15 (26.8) | 13 (27.7) | 2 (22.2) |
| PSMA/CD34 ratio | All patients (n = 56) | Previously untreated patients (n = 47) | Chemotherapy-treated patients (n = 9) | Concurrent metastasis (n = 41) | Metachronous metastasis (n = 15) | Untreated and concurrent metastasis (n = 34) | Treated and/or metachronous metastasis (n = 22) |
|---|---|---|---|---|---|---|---|
| Primary CRC | NA = 1 | NA = 1 | NA = 1 | NA = 1 | |||
| Mean | 27.1 | 27.8 | 23.8 | 27.9 | 25.1 | 28.5 | 25 |
| Median (range) | 20.0 (0–85.0)a | 20.0 (0–85.0)a | 15.0 (2.0–70.0) | 17.5 (0–85.0)a | 20.0 (0–80.0) | 20 (0–85.0)a | 20 (0–80.0) |
| Hepatic metastasis | |||||||
| Mean | 29.2 | 29.0 | 30.2 | 24.2 | 43.1 | 24.4 | 36.7 |
| Median (range) | 20.0 (0–95.0) | 20.0 (0–95.0) | 20.0 (0–80.0) | 10.0 (0–90.0) | 40.0 (2–95.0) | 10.0 (0–90.0) | 27.5 (0–95.0) |
| Clinical characteristic | PSMA/CD34 ratio | ||||||||
|---|---|---|---|---|---|---|---|---|---|
| All patients (n = 56) | Previously untreated patients (n = 47) | Chemotherapy-treated patients (n = 9) | |||||||
| Mean | Median (range) | p-value | Mean | Median (range) | p-value | Mean | Median (range) | p-value | |
| Demographics | |||||||||
| Sex | |||||||||
| Male | 32.7 | 20 (0–95) | .478 | 31.4 | 20 (0–95) | .746 | 43.3 | 30 (20–80) | .214 |
| Female | 25.8 | 12.5 (0–80) | 26.3 | 15 (2–80) | 23.7 | 12.5 (0–80) | |||
| Age | .568 (τ = –0.055) | .140 (τ = –0.157) | .035 (τ = 0.572) | ||||||
| Treatment status | .653 | NA | NA | ||||||
| Untreated | 29.0 | 20 (0–95) | 29.0 | 20 (0–95) | |||||
| Treated | 30.2 | 20 (0–80) | 30.2 | 20 (0–80) | |||||
| Primary CRC characteristics | |||||||||
| Primary CRC size (cm) | .314 (τ = 0.097) | .329 (τ = 0.104) | .596 (τ = 0.145) | ||||||
| Location | .287 | 0.460 | .323a | ||||||
| Right | 21.0 | 12.5 (0–80) | 20.2 | 10 (2–80) | 24.4 | 15 (0–80) | |||
| Left | 39.6 | 50 (0–80) | 39.6 | 50 (0–80) | |||||
| Rectum | 35.7 | 25 (0–95) | 35.3 | 20 (0–95) | 37.5 | 30 (10–80) | |||
| Grade | .005 (τ = –0.318) | .032 (τ = –0.267) | (Grade 2 vs. 3) .055b | ||||||
| 1 | 2.0 | 2 (2–2) | 2.0 | 2 (2–2) | |||||
| 2 | 36.3 | 20 (0–95) | 36.0 | 20 (0–95) | 37.9 | 30 (10–80) | |||
| 3 | 3.4 | 2 (0–10) | 3.4 | 2 (0–10) | 3.5 | 3.5 (0–7) | |||
| pT category | .170 (τ = –0.155) | .103 (τ = –0.203) | .702 (τ = 0.115) | ||||||
| 2 | 61.7 | 75 (20–90) | 82.5 | 82.5 (75–90) | 20.0 | 20 (20–20) | |||
| 3 | 29.4 | 20 (0–95) | 29.9 | 20 (0–95) | 27.0 | 22.5 (0–80) | |||
| 4 | 23.5 | 12.5 (0–80) | 20.8 | 12.5 (0–70) | 45.0 | 45 (10–80) | |||
| pN category | .579 (τ = –0.061) | .791 (τ = –0.032) | .559 (τ = –0.175) | ||||||
| 0 | 44.0 | 32.5 (2–90) | 46.7 | 40 (2–90) | 20.0 | 20 (20–20) | |||
| 1 | 18.9 | 8.5 (0–90) | 13.9 | 4.5 (0–90) | 36.8 | 30 (7–80) | |||
| 2 | 30.5 | 17.5 (0–95) | 31.2 | 20 (0–95) | 26.2 | 12.5 (0–80) | |||
| pTNM stage at time of CRC resection | .020 (τ = –0.262) | .048 (τ = –0.244) | .184c | ||||||
| 1 | 75.0 | 75 (75–75) | 75.0 | 75 (75–75) | |||||
| 2 | 32.5 | 32.5 (25–40) | 32.5 | 32.5 (25–40) | |||||
| 3 | 42.2 | 35 (2–95) | 39.6 | 30 (2–95) | 55.0 | 55 (30–80) | |||
| 4 | 24.1 | 10 (0–90) | 24.4 | 10 (0–90) | 23.1 | 15 (0–80) | |||
| Tumor deposit | .037 | .036 | .639 | ||||||
| Absent | 40.9 | 27.5 (2–95) | 42.9 | 32.5 (2–95) | 25.0 | 25 (20–30) | |||
| Present | 23.7 | 10 (0–80) | 21.8 | 10 (0–80) | 31.7 | 15 (0–80) | |||
| Lymphovascular invasion | .351 | .755 | .138 | ||||||
| Absent | 33.3 | 20 (2–95) | 31.5 | 20 (2–95) | 40.0 | 30 (20–80) | |||
| Present | 27.1 | 15 (0–90) | 27.8 | 17.5 (0–90) | 22.4 | 10 (0–80) | |||
| Perineural invasion | .433 | .174 | .555 | ||||||
| Absent | 32.1 | 20 (0–95) | 33.4 | 20 (2–95) | 15.0 | 15 (0–30) | |||
| Present | 26.1 | 10 (0–90) | 23.1 | 9 (0–90) | 34.6 | 20 (7–80) | |||
| Primary CRC margin | .894 | >.99 | .805 | ||||||
| Negative | 29.8 | 20 (0–95) | 29.6 | 20 (0–95) | 31.0 | 30 (0–80) | |||
| Positive | 24.5 | 15 (7–80) | 15.0 | 15 (10–20) | 29.2 | 15 (7–80) | |||
| Tumor-stroma ratio | .219 | .241 | .138 | ||||||
| Stroma high | 25.3 | 12.5 (0–90) | 25.8 | 15 (0–90) | 22.4 | 10 (0–80) | |||
| Stroma low | 37.4 | 25 (0–95) | 36.6 | 20 (0–95) | 40.0 | 30 (20–80) | |||
| Precursor lesion | .335 | .126 | .387 | ||||||
| Absent | 34.1 | 20 (0–95) | 35.5 | 20 (0–95) | 25.4 | 10 (0–80) | |||
| Present | 20.4 | 17.5 (0–80) | 16.4 | 12.5 (0–80) | 36.2 | 25 (15–80) | |||
| Tumor budding score | .298 (τ = –0.114) | .435 (τ = –0.095) | .404 (τ = –0.250) | ||||||
| 1 | 34.3 | 20 (0–90) | 33.2 | 20 (0–90) | 43.3 | 30 (20–80) | |||
| 2 | 28.1 | 20 (2–95) | 29.6 | 20 (2–95) | 7.0 | 7 (7–7) | |||
| 3 | 18.3 | 10 (0–80) | 12.1 | 8 (2–30) | 27.0 | 15 (0–80) | |||
| No. of tumor buds | .655 (τ = –0.044) | .866 (τ = –0.018) | .523 (τ = –0.176) | ||||||
| No. of positive lymph nodes | .491 (τ = –0.069) | .727 (τ = –0.039) | .335 (τ = –0.269) | ||||||
| No. of tumor deposits | .117 (τ = –0.159) | .110 (τ = –0.178 | .915 (τ = –0.030) | ||||||
- 1. Horoszewicz JS, Leong SS, Kawinski E, et al. LNCaP model of human prostatic carcinoma. Cancer Res 1983; 43: 1809-18. PubMed
- 2. Silver DA, Pellicer I, Fair WR, Heston WD, Cordon-Cardo C. Prostate-specific membrane antigen expression in normal and malignant human tissues. Clin Cancer Res 1997; 3: 81-5. PubMed
- 3. Sartor O, de Bono J, Chi KN, et al. Lutetium-177-PSMA-617 for metastatic castration-resistant prostate cancer. N Engl J Med 2021; 385: 1091-103. ArticlePubMedPMC
- 4. Chang SS, O'Keefe DS, Bacich DJ, Reuter VE, Heston WD, Gaudin PB. Prostate-specific membrane antigen is produced in tumor-associated neovasculature. Clin Cancer Res 1999; 5: 2674-81. PubMed
- 5. Kmeid M, Park YN, Chung T, et al. PSMA Immunohistochemistry in hepatic neoplasms: a promising diagnostic marker with potential theranostic applications. Am J Surg Pathol 2022; 46: 1688-99. ArticlePubMed
- 6. Chen LX, Zou SJ, Li D, et al. Prostate-specific membrane antigen expression in hepatocellular carcinoma, cholangiocarcinoma, and liver cirrhosis. World J Gastroenterol 2020; 26: 7664-78. ArticlePubMedPMC
- 7. Jiao D, Li Y, Yang F, et al. Expression of prostate-specific membrane antigen in tumor-associated vasculature predicts poor prognosis in hepatocellular carcinoma. Clin Transl Gastroenterol 2019; 10: 1-7. ArticlePubMedPMC
- 8. Haffner MC, Kronberger IE, Ross JS, et al. Prostate-specific membrane antigen expression in the neovasculature of gastric and colorectal cancers. Hum Pathol 2009; 40: 1754-61. ArticlePubMed
- 9. Abdel-Hadi M, Ismail Y, Younis L. Prostate-specific membrane antigen (PSMA) immunoexpression in the neovasculature of colorectal carcinoma in Egyptian patients. Pathol Res Pract 2014; 210: 759-63. ArticlePubMed
- 10. Park E, Wang X, Kmeid M, et al. Prostate-specific membrane antigen expression in colorectal cancer and its potential implication in disease monitoring in rectal cancer. J Gastrointest Cancer 2025; 56: 159.ArticlePubMedPDF
- 11. Backhaus P, Noto B, Avramovic N, et al. Targeting PSMA by radioligands in non-prostate disease-current status and future perspectives. Eur J Nucl Med Mol Imaging 2018; 45: 860-77. ArticlePubMedPDF
- 12. Kuyumcu S, Has-Simsek D, Iliaz R, et al. Evidence of prostate-specific membrane antigen expression in hepatocellular carcinoma using 68Ga-PSMA PET/CT. Clin Nucl Med 2019; 44: 702-6. ArticlePubMed
- 13. Kesler M, Levine C, Hershkovitz D, et al. (68)Ga-PSMA is a novel PET-CT tracer for imaging of hepatocellular carcinoma: a prospective pilot study. J Nucl Med 2019; 60: 185-91. ArticlePubMed
- 14. Arcay A, Eiber M, Langbein T. Incidental finding of colon carcinoma related to high uptake in 18F-PSMA-1007 PET. Clin Nucl Med 2020; 45: 561-2. ArticlePubMed
- 15. Aras O, Demirdag C, Kommidi H, Ting R, Sayman HB. Radiopharmaceutical for detecting PSMA-positive metastatic colon cancer: matched-pair comparison of 18F-BF3-Cy3-ACUPA and 68Ga-PSMA PET/MRI. Nucl Med Rev Cent East Eur 2022; 25: 129-30. ArticlePubMedPMC
- 16. Hangaard L, Jochumsen MR, Vendelbo MH, Bouchelouche K. Metastases from colorectal cancer Avid on 68Ga-PSMA PET/CT. Clin Nucl Med 2017; 42: 532-3. ArticlePubMed
- 17. Doroudinia A, Chekuri S. 68 Ga-PSMA-Avid liver metastases from colon cancer, not visualized on FDG PET scan. Clin Nucl Med 2023; 48: e547-8. ArticlePubMed
- 18. Woythal N, Arsenic R, Kempkensteffen C, et al. Immunohistochemical validation of PSMA expression measured by (68)Ga-PSMA PET/CT in primary prostate cancer. J Nucl Med 2018; 59: 238-43. ArticlePubMed
- 19. Thompson SM, Suman G, Torbenson MS, et al. PSMA as a theranostic target in hepatocellular carcinoma: immunohistochemistry and (68) Ga-PSMA-11 PET using cyclotron-produced (68) Ga. Hepatol Commun 2022; 6: 1172-85. ArticlePubMedPMCPDF
- 20. Hess KR, Varadhachary GR, Taylor SH, et al. Metastatic patterns in adenocarcinoma. Cancer 2006; 106: 1624-33. ArticlePubMed
- 21. Leufkens AM, van den Bosch MA, van Leeuwen MS, Siersema PD. Diagnostic accuracy of computed tomography for colon cancer staging: a systematic review. Scand J Gastroenterol 2011; 46: 887-94. ArticlePubMed
- 22. Tsilimigras DI, Brodt P, Clavien PA, et al. Liver metastases. Nat Rev Dis Primers 2021; 7: 27.ArticlePubMedPDF
- 23. Moore M, Panjwani S, Mathew R, et al. Well-differentiated thyroid cancer neovasculature expresses prostate-specific membrane antigen: a possible novel therapeutic target. Endocr Pathol 2017; 28: 339-44. ArticlePubMedPDF
- 24. Crowley MJ, Scognamiglio T, Liu YF, et al. Prostate-specific membrane antigen is a potential antiangiogenic target in adrenocortical carcinoma. J Clin Endocrinol Metab 2016; 101: 981-7. ArticlePubMed
- 25. Holzgreve A, Biczok A, Ruf VC, et al. PSMA expression in glioblastoma as a basis for theranostic approaches: a retrospective, correlational panel study including immunohistochemistry, clinical parameters and PET imaging. Front Oncol 2021; 11: 646387.ArticlePubMedPMC
- 26. Tubre T, Hacking S, Alexander A, et al. Prostate-specific membrane antigen expression in meningioma: a promising theranostic target. J Neuropathol Exp Neurol 2022; 81: 1008-17. ArticlePubMedPMCPDF
- 27. Morgantetti G, Ng KL, Samaratunga H, Rhee H, Gobe GC, Wood ST. Prostate specific membrane antigen (PSMA) expression in vena cava tumour thrombi of clear cell renal cell carcinoma suggests a role for PSMA-driven tumour neoangiogenesis. Transl Androl Urol 2019; 8(Suppl 2): S147-55. ArticlePubMedPMC
- 28. Spatz S, Tolkach Y, Jung K, et al. Comprehensive evaluation of prostate specific membrane antigen expression in the vasculature of renal tumors: implications for imaging studies and prognostic role. J Urol 2018; 199: 370-7. ArticlePubMed
- 29. Wernicke AG, Varma S, Greenwood EA, et al. Prostate-specific membrane antigen expression in tumor-associated vasculature of breast cancers. APMIS 2014; 122: 482-9. ArticlePubMed
- 30. Nomura N, Pastorino S, Jiang P, et al. Prostate specific membrane antigen (PSMA) expression in primary gliomas and breast cancer brain metastases. Cancer Cell Int 2014; 14: 26.ArticlePubMedPMCPDF
- 31. Wang HL, Wang SS, Song WH, et al. Expression of prostate-specific membrane antigen in lung cancer cells and tumor neovasculature endothelial cells and its clinical significance. PLoS One 2015; 10: e0125924. ArticlePubMedPMC
- 32. Basnet S, Lou QF, Liu N, et al. Tumor deposit is an independent prognostic indicator in patients who underwent radical resection for colorectal cancer. J Cancer 2018; 9: 3979-85. ArticlePubMedPMC
- 33. Eng C, Yoshino T, Ruiz-Garcia E, et al. Colorectal cancer. Lancet 2024; 404: 294-310. ArticlePubMed
- 34. Chi JT, Chang HY, Haraldsen G, et al. Endothelial cell diversity revealed by global expression profiling. Proc Natl Acad Sci U S A 2003; 100: 10623-8. ArticlePubMedPMC
- 35. Aird WC. Molecular heterogeneity of tumor endothelium. Cell Tissue Res 2009; 335: 271-81. ArticlePubMedPDF
- 36. Dudley AC. Tumor endothelial cells. Cold Spring Harb Perspect Med 2012; 2: a006536.ArticlePubMedPMC
- 37. Joyce JA, Laakkonen P, Bernasconi M, Bergers G, Ruoslahti E, Hanahan D. Stage-specific vascular markers revealed by phage display in a mouse model of pancreatic islet tumorigenesis. Cancer Cell 2003; 4: 393-403. ArticlePubMed
- 38. Aide N, Poulain L, Elie N, et al. A PSMA-targeted theranostic approach is unlikely to be efficient in serous ovarian cancers. EJNMMI Res 2021; 11: 11.ArticlePubMedPMCPDF
- 39. Rajtmajerova M, Ambrozkiewicz F, Hlavac V, et al. Genetic differences between primary colorectal cancer and its paired synchronous and metachronous metastases. Int J Cancer 2025; 158: 120-30. ArticlePubMedPMC
- 40. Moll UM, Chumas J. Morphologic effects of neoadjuvant chemotherapy in locally advanced breast cancer. Pathol Res Pract 1997; 193: 187-96. ArticlePubMed
- 41. McCluggage WG, Lyness RW, Atkinson RJ, et al. Morphological effects of chemotherapy on ovarian carcinoma. J Clin Pathol 2002; 55: 27-31. ArticlePubMedPMC
- 42. Fernandez-Acenero MJ, Cortes-Guiral D, Munoz LE, Martinez-Useros J, Pastor-Idoate C. Morphological aspects of the hepatic response to neoadjuvant therapy. Pathol Res Pract 2015; 211: 665-70. ArticlePubMed
- 43. Bracci L, Schiavoni G, Sistigu A, Belardelli F. Immune-based mechanisms of cytotoxic chemotherapy: implications for the design of novel and rationale-based combined treatments against cancer. Cell Death Differ 2014; 21: 15-25. ArticlePubMedPMCPDF
- 44. Zitvogel L, Galluzzi L, Smyth MJ, Kroemer G. Mechanism of action of conventional and targeted anticancer therapies: reinstating immunosurveillance. Immunity 2013; 39: 74-88. ArticlePubMed
- 45. Albini A, Bruno A, Noonan DM, Mortara L. Contribution to tumor angiogenesis from innate immune cells within the tumor microenvironment: implications for immunotherapy. Front Immunol 2018; 9: 527.ArticlePubMedPMC
- 46. Fu LQ, Du WL, Cai MH, Yao JY, Zhao YY, Mou XZ. The roles of tumor-associated macrophages in tumor angiogenesis and metastasis. Cell Immunol 2020; 353: 104119.ArticlePubMed
- 47. Park E, Subasi NB, Wang X, et al. CXCR2 expression is associated with prostate-specific membrane antigen expression in hepatocellular carcinoma: reappraisal of tumor microenvironment and angiogenesis. Clin Transl Oncol 2025; 27: 2544-56. ArticlePubMedPDF
- 48. Shamim SA, Kumar N, Arora G, et al. A prospective study of (68)Ga-PSMA PET/CT imaging of HCC as diagnosed on conventional imaging to evaluate for potential (177)Lu-PSMA therapy. Ann Nucl Med 2024; 38: 103-11. ArticlePubMedPDF
- 49. Hirmas N, Leyh C, Sraieb M, et al. (68)Ga-PSMA-11 PET/CT improves tumor detection and impacts management in patients with hepatocellular carcinoma. J Nucl Med 2021; 62: 1235-41. ArticlePubMedPMC
- 50. Wang JH, Kiess AP. PSMA-targeted therapy for non-prostate cancers. Front Oncol 2023; 13: 1220586.ArticlePubMedPMC
- 51. Cuda TJ, Riddell AD, Liu C, et al. PET imaging quantifying (68)Ga-PSMA-11 uptake in metastatic colorectal cancer. J Nucl Med 2020; 61: 1576-9. ArticlePubMed
- 52. Bychkov A, Vutrapongwatana U, Tepmongkol S, Keelawat S. PSMA expression by microvasculature of thyroid tumors: potential implications for PSMA theranostics. Sci Rep 2017; 7: 5202.ArticlePubMedPMCPDF
REFERENCES
Figure & Data
References
Citations
- Incidental detection of PDAC via 18F-PSMA PET/CT in a patient with recurrent prostate cancer. A case report
Giordano Savelli, Mattia Bonacina, Alberto Soffientini, Elvira Archiati, Claudio Bnà, Alberto Zaniboni
Frontiers in Nuclear Medicine.2026;[Epub] CrossRef
 PubReader
 ePub Link
-
 Cite this Article
- Cite this Article
-
- Close
- Download Citation
- Close
- Figure
-

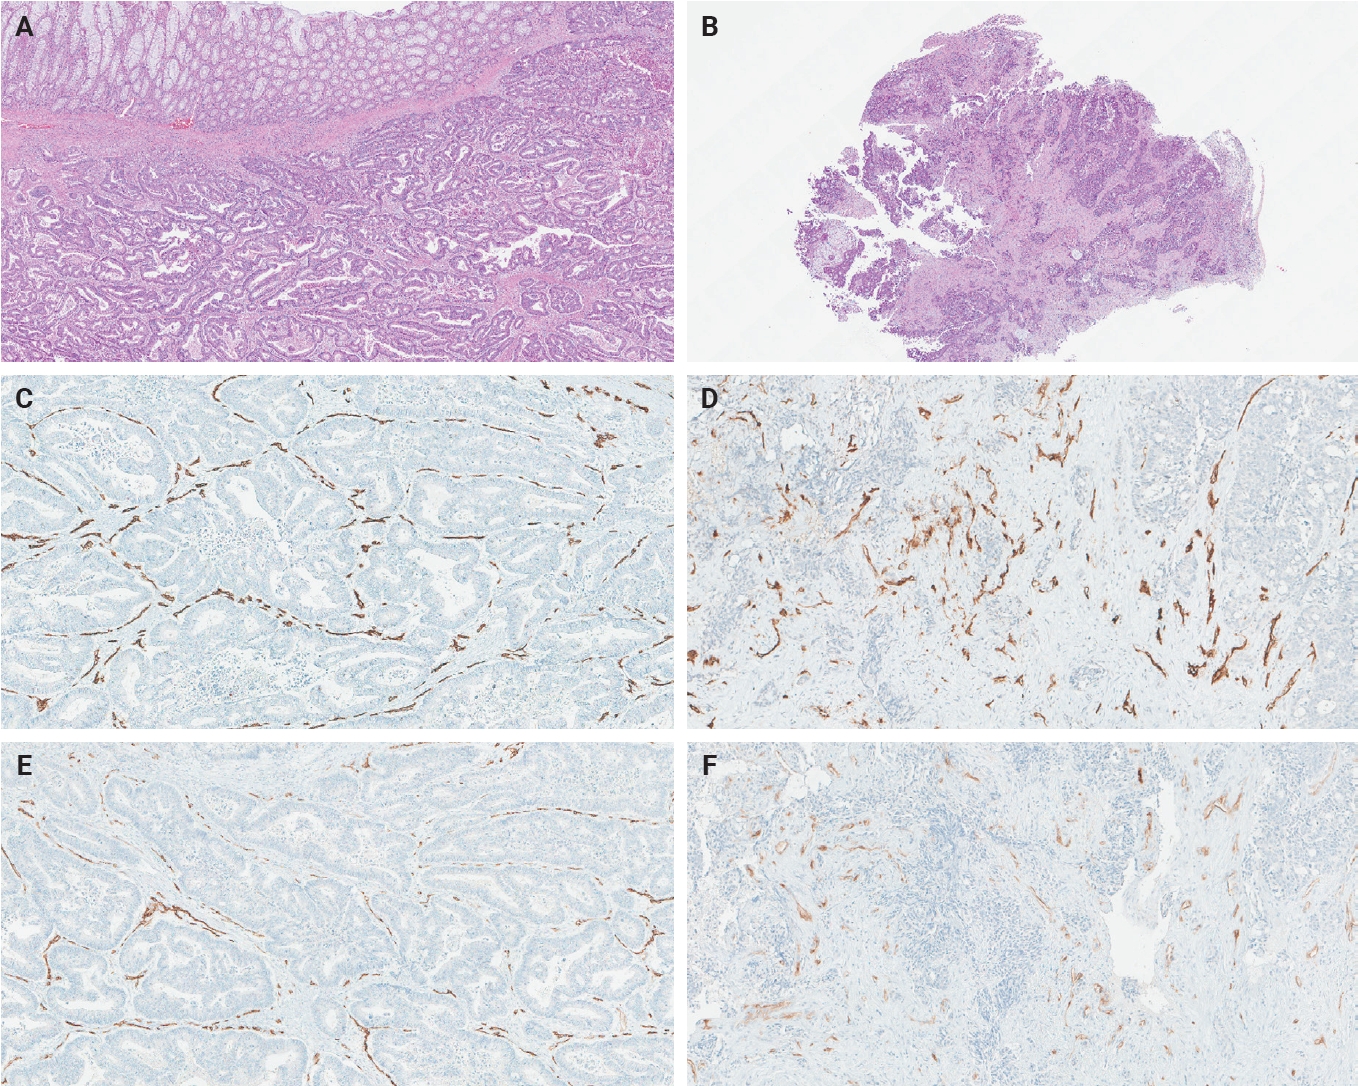
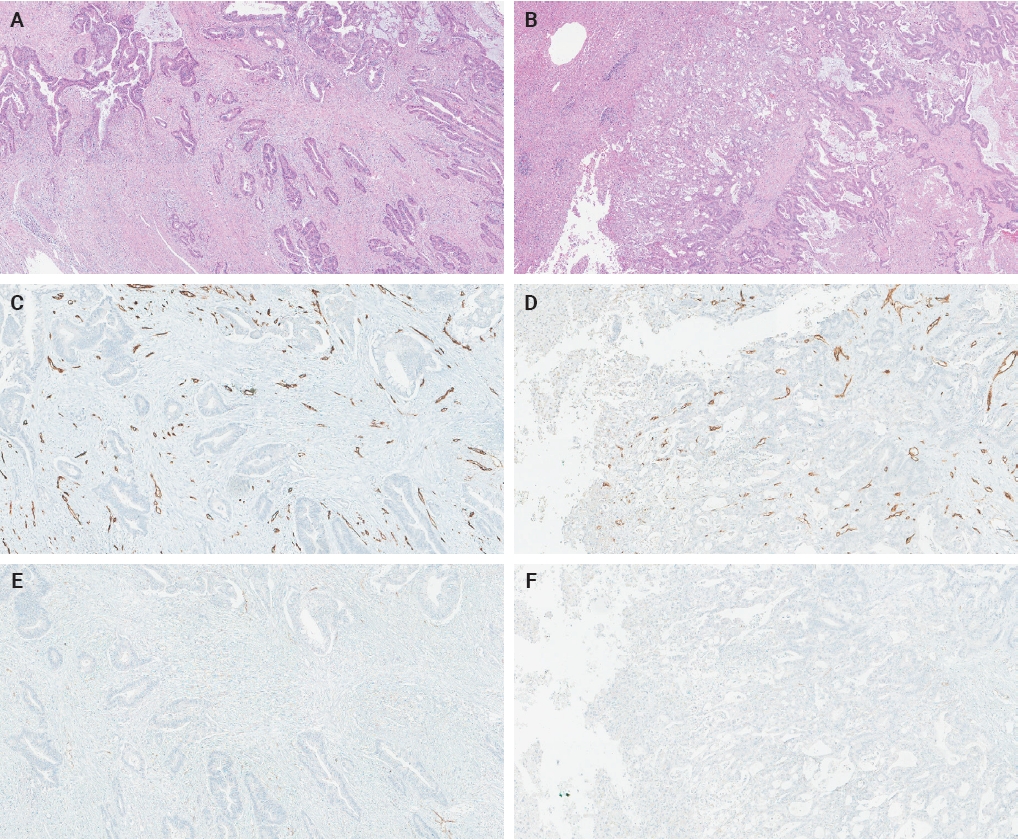


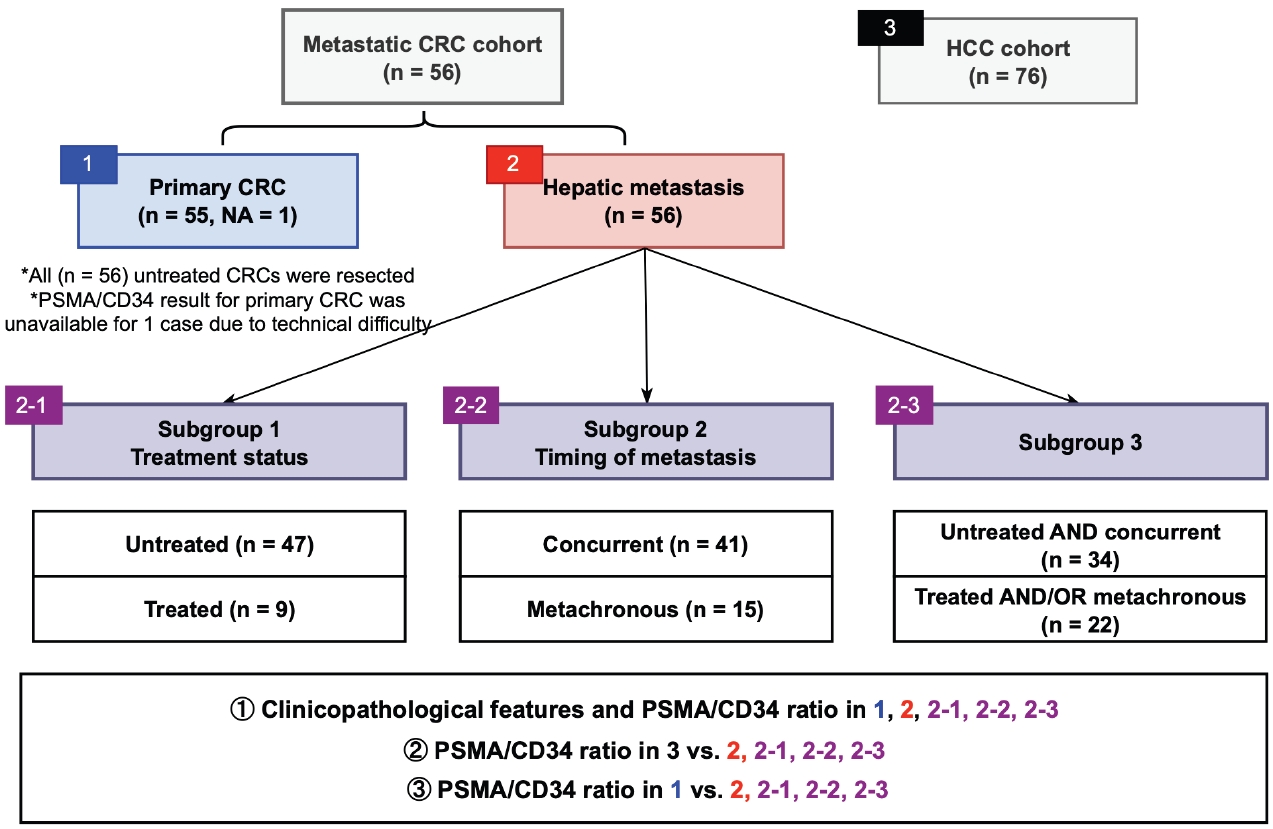


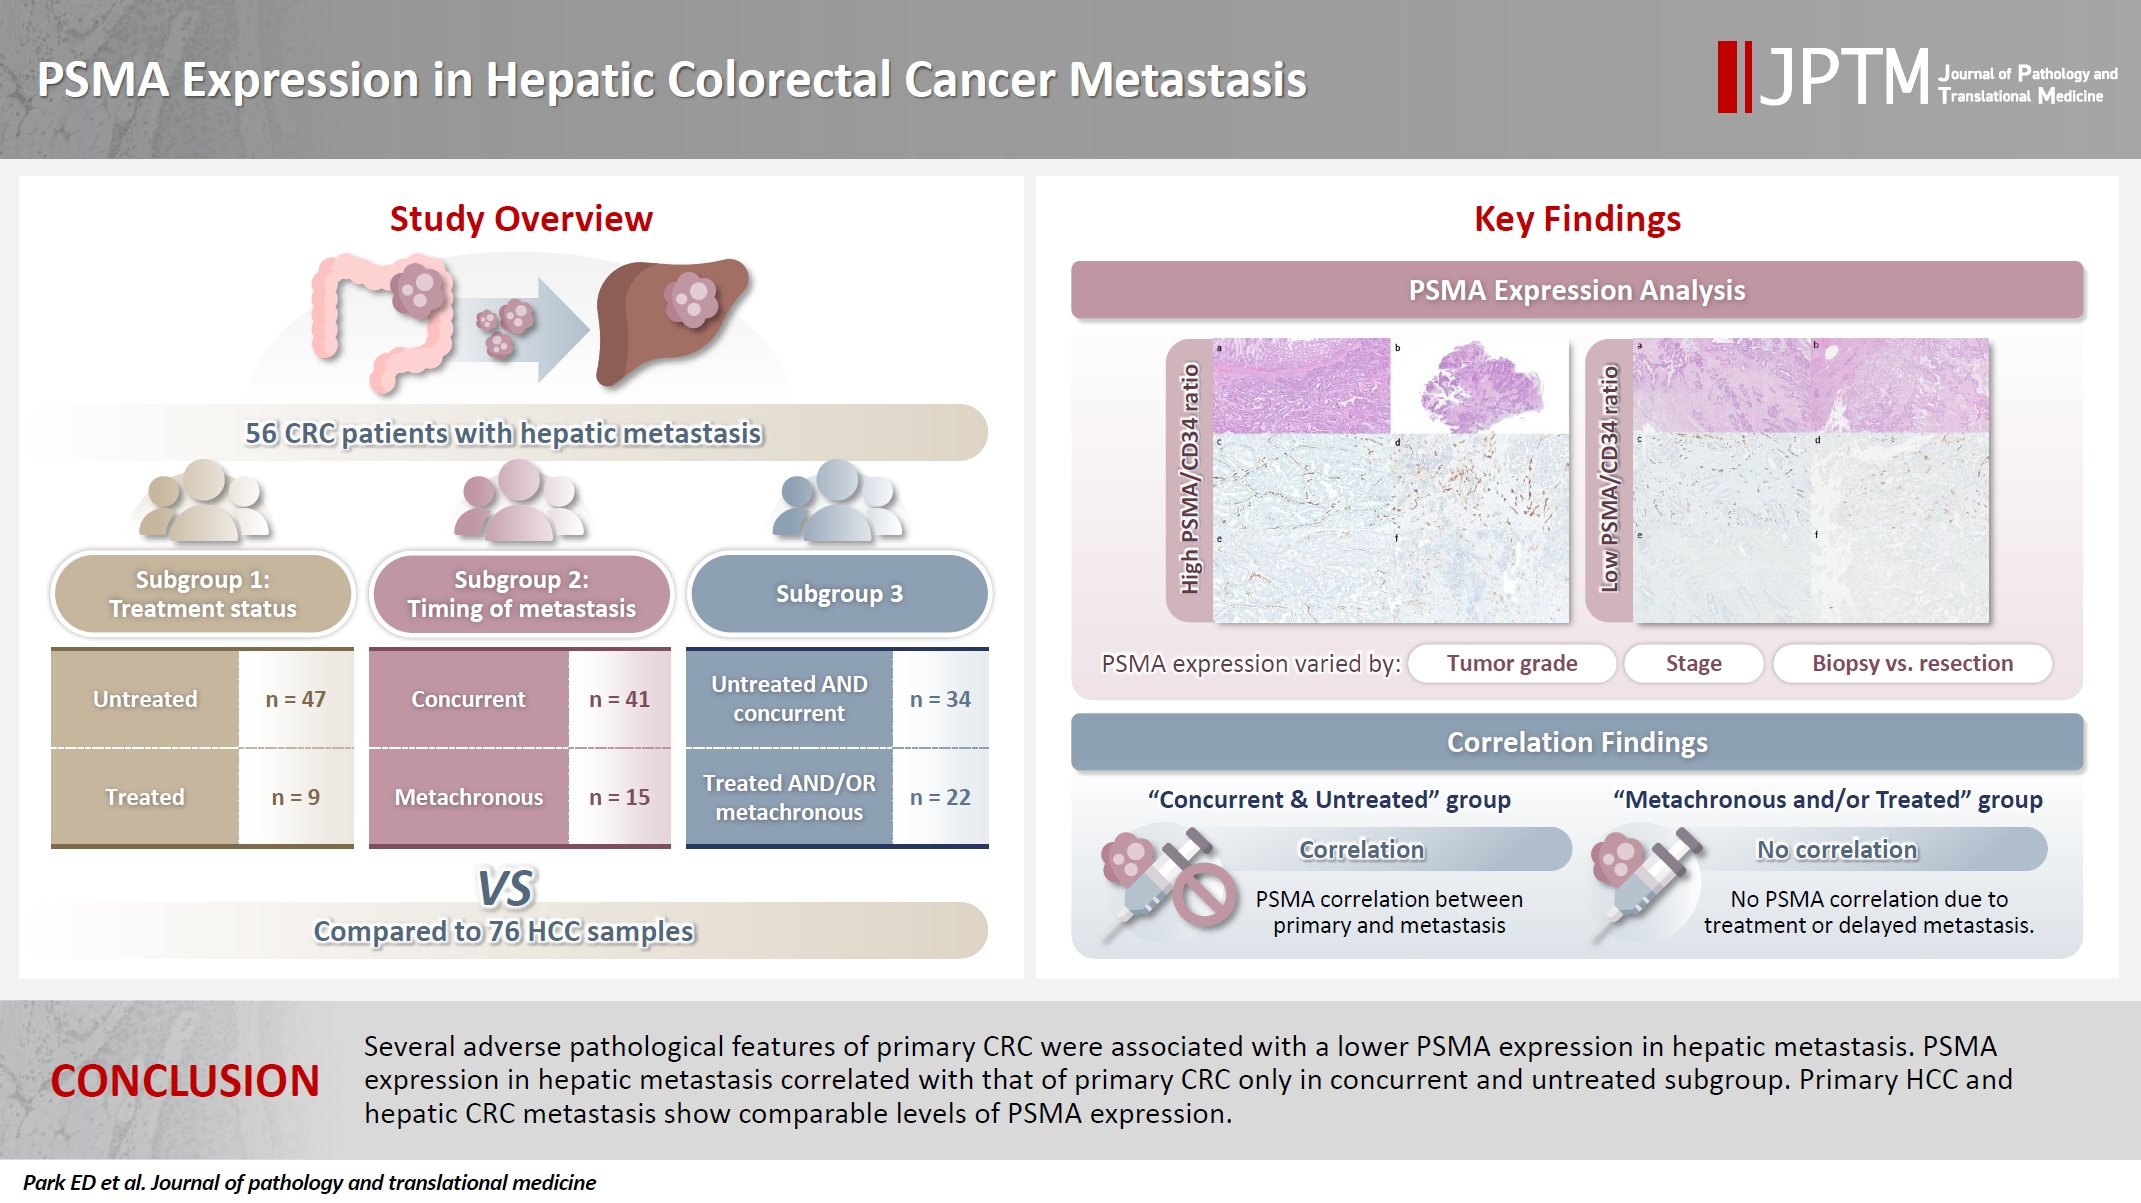
Fig. 1.
Fig. 2.
Fig. 3.
Fig. 4.
Graphical abstract
| Clinical characteristic | All patients (n = 56) | Previously untreated patients (n = 47) | Chemotherapy-treated patients (n = 9) | p-value (previously untreated patients vs. chemotherapy treated patients) |
|---|---|---|---|---|
| Demographics | ||||
| Sex | ||||
| Female | 28 (50.0) | 22 (46.8) | 6 (66.7) | .469 |
| Male | 28 (50.0) | 25 (53.2) | 3 (33.3) | |
| Age (yr) | ||||
| Median (range) | 59 (40–87) | 59 (40–87) | 65 (50–75) | .173 |
| Mean | 59.5 | 58.8 | 63.0 | |
| Treatment status | ||||
| Untreated | 47 (83.9) | NA | NA | NA |
| Treated | 9 (16.1) | |||
| Primary CRC characteristics | ||||
| Primary CRC size (cm) | ||||
| Median (range) | 4.5 (1.4–13.5) | 4.5 (1.4–13.5) | 4.5 (3.0–9.0) | .858 |
| Mean | 5.2 | 5.2 | 4.9 | |
| Location |
||||
| Right | 26 (46.4) | 21 (44.7) | 5 (55.6) | .875 |
| Left | 5 (8.9) | 5 (10.6) | 0 | |
| Rectum | 25 (44.6) | 21 (44.7) | 4 (44.4) | |
| Grade |
||||
| 1 | 2 (3.6) | 2 (4.3) | 0 | .584 |
| 2 | 44 (78.6) | 37 (78.7) | 7 (77.8) | |
| 3 | 10 (17.9) | 8 (17.0) | 2 (22.2) | |
| pT category | ||||
| 2 | 3 (5.4) | 2 (4.3) | 1 (11.1) | .386 |
| 3 | 35 (62.5) | 29 (61.7) | 6 (66.7) | |
| 4 | 18 (32.1) | 16 (34.0) | 2 (22.2) | |
| pN category | ||||
| 0 | 10 (17.9) | 9 (19.1) | 1 (11.1) | .951 |
| 1 | 18 (32.1) | 14 (29.8) | 4 (44.4) | |
| 2 | 28 (50.0) | 24 (51.1) | 4 (44.4) | |
| pTNM stage | ||||
| I | 1 (1.8) | 1 (2.1) | 0 | .686 |
| II | 2 (3.6) | 2 (4.3) | 0 | |
| III | 12 (21.4) | 10 (21.3) | 2 (22.2) | |
| IV | 41 (73.2) | 34 (72.3) | 7 (77.8) | |
| Tumor deposit | ||||
| Absent | 18 (32.1) | 16 (34.0) | 2 (22.2) | .703 |
| Present | 38 (67.9) | 31 (66.0) | 7 (77.8) | |
| Lymphovascular invasion | ||||
| Absent | 19 (33.9) | 15 (31.9) | 4 (44.4) | .470 |
| Present | 37 (66.1) | 32 (68.1) | 5 (55.6) | |
| Perineural invasion | ||||
| Absent | 29 (51.8) | 27 (57.4) | 2 (22.2) | .073 |
| Present | 27 (48.2) | 20 (42.6) | 7 (77.8) | |
| Primary CRC margin | ||||
| Negative | 50 (89.3) | 45 (95.7) | 5 (55.6) | .004 |
| Positive | 6 (10.7) | 2 (4.3) | 4 (44.4) | |
| Tumor-stroma ratio | ||||
| Stroma low | 18 (32.1) | 14 (29.8) | 4 (44.4) | .448 |
| Stroma high | 38 (67.9) | 33 (70.2) | 5 (55.6) | |
| Precursor lesion | ||||
| Absent | 36 (64.3) | 31 (66.0) | 5 (55.6) | .707 |
| Present | 20 (35.7) | 16 (34.0) | 4 (44.4) | |
| Tumor budding score | ||||
| 1 | 29 (51.8) | 26 (55.3) | 3 (33.3) | .058 |
| 2 | 15 (26.8) | 14 (29.8) | 1 (11.1) | |
| 3 | 12 (21.4) | 7 (14.9) | 5 (55.6) | |
| No. of tumor buds | ||||
| Median (range) | 4 (0–23) | 3 (0–17) | 11 (0–23) | .072 |
| Mean | 5.8 | 4.9 | 10.4 | |
| No. of positive lymph nodes | ||||
| Median (range) | 3.5 (0–13) | 4 (0–13) | 2 (0–9) | .777 |
| Mean | 3.4 | 3.5 | 3.0 | |
| No. of tumor deposits | ||||
| Median (range) | 2 (0–13) | 2 (0–13) | 2 (0–5) | .891 |
| Mean | 2.71 | 2.9 | 2.0 | |
| Hepatic metastasis characteristics | ||||
| No. of hepatic metastasis | ||||
| Single | 27 (48.2) | 21 (44.7) | 4 (44.4) | >.99 |
| Multiple | 25 (44.6) | 22 (46.8) | 5 (55.6) | |
| Hepatic metastasis size (cm) | NA = 4 | NA = 4 | ||
| Median (range) | 2.9 (0.6–22.5) | 2.7 (0.6–22.5) | 3.2 (1–8) | .513 |
| Mean | 3.5 | 3.5 | 3.6 | |
| Tissue acquisition method | ||||
| Biopsy | 23 (41.1) | 23 (48.9) | 0 | .007 |
| Resection | 33 (58.9) | 24 (51.1) | 9 (100) | |
| Operability | ||||
| Operable | 34 (60.7) | 25 (53.2) | 9 (100) | .008 |
| Inoperable | 22 (39.3) | 22 (46.8) | 0 | |
| Tissue acquisition time | ||||
| Synchronous | 41 (73.2) | 34 (72.3) | 7 (77.8) | >.99 |
| Asynchronous | 15 (26.8) | 13 (27.7) | 2 (22.2) |
| PSMA/CD34 ratio | All patients (n = 56) | Previously untreated patients (n = 47) | Chemotherapy-treated patients (n = 9) | Concurrent metastasis (n = 41) | Metachronous metastasis (n = 15) | Untreated and concurrent metastasis (n = 34) | Treated and/or metachronous metastasis (n = 22) |
|---|---|---|---|---|---|---|---|
| Primary CRC | NA = 1 | NA = 1 | NA = 1 | NA = 1 | |||
| Mean | 27.1 | 27.8 | 23.8 | 27.9 | 25.1 | 28.5 | 25 |
| Median (range) | 20.0 (0–85.0) |
20.0 (0–85.0) |
15.0 (2.0–70.0) | 17.5 (0–85.0) |
20.0 (0–80.0) | 20 (0–85.0) |
20 (0–80.0) |
| Hepatic metastasis | |||||||
| Mean | 29.2 | 29.0 | 30.2 | 24.2 | 43.1 | 24.4 | 36.7 |
| Median (range) | 20.0 (0–95.0) | 20.0 (0–95.0) | 20.0 (0–80.0) | 10.0 (0–90.0) | 40.0 (2–95.0) | 10.0 (0–90.0) | 27.5 (0–95.0) |
| Characteristic | PSMA/CD34 ratio (n = 56) | ||
|---|---|---|---|
| Mean | Median (range) | p-value | |
| Demographics | |||
| Sex | |||
| Male | 31.0 | 20 (2–85) | .196 |
| Female | 23.3 | 17.5 (0–80) | |
| Age | .069 (τ = –0.176) | ||
| Treatment status | |||
| Untreated | 27.8 | 20 (0–85) | .873 |
| Treated | 23.8 | 15 (2–70) | |
| Primary CRC characteristics | |||
| Primary CRC size (cm) | .013 (τ = 0.241) | ||
| Location | |||
| Right | 23.3 | 15 (2–80) | .530 |
| Left | 38.0 | 20 (15–80) | |
| Rectum | 28.7 | 20 (0–85) | |
| Grade | |||
| 1 | 4.5 | 4.5 (2–7) | .457 (τ = 0.085) |
| 2 | 27.7 | 20 (0–85) | |
| 3 | 28.9 | 17.5 (2–70) | |
| pT category | |||
| 2 | 36.7 | 50 (0–60) | .227 (τ = 0.137) |
| 3 | 22.9 | 15 (0–85) | |
| 4 | 33.6 | 25 (0–80) | |
| pN category | |||
| 0 | 38.0 | 35 (0–80) | .892 (τ = 0.015) |
| 1 | 18.9 | 12.5 (0–60) | |
| 2 | 28.6 | 20 (0–85) | |
| pTNM stage at time of CRC resection | |||
| 1 | 0 | 0 (0–0) | .851 (τ = 0.021) |
| 2 | 50.0 | 50 (20–80) | |
| 3 | 23.0 | 20 (2–70) | |
| 4 | 27.9 | 17.5 (0–85) | |
| Tumor deposit | |||
| Absent | 29.4 | 20 (0–80) | .732 |
| Present | 26.0 | 20 (0–85) | |
| Lymphovascular invasion | |||
| Absent | 26.0 | 20 (0–80) | .715 |
| Present | 27.7 | 20 (0–85) | |
| Perineural invasion | |||
| Absent | 23.1 | 15 (0–80) | .173 |
| Present | 31.6 | 25 (2–85) | |
| Primary CRC margin | |||
| Negative | 26.0 | 20 (0–85) | .371 |
| Positive | 36.2 | 37.5 (2–70) | |
| Tumor-stroma ratio | |||
| Stroma high | 28.3 | 15 (0–85) | .935 |
| Stroma low | 24.7 | 20 (0–60) | |
| Precursor lesion | |||
| Absent | 30.4 | 20 (0–85) | .308 |
| Present | 21.4 | 17.5 (0–80) | |
| Tumor budding score | |||
| 1 | 29.5 | 20 (0–85) | .892 (τ = –0.015) |
| 2 | 18.5 | 15 (0–40) | |
| 3 | 32.4 | 20 (2–80) | |
| No. of tumor buds | .327 (τ = –0.098) | ||
| No. of positive lymph nodes | .397 (τ = 0.086) | ||
| No. of tumor deposits | .580 (τ = 0.056) | ||
| Hepatic metastasis characteristics | |||
| No. of hepatic metastasis | |||
| Multifocal | 30.1 | 20 (2–85) | .255 |
| Single | 24.3 | 20 (0–80) | |
| Hepatic metastasis size (cm) | .508 (τ = –0.067) | ||
| Tissue acquisition method | |||
| Biopsy | 29.0 | 15 (0–85) | >.99 |
| Resection | 25.8 | 20 (0–80) | |
| Operability | |||
| Inoperable | 30.3 | 20 (0–85) | .654 |
| Operable | 25.0 | 20 (0–80) | |
| Tissue acquisition time | |||
| Concurrent | 27.9 | 17.5 (0–85) | .864 |
| Metachronous | 25.1 | 20 (0–80) | |
| Clinical characteristic | PSMA/CD34 ratio | ||||||||
|---|---|---|---|---|---|---|---|---|---|
| All patients (n = 56) | Previously untreated patients (n = 47) | Chemotherapy-treated patients (n = 9) | |||||||
| Mean | Median (range) | p-value | Mean | Median (range) | p-value | Mean | Median (range) | p-value | |
| Demographics | |||||||||
| Sex | |||||||||
| Male | 32.7 | 20 (0–95) | .478 | 31.4 | 20 (0–95) | .746 | 43.3 | 30 (20–80) | .214 |
| Female | 25.8 | 12.5 (0–80) | 26.3 | 15 (2–80) | 23.7 | 12.5 (0–80) | |||
| Age | .568 (τ = –0.055) | .140 (τ = –0.157) | .035 (τ = 0.572) | ||||||
| Treatment status | .653 | NA | NA | ||||||
| Untreated | 29.0 | 20 (0–95) | 29.0 | 20 (0–95) | |||||
| Treated | 30.2 | 20 (0–80) | 30.2 | 20 (0–80) | |||||
| Primary CRC characteristics | |||||||||
| Primary CRC size (cm) | .314 (τ = 0.097) | .329 (τ = 0.104) | .596 (τ = 0.145) | ||||||
| Location | .287 | 0.460 | .323 |
||||||
| Right | 21.0 | 12.5 (0–80) | 20.2 | 10 (2–80) | 24.4 | 15 (0–80) | |||
| Left | 39.6 | 50 (0–80) | 39.6 | 50 (0–80) | |||||
| Rectum | 35.7 | 25 (0–95) | 35.3 | 20 (0–95) | 37.5 | 30 (10–80) | |||
| Grade | .005 (τ = –0.318) | .032 (τ = –0.267) | (Grade 2 vs. 3) .055 |
||||||
| 1 | 2.0 | 2 (2–2) | 2.0 | 2 (2–2) | |||||
| 2 | 36.3 | 20 (0–95) | 36.0 | 20 (0–95) | 37.9 | 30 (10–80) | |||
| 3 | 3.4 | 2 (0–10) | 3.4 | 2 (0–10) | 3.5 | 3.5 (0–7) | |||
| pT category | .170 (τ = –0.155) | .103 (τ = –0.203) | .702 (τ = 0.115) | ||||||
| 2 | 61.7 | 75 (20–90) | 82.5 | 82.5 (75–90) | 20.0 | 20 (20–20) | |||
| 3 | 29.4 | 20 (0–95) | 29.9 | 20 (0–95) | 27.0 | 22.5 (0–80) | |||
| 4 | 23.5 | 12.5 (0–80) | 20.8 | 12.5 (0–70) | 45.0 | 45 (10–80) | |||
| pN category | .579 (τ = –0.061) | .791 (τ = –0.032) | .559 (τ = –0.175) | ||||||
| 0 | 44.0 | 32.5 (2–90) | 46.7 | 40 (2–90) | 20.0 | 20 (20–20) | |||
| 1 | 18.9 | 8.5 (0–90) | 13.9 | 4.5 (0–90) | 36.8 | 30 (7–80) | |||
| 2 | 30.5 | 17.5 (0–95) | 31.2 | 20 (0–95) | 26.2 | 12.5 (0–80) | |||
| pTNM stage at time of CRC resection | .020 (τ = –0.262) | .048 (τ = –0.244) | .184 |
||||||
| 1 | 75.0 | 75 (75–75) | 75.0 | 75 (75–75) | |||||
| 2 | 32.5 | 32.5 (25–40) | 32.5 | 32.5 (25–40) | |||||
| 3 | 42.2 | 35 (2–95) | 39.6 | 30 (2–95) | 55.0 | 55 (30–80) | |||
| 4 | 24.1 | 10 (0–90) | 24.4 | 10 (0–90) | 23.1 | 15 (0–80) | |||
| Tumor deposit | .037 | .036 | .639 | ||||||
| Absent | 40.9 | 27.5 (2–95) | 42.9 | 32.5 (2–95) | 25.0 | 25 (20–30) | |||
| Present | 23.7 | 10 (0–80) | 21.8 | 10 (0–80) | 31.7 | 15 (0–80) | |||
| Lymphovascular invasion | .351 | .755 | .138 | ||||||
| Absent | 33.3 | 20 (2–95) | 31.5 | 20 (2–95) | 40.0 | 30 (20–80) | |||
| Present | 27.1 | 15 (0–90) | 27.8 | 17.5 (0–90) | 22.4 | 10 (0–80) | |||
| Perineural invasion | .433 | .174 | .555 | ||||||
| Absent | 32.1 | 20 (0–95) | 33.4 | 20 (2–95) | 15.0 | 15 (0–30) | |||
| Present | 26.1 | 10 (0–90) | 23.1 | 9 (0–90) | 34.6 | 20 (7–80) | |||
| Primary CRC margin | .894 | >.99 | .805 | ||||||
| Negative | 29.8 | 20 (0–95) | 29.6 | 20 (0–95) | 31.0 | 30 (0–80) | |||
| Positive | 24.5 | 15 (7–80) | 15.0 | 15 (10–20) | 29.2 | 15 (7–80) | |||
| Tumor-stroma ratio | .219 | .241 | .138 | ||||||
| Stroma high | 25.3 | 12.5 (0–90) | 25.8 | 15 (0–90) | 22.4 | 10 (0–80) | |||
| Stroma low | 37.4 | 25 (0–95) | 36.6 | 20 (0–95) | 40.0 | 30 (20–80) | |||
| Precursor lesion | .335 | .126 | .387 | ||||||
| Absent | 34.1 | 20 (0–95) | 35.5 | 20 (0–95) | 25.4 | 10 (0–80) | |||
| Present | 20.4 | 17.5 (0–80) | 16.4 | 12.5 (0–80) | 36.2 | 25 (15–80) | |||
| Tumor budding score | .298 (τ = –0.114) | .435 (τ = –0.095) | .404 (τ = –0.250) | ||||||
| 1 | 34.3 | 20 (0–90) | 33.2 | 20 (0–90) | 43.3 | 30 (20–80) | |||
| 2 | 28.1 | 20 (2–95) | 29.6 | 20 (2–95) | 7.0 | 7 (7–7) | |||
| 3 | 18.3 | 10 (0–80) | 12.1 | 8 (2–30) | 27.0 | 15 (0–80) | |||
| No. of tumor buds | .655 (τ = –0.044) | .866 (τ = –0.018) | .523 (τ = –0.176) | ||||||
| No. of positive lymph nodes | .491 (τ = –0.069) | .727 (τ = –0.039) | .335 (τ = –0.269) | ||||||
| No. of tumor deposits | .117 (τ = –0.159) | .110 (τ = –0.178 | .915 (τ = –0.030) | ||||||
Values are presented as number (%) unless otherwise indicated. CRC, colorectal cancer; NA, not applicable, Percentages for subgroups may not sum to 100 due to rounding.
PSMA, prostate-specific membrane antigen; CRC, colorectal cancer; NA, not applicable/available. PSMA expression could not be determined in 1 case due to technical difficulties.
CRC, colorectal cancer; PSMA, prostate-specific membrane antigen; τ, Kendall’s tau.
CRC, colorectal cancer; PSMA, prostate-specific membrane antigen; τ, Kendall’s tau; NA, not applicable. Only right-sided and rectal CRCs were present; Only grade 2 and grade 3 CRCs were present; Only pTNM stage 3 and 4 CRCs were present.

