 E-submission
Articles
- Page Path
- HOME > J Pathol Transl Med > Volume 46(1); 2012 > Article
-
Original Article
TNF-α and TNF-β Polymorphisms are Associated with Susceptibility to Osteoarthritis in a Korean Population - Lin Han,, Joo Hyoun Song1,, Jung Hwan Yoon, Yong Gyu Park2, Suk Woo Lee, Yoo Jin Choi, Suk Woo Nam, Jung Young Lee, Won Sang Park
-
Korean Journal of Pathology 2012;46(1):30-37.
DOI: https://doi.org/10.4132/KoreanJPathol.2012.46.1.30
Published online: February 23, 2012
Department of Pathology, The Catholic University of Korea College of Medicine, Seoul, Korea.
1Department of Orthopedics, The Catholic University of Korea College of Medicine, Seoul, Korea.
2Department of Biostatistics, The Catholic University of Korea College of Medicine, Seoul, Korea.
- Corresponding Author: Won Sang Park, M.D. Department of Pathology, The Catholic University of Korea College of Medicine, 505 Banpo-dong, Seocho-gu, Seoul 137-701, Korea. Tel: +82-2-590-1192, Fax: +82-2-537-6586, wonsang@catholic.ac.kr
- *Lin Han and Joo Hyoun Song contributed equally to this work.
© 2012 The Korean Society of Pathologists/The Korean Society for Cytopathology
This is an Open Access article distributed under the terms of the Creative Commons Attribution Non-Commercial License (http://creativecommons.org/licenses/by-nc/3.0) which permits unrestricted non-commercial use, distribution, and reproduction in any medium, provided the original work is properly cited.
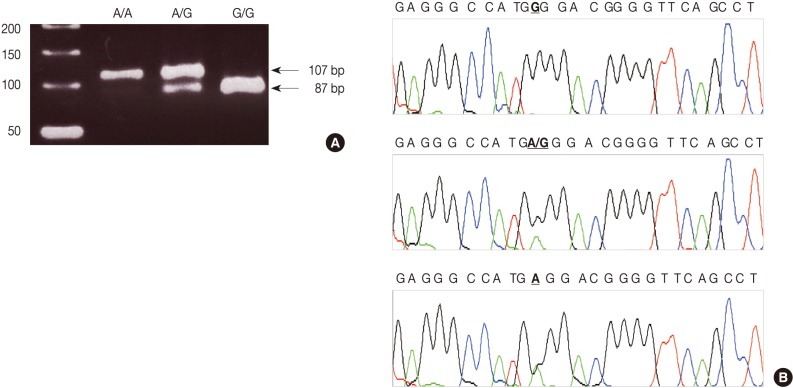

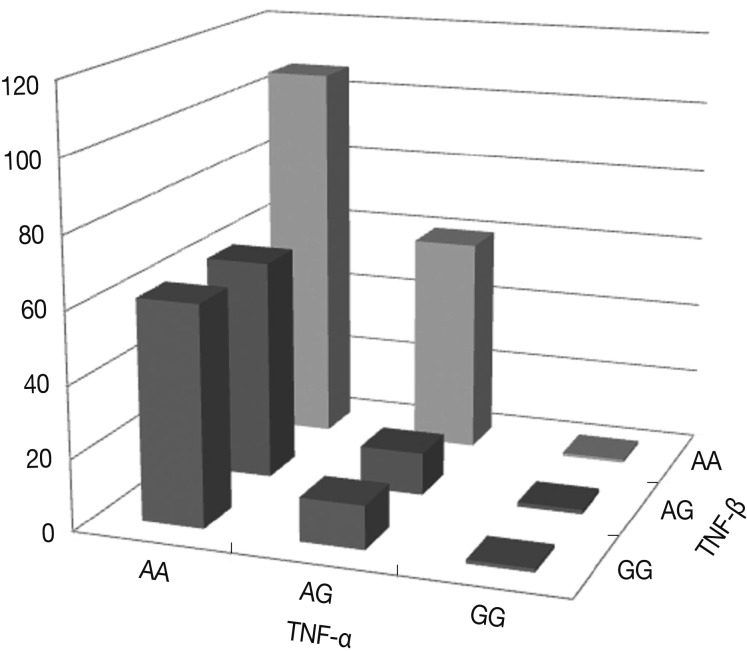
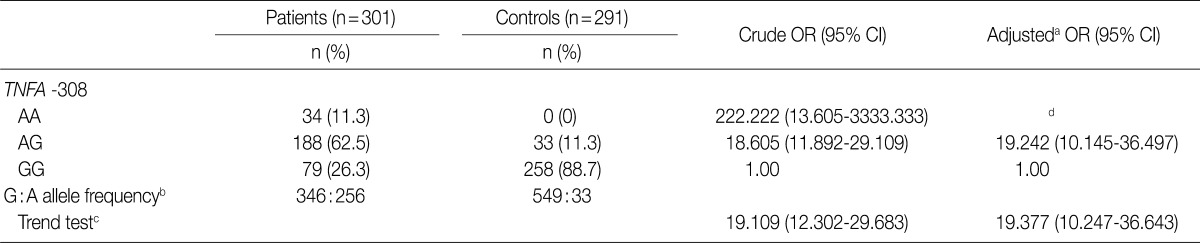


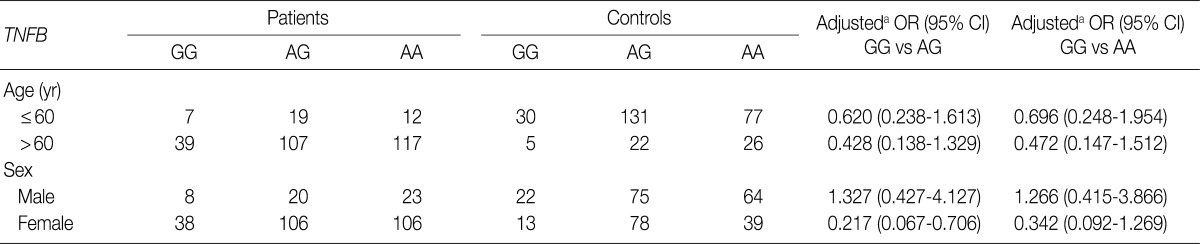
Figure & Data
References
Citations
- Chondroprotective effects of madecassoside incorporated alginate di-aldehyde gelatin hydrogel on IL-1 β induced in vitro osteoarthritic model
Jalaja Aswathy, Rajalekshmi Resmi, Josna Joseph, Roy Joseph, Annie John, Sabulal Baby, Annie Abraham
International Journal of Biological Macromolecules.2026; 335: 149228. CrossRef - Osteoarthritis and analgesic consumption in haemochromatosis HFE C282Y homozygotes with normal or low iron parameters
Jens Helby, Mathis Mottelson, Stig Egil Bojesen, Børge Grønne Nordestgaard, Mikkel Faurschou, Jesper Petersen, Christina Ellervik, Marie Warny, Andreas Glenthøj
Nature Communications.2026;[Epub] CrossRef - Causal effects of circulating inflammatory proteins on knee and hip osteoarthritis: A two sample Mendelian randomization study
Rongjie Lin, Qingcong Zheng, Rui Zhang, Quan Liu, Jianlong Lin, Shaohuang Weng, Min Chen
Clinical Rheumatology.2025; 44(1): 465. CrossRef - Association of Dopamine D2 Receptor (DRD2) C939T and a Lack of Association of Tumor Necrosis Factor-β (TNF-β) +A252G Polymorphisms with Susceptibility to Migraine in A Northern Iranian Population
Negar Gorjizadeh, Payam Saadat, Abbas Azadmehr, Saeed Irian
OBM Genetics.2025; 09(03): 1. CrossRef - The Exosomes of Stem Cells from Human Exfoliated Deciduous Teeth Suppress Inflammation in Osteoarthritis
Chuang-Yu Lin, Parichart Naruphontjirakul, Te-Yang Huang, Yi-Chia Wu, Wei-Hsuan Cheng, Wen-Ta Su
International Journal of Molecular Sciences.2024; 25(16): 8560. CrossRef - Impacts of mesenchymal stem cells and hyaluronic acid on inflammatory indicators and antioxidant defense in experimental ankle osteoarthritis
Usama Ismaeil Hagag, Fatma Mohamed Halfaya, Hessah Mohammed Al-Muzafar, Suhailah Saud Al-Jameel, Kamal Adel Amin, Wael Abou El-Kheir, Emad A Mahdi, Gamal Abdel-Nasser Ragab Hassan, Osama Mohamed Ahmed
World Journal of Orthopedics.2024; 15(11): 1056. CrossRef - Health benefits of astaxanthin against age-related diseases of multiple organs: A comprehensive review
Phaniendra Alugoju, V. K. D. Krishna Swamy, Naga Venkata Anusha Anthikapalli, Tewin Tencomnao
Critical Reviews in Food Science and Nutrition.2023; 63(31): 10709. CrossRef - Complete sequence and comparative analysis of the mitochondrial genome of the rare and endangered Clematis acerifolia, the first clematis mitogenome to provide new insights into the phylogenetic evolutionary status of the genus
Dan Liu, Kai Qu, Yangchen Yuan, Zhiheng Zhao, Ying Chen, Biao Han, Wei Li, Yousry A. El-Kassaby, Yangyang Yin, Xiaoman Xie, Boqiang Tong, Hongshan Liu
Frontiers in Genetics.2023;[Epub] CrossRef - Intra-articular Treatment with Triamcinolone Hexacetonide Associated with Gold Nanoparticles Reduces Cartilage Degeneration in an Animal Model of Osteoarthritis
Daniela Pacheco dos Santos Haupenthal, Marcus Barg Resmini, Leandro Almeida Da Silva, Mateus Cardoso Colares, Laura de Roch Casagrande, Ligia Milanez Venturini, Thiago Antônio Moretti de Andrade, Fernando Russo Costa do Bomfim, Anand Thirupathi, Paulo Emi
Current Drug Targets.2023; 24(3): 287. CrossRef - Vitamin D Receptor Gene Polymorphisms and Risk of Knee Osteoarthritis: Possible Correlations with TNF-α, Macrophage Migration Inhibitory Factor, and 25-Hydroxycholecalciferol Status
Mohammed H. Hassan, Amer Alkot Mostafa Elsadek, Marwa Ahmed Mahmoud, Bakheet E. M. Elsadek
Biochemical Genetics.2022; 60(2): 611. CrossRef - Complement System Inhibition Modulates the Inflammation Induced by the Venom of Premolis semirufa, an Amazon Rainforest Moth Caterpillar
Joel J. M. Gabrili, Isadora Maria Villas-Boas, Giselle Pidde, Carla Cristina Squaiella-Baptistão, Trent M. Woodruff, Denise V. Tambourgi
International Journal of Molecular Sciences.2022; 23(21): 13333. CrossRef - Azilsartan prevented AGE‐induced inflammatory response and degradation of aggrecan in human chondrocytes through inhibition of Sox4
Jie Lei, Mengyin He, Liangzhou Xu, Chengjian He, Jie Li, Wei Wang
Journal of Biochemical and Molecular Toxicology.2021;[Epub] CrossRef - TNF-α Carried by Plasma Extracellular Vesicles Predicts Knee Osteoarthritis Progression
Xin Zhang, Ming-Feng Hsueh, Janet L. Huebner, Virginia B. Kraus
Frontiers in Immunology.2021;[Epub] CrossRef - Genetic association between TNF-α G-308A and osteoarthritis in Asians: A case–control study and meta-analysis
Chih-Chien Wang, Chih-Yun Huang, Meng-Chang Lee, Dung-Jang Tsai, Chia-Chun Wu, Sui-Lung Su, Mingqing Xu
PLOS ONE.2021; 16(11): e0259561. CrossRef - Sex-, Age-, and Metabolic Disorder-Dependent Distributions of Selected Inflammatory Biomarkers among Community-Dwelling Adults
So Mi Jemma Cho, Hokyou Lee, Jee-Seon Shim, Hyeon Chang Kim
Diabetes & Metabolism Journal.2020; 44(5): 711. CrossRef - Tumor necrosis factor-α: Molecular assessment of gene expression, genetic variants and serum level in Egyptian patients with knee osteoarthritis
Nermin Raafat, Amal F. Gharib, Doaa S. Atta, Shimaa M. AbdElwahab, Doaa M. Sharaf
Gene Reports.2020; 21: 100922. CrossRef - Effect of a functional variant of tumor necrosis factor‐β gene in temporomandibular disorders: A pilot study
Kaan Yerliyurt, Ayse Feyda Nursal, Akin Tekcan, Nevin Karakus, Mehmet K. Tumer, Serbulent Yigit
Journal of Clinical Laboratory Analysis.2019;[Epub] CrossRef - Interleukin-6 (-572) and Tumor Necrosis Factor α (-308 and -238) Polymorphisms and Risk of Knee Osteoarthritis in a Pakistani Population: A Case–Control Study
Syeda Kanwal Batool Naqvi, Maria Bibi, Iram Murtaza, Qamar Javed
Iranian Journal of Science and Technology, Transactions A: Science.2019; 43(4): 1485. CrossRef - Role of resistin genetic variations in knee osteoarthritis pathogenesis, a cross sectional study
Syeda Kanwal Batool Naqvi, Iram Murtaza, Qamar Javed
Molecular Biology Reports.2019; 46(3): 2657. CrossRef -
Relationship Between Genetic Polymorphisms of the
TNF
Gene and Hallux Valgus Susceptibility
Jie Yang, Junhu Wang, Xiaojun Liang, Hongmou Zhao, Jun Lu, Qiang Ma, Feng Tian
Genetic Testing and Molecular Biomarkers.2019; 23(6): 380. CrossRef - Functional status and severity of osteoarthritis in elderly is associated to the polymorphism of TNFA gene
Marcos Tadeu Parron Fernandes, Karen Barros Parron Fernandes, Fernanda Freitas Anibal, Walquíria Shimoya-Bittencourt, Viviane Martins Santos, Priscila Daniele de Oliveira Perrucini, Regina Célia Poli-Frederico
Advances in Rheumatology.2019;[Epub] CrossRef - Association of TNF-α-308 G > A and −238G > A polymorphisms with knee osteoarthritis risk: A case-control study and meta-analysis
Mohammad Reza Sobhan, Masoud Mahdinezhad-Yazdi, Kazem Aghili, Masoud Zare-Shehneh, Shohreh Rastegar, Jalal Sadeghizadeh-Yazdi, Hossein Neamatzadeh
Journal of Orthopaedics.2018; 15(3): 747. CrossRef - Association between tumor necrosis factor alpha rs1800629 polymorphism and risk of osteoarthritis in a Chinese population
Jie Chen, Yu Wu, Jiannong Yu, Jinming Shen
Brazilian Journal of Medical and Biological Research.2018;[Epub] CrossRef - Association of cytokine gene polymorphisms with osteoarthritis susceptibility
Otilia Rogoveanu, Daniela Calina, Mihai Cucu, Florin Burada, Anca Docea, Simona Sosoi, Emilian Stefan, Mihai Ioana, Emilia Burada
Experimental and Therapeutic Medicine.2018;[Epub] CrossRef - TNF‑α increases the expression of inflammatory factors in synovial fibroblasts by inhibiting the PI3K/AKT pathway in a rat model of monosodium iodoacetate‑induced osteoarthritis
Hongxi Li, Shujuan Xie, Yunlong Qi, Huazhe Li, Rui Zhang, Yongyun Lian
Experimental and Therapeutic Medicine.2018;[Epub] CrossRef - The single-nucleotide polymorphism (SNP) of tumor necrosis factor α −308G/A gene is associated with early-onset primary knee osteoarthritis in an Egyptian female population
Sahar M. Abdel Galil, Nillie Ezzeldin, Faten Fawzy, Mohamed El-Boshy
Clinical Rheumatology.2017; 36(11): 2525. CrossRef - Roxatidine Attenuates Degradation of Extracellular Matrix
Renhao Ze, Shangyu Wang, Mao Xie, Bo Zhang, Xin Tang, Jin Li
Biomedicine & Pharmacotherapy.2017; 95: 1156. CrossRef - The Role of Inflammatory and Anti-Inflammatory Cytokines in the Pathogenesis of Osteoarthritis
Piotr Wojdasiewicz, Łukasz A. Poniatowski, Dariusz Szukiewicz
Mediators of Inflammation.2014; 2014: 1. CrossRef - Meta-analysis of tumor necrosis factor alpha -308 polymorphism and knee osteoarthritis risk
Suotang Kou, Yaochi Wu
BMC Musculoskeletal Disorders.2014;[Epub] CrossRef - Astaxanthin reduces matrix metalloproteinase expression in human chondrocytes
Wei-Ping Chen, Yan Xiong, Yong-Xiang Shi, Peng-Fei Hu, Jia-Peng Bao, Li-Dong Wu
International Immunopharmacology.2014; 19(1): 174. CrossRef - Variations in the TNFα gene and their interactions with the IL4R and IL10 genes in relation to hand osteoarthritis
Satu Hämäläinen, Svetlana Solovieva, Tapio Vehmas, Päivi Leino-Arjas, Ari Hirvonen
BMC Musculoskeletal Disorders.2014;[Epub] CrossRef - Tumor necrosis factor gene polymorphisms and endometriosis in Asians: a systematic review and meta-analysis
Jiangtao Lyu, Hua Yang, Jinghe Lang, Xianjie Tan
Chinese Medical Journal.2014; 127(9): 1761. CrossRef - Association analysis of two candidate polymorphisms in the Tumour Necrosis Factor-α gene with osteoarthritis in a Chinese population
Bin Ji, Jixiang Shi, Xiangyu Cheng, Junjie Zhou, Qiang Zhou, Chengfu Cao, Jinhui Pang
International Orthopaedics.2013; 37(10): 2061. CrossRef
 PubReader
 Cite this Article
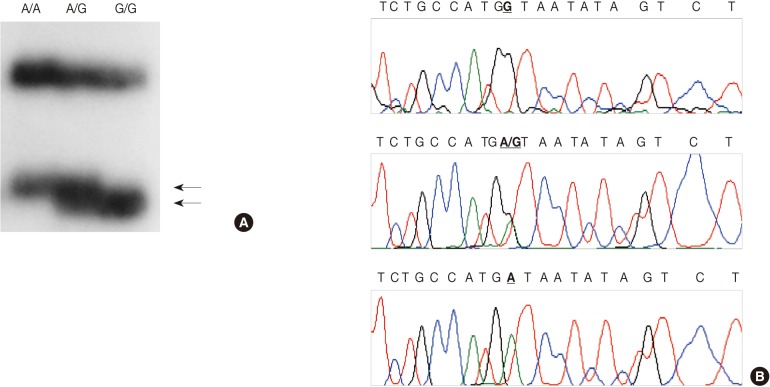


Fig. 1
Fig. 2
Fig. 3


aAdjusted for age (yr) and sex; bTwo-sided Fisher's exact test: for allele frequencies, p<0.0001; for genotype distribution, p<0.0001; cCalculated in the logistic regression model using the number of A alleles in the genotypes as a continuous variable; dCannot be estimated due to zero frequency in control group.
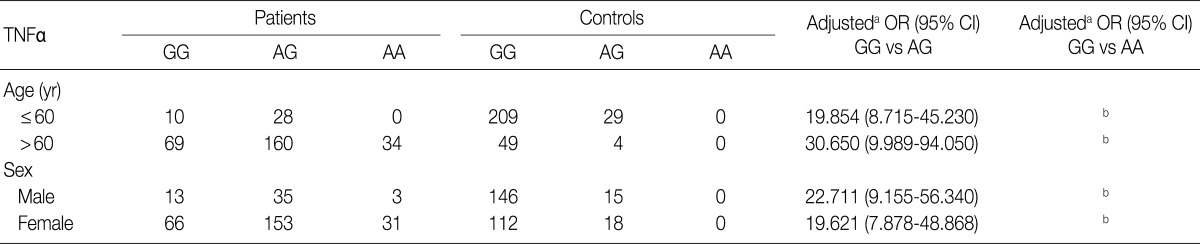
aAdjusted for the other covariates (age [yr] as a continuous variable) presented in this table in a logistic regression model for each stratum; bCannot be estimated due to zero frequency in control group.
aAdjusted for age (yr) and sex; bTwo-sided Fisher's exact test: for allele frequencies, p=0.0325; for genotype distribution, p=0.4542; cCalculated in the logistic regression model using the number of A alleles in the genotypes as a continuous variable.
aAdjusted for the other covariates (age [yr] as a continuous variable) presented in this table in a logistic regression model for each stratum.

