 E-submission
Articles
- Page Path
- HOME > J Pathol Transl Med > Volume 46(5); 2012 > Article
-
Original Article
Expression of MUC1 and MUC4 in Gallbladder Adenocarcinoma - Su-Mi Kim, Sun-Ju Oh, Bang Hur
-
Korean Journal of Pathology 2012;46(5):429-435.
DOI: https://doi.org/10.4132/KoreanJPathol.2012.46.5.429
Published online: October 25, 2012
Department of Pathology, Kosin University Gospel Hospital, Kosin University College of Medicine, Busan, Korea.
- Corresponding Author: Bang Hur, M.D. Department of Pathology, Kosin University Gospel Hospital, Kosin University College of Medicine, 262 Gamcheon-ro, Seo-gu, Busan 602-702, Korea. Tel: +82-51-990-6744, Fax: +82-51-241-7420, hurbang@ns.kosinmed.or.kr
© 2012 The Korean Society of Pathologists/The Korean Society for Cytopathology
This is an Open Access article distributed under the terms of the Creative Commons Attribution Non-Commercial License (http://creativecommons.org/licenses/by-nc/3.0) which permits unrestricted non-commercial use, distribution, and reproduction in any medium, provided the original work is properly cited.
Abstract
-
Background
- Recent reports have indicated that overexpression of mucin (MUC) 1 and/or MUC4 correlates with the occurrence and progression of extra-hepatobiliary malignancy. In this study, we investigated the expression of MUC1 and MUC4 and their prognostic significance in gallbladder adenocarcinoma.
-
Methods
- We examined 54 surgical gallbladder adenocarcinoma samples by immunohistochemistry for MUC1 and MUC4 expression. Staining was evaluated as a sum score of extent and intensity, dividing the samples into low and high expression groups.
-
Results
- The low expression group for both MUC1 and MUC4 was 10 samples (18.5%), and the high expression group was 44 samples (81.5%). High MUC1 expression was significantly correlated with more differentiated tumors (p=0.033), whereas high expression of MUC4 correlated with negative nodal status (p=0.012). Other pathological features were not correlated with MUC expression. Multivariate cox regression analysis showed that neither MUC1 nor MUC4 expression correlated with survival.
-
Conclusions
- Although there were some correlations found, a prognostic role for either MUC1 or MUC4 expression in gallbladder carcinoma was not identified in this study. Further investigation is required.
- Patients
- We examined 57 surgical gallbladder carcinoma specimens obtained from curative excision at the Kosin University between January 2000 and December 2009. One sarcomatoid carcinoma and two squamous cell carcinoma specimens were excluded, leaving 54 adenocarcinoma specimens. Samples were examined histopathologically according to the World Health Organization classification for invasion depth and histological differentiation. A retrospective chart review was carried out to obtain patient clinical data and follow-up survival time. The mean period of follow-up period was 31.9 months (range, 1 to 126.6 months), with one case lost during follow-up. Overall survival was calculated from the date of surgery, and the survival endpoint was either the date of last follow-up (September 30, 2011) or death.
- Immunohistochemistry
- All specimens were fixed in 10% formalin, embedded in paraffin, serially sectioned into 4-5 µm thick sections, mounted on polysine coated slides and later deparaffinized. Slides were then immersed for 20 minutes in 3% hydrogen peroxide in methanol to deplete endogenous peroxidase activity. After washing, slides were incubated with a protein-blocking agent for 5 minutes. Primary antibodies against MUC1 core protein (clone VU-4-H5, monoclonal antibody, Invitrogen, Carlsbad, CA, USA) and MUC4 core protein (clone 5B12, monoclonal antibody, Abnova, Taipei, Taiwan) were used at a dilution of 1:150. The slides were incubated with the primary antibodies in a humidified chamber for 1 hour, washed with phosphate buffered saline (PBS) for 30 minutes, and then the buffer was changed. Samples were then incubated with biotinylated secondary antibodies for 10 minutes at room temperature. Lastly, the slides were incubated in a solution containing 0.3% hydrochloride in PBS for detection. Slides were counterstained with Mayer's hematoxylin, prior to mounting in crystal.
- Criteria for interpreting MUC protein expression
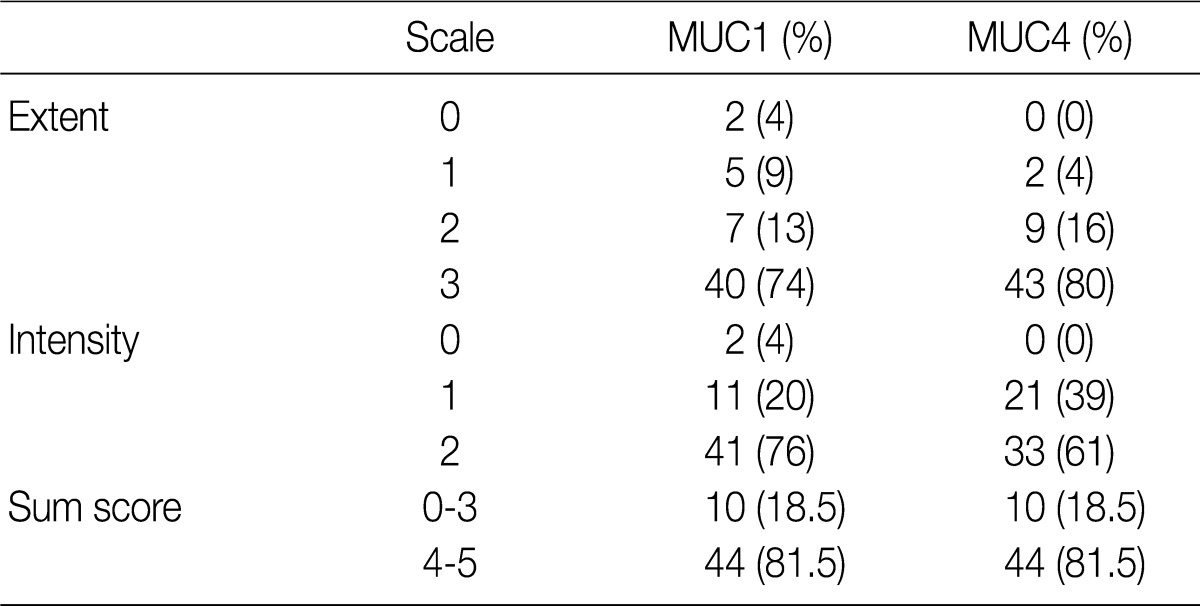
- Using the modified criteria of Jeon et al.,9 the presence and degree of MUC expression were graded based on the sum score of extent and intensity of staining. For the extent scale, a sample with fewer than 5% of cells expressing the protein was defined as negative. The positive extent scale was divided into three groups: score 1 (<33% of cells expressing the protein), score 2 (33-66%), and score 3 (>66%). For the intensity scale, staining that was less intense and weaker than the adjacent normal epithelium was defined as negative. The positive intensity scale was divided into two groups: score 1 (weak) and score 2 (strong). Score 2 (strong) was present as a pronounced apico-membranous and/or cytoplasmic expression (Fig. 1). Sum scores (0-5) of the extent and intensity scales were categorized into two groups for statistical analysis: low expression (sum score 0-3) and high expression (sum score 4-5).
- Statistical analysis
- Statistical analysis was performed using SPSS ver. 18.0 (SPSS Inc., Chicago, IL, USA), and a p-value of less than 0.05 was considered to be statistically significant. A chi-square test was used to determine the association, if any, between MUC expression and clinicopathological parameters. A Kaplan-Meier survival analysis was carried out to compare low- and high-expression groups of MUC1 and MUC4 in a log-rank test. In addition, a Cox regression analysis was performed to consider covariates that are known potential confounders or independent risk factors for death. These covariates and risk factors included sex, age, differentiation, stage, presence of lymph node metastases, lymphatic invasion, and perineural invasion.
MATERIALS AND METHODS
- Clinicopathological parameters
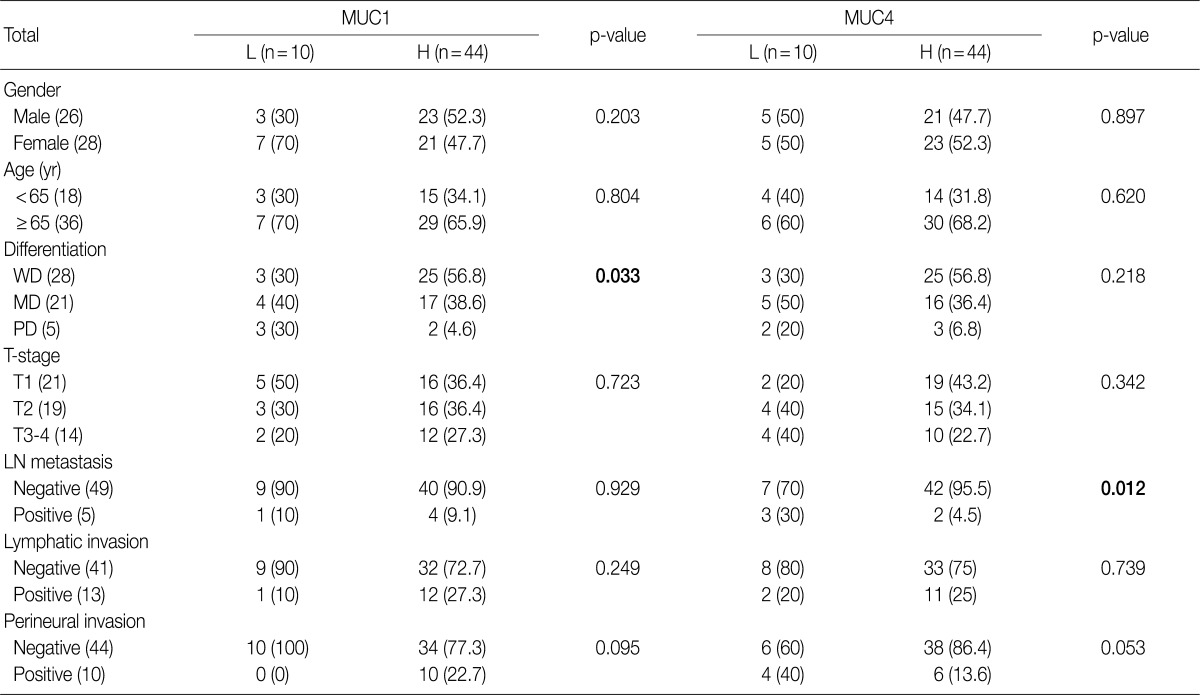
- The study cohort consisted of 26 males and 28 females, all between 44 years and 88 years of age, with a mean age of 67.3 years. Thirteen subjects (24.1%) were younger than 65 years, and 41 subjects (75.9%) were older than 65 years. With respect to the degree of differentiaion, 28 samples (51.9%) were determined to be well-differentiated, 21 samples (38.9%) were moderately differentiated and 5 samples (9.2%) were poorly differentiated. The samples were divided into four different stages of invasion: T1 (21 samples, 38.9%), invasion into the surrounding muscle layers; T2 (19 samples, 35.2%), invasion into the connective tissues around the muscles; T3 (12 samples, 22.2%), invasion into the membrane, nearby organs or liver; T4 (2 samples, 3.7%), invasion into the hepatic portal vein or artery, or into two organs or more. Of the 54 subjects, 5 subjects (9.3%) had lymph node metastasis, 13 subjects (24.1%) showed lymphatic vessel invasion, 10 subjects (18.6%) had perinerual invasion, 12 subjects (22.2%) had gallbladder stones and 6 subjects (11.1%) had an increase in total bilirubin and tumor marker carbohydrate antigen 19-9 (Table 1).
- Immunohistochemical staining
- Fifty-two of the gallbladder adenocarcinoma samples expressed MUC1, and all 54 expressed MUC4. For both MUC1 and MUC4 expression, there were 10 samples (18.5%) and 44 samples (81.5%) in the low and high expression groups, respectively (Table 2).
- Correlations between MUC expression and pathological features
- High expression of MUC1 was observed in 25 well-differentiated samples (56.8%), 17 moderately differentiated samples (38.6%), and 2 poorly differentiated samples (4.6%). MUC1 expression correlated with more differentiated cases (p=0.033). However, there was no correlation between MUC1 expression and other pathological features such as nodal status, lymphatic and perineural invasion and invasion depth (Table 1). High expression of MUC4 was observed in 42 node-negative (95.5%) and 2 node-positive (4.5%) samples (4.5%); therefore there was a significant correlation (p=0.012) between high MUC4 expression and node-negative status. Other pathological features, such as tumor differentiation, lymphatic and perineural invasion and invasion depth did not correlate with MUC4 expression (Table 1).
- Correlations between MUC expression status and survival rate
- We examined the survival of both low and high MUC1 and MUC4 expression groups using a univariate Kaplan-Meier survival analysis. For MUC1, the low expression group had a mean survival of 68.0 months, and the high expression group had a mean survival of 63.9 months (Log rank=0.747). The low and high MUC4 expression groups had mean survivals of 38.0 and 73.8 months, respectively. However, in spite of the distinct survival gap between low and high expression of MUC4, MUC4 expression did not significantly correlate with patient survival (Log-rank=0.162) (Fig. 2). Finally, in contrast to the independent survival factors of T-stage and nodal status, the prognostic values of MUC1 and MUC4 were not confirmed with a cox-regression model (Table 3).
RESULTS
- Mucins are high molecular weight glycoproteins that have an important role in epithelial cell protection and maintenance of homeostasis. They are produced by various epithelial cells, and oligosaccharides are often attached to serine or threonine residues of the mucin core protein backbone by O-glycosidic linkages.15 Mucins are subdivided into two structural and functional classes: secreted mucins (MUC2, MUC5AC, MUC6) and transmembranous mucins (MUC1, MUC4).15 MUC1 and MUC4 membrane mucins are each composed of a large alpha (α) and small beta (β) subunit. While most previous studies have focused on the role of the α subunit in tumor progression, the β subunits have recently emerged as oncogenes and contribute to cell growth signaling.19 The potential of β subunits as predictive markers is suggested by observations that cancer cells overexpressing β subunits become resistant to chemotherapy-induced cell death.19
- MUC1 has been mapped to a gene cluster on chromosome 1q21; it has an extracellular domain consisting of a variable number of highly conserved tandem repeats of 20 amino acids and a cytoplasmic tail of 69 amino acids.20 In cancer, MUC1 may function as an anti-adhesion molecule that inhibits homotypical cell aggregation and adhesion to the extracellular matrix, promoting tumor cell invasion.21 MUC1 may also be a prognostic marker: for example, gastric cancer patients who maintain a high reactivity for MUC1 have a better prognosis.22 Conversely, MUC1 has been suggested to be an oncogene in breast carcinoma as overexpression of MUC1 is important for repression of p53 expression.23
- MUC4 maps to a gene cluster on chromosome 3q29 and consists of an N-terminal α domain (with a long glycosylated extracellular domain containing tandem repeats of 16 amino acids) and C-terminal β domain.15 In addition to inhibiting apoptosis, the MUC4-erbB2 complex can also inhibit tumor cell proliferation, aggregation and/or immune surveillance, thus promoting intercellular invasion.16-18 Expression of MUC4 induces upregulation of the cell cycle inhibitor p27kip, which is associated with regulation of the G1 and S phases of the cell cycle.15 This indicates that MUC4 may be a marker for cells with increased proliferative potential. Aberrant expression of MUC4 has been reported in the pancreaticobiliary tract, lung, salivary gland, ovary, and prostate. Overexpression of MUC4 is associated with increased and more aggressive breast cancer metastases, extrahepatic bile duct carcinoma, and cholangiocarcinoma.7-9,17,18,24 Conversely, MUC4 expression has been associated with improved patient survival in ovarian cancer, mucoepidermoid carcinoma of the salivary glands, and squamous cell carcinoma of upper aerodigestive tract.25-27 Finally, Andrianifahanana et al.28 reported that MUC4 is expressed in pancreatic cancer but practically absent from the normal pancreas, indicating that it is potential marker for cancer precursor cells.
- Early diagnosis of gallbladder cancer is difficult due to it having few or no symptoms. Many cases are already in a progressive state upon diagnosis, resulting in poor prognosis. Once a carcinoma develops in an organ lacking submucous layers, it is highly likely that the tumor cells will invade adjacent organs, even at an earlier stage. However, few studies have been carried out on any of the clinicopathological factors or mechanisms involved. A few studies have examined the expression of MUC1 or MUC4 in gallbladder cancer, but until now, no clear assessment of their role as prognostic factors has been available. Previous studies analyzing MUC1 expression in the gallbladder have reported different results.12-14 Kawamoto et al.12 found that MUC1 expression was limited to the apical portions of normal epithelial cells. In contrast, its expression was extensive in tumor cells due to a loss of its apical polar expression pattern, resulting in a breaking of cell-cell adhesion and helping the carcinoma to spread to nearby areas.12 Yamato et al.13 reported that MUC1 was rarely expressed in normal epithelial cells in the gallbladder. Instead, it was seen in dysplastic or malignant tumor cells and was particularly highly expressed in invasive areas.13 In the present study, weak apico-membranous expression was seen in adjacent normal tissue while tumor cells showed variable expression (including apical, basolateral-membranous or cytoplasmic patterns). In some areas, focal cytoplasmic accentuation was observed (data not shown), which may be related to aberrant depolarization or other as yet unknown causes. The present study was focused on the extent and intensity of MUC expression. Ghosh et al.14 found that MUC1 expression was remarkably lower in T1 stage tumors than in higher stages, and that there was no correlation between the level of MUC1 expression and the tumor histopathologic type and grade. However, there was a higher possibility of angio-lymphatic invasion in samples with a depolarized (membrane and cytoplasmic) expression MUC1 pattern.14 In the present study, high MUC1 expression was correlated with more differentiated tumors. However, MUC1 expression did not correlate with other pathological features, such as lymphatic and perineural invasion, nodal status and invasion depth. Xiong et al.29 previously examined the correlation of MUC1 and MUC5AC in gallbladder adenocarcinoma, finding that the expression of MUC1 is linked with T-stage (p<0.01) but not histologic differentiation. Additionally, increased MUC1 expression or decreased MUC5AC expression was associated with decreased overall survival. Furthermore decreased MUC5AC expression was an independent prognostic predictor.29 In the present study, though, tumor stage and patient survival did not correlate with MUC1 expression. These contradictory results may be due to one or more different factors, including different antibody selection, different severity of specimens or different immunohistochemical procedures and/or interpretation criteria. In particular, Xiong et al.29 had an even distribution of tumor stages (14 stage T1 samples, 35 T2, 37 T3, and 22 T4) and histological differentiation (36 well-differentiated samples, 31 moderately differentiated, and 30 poorly differentiated), while our study included only two T4 stage samples and 5 poorly differentiated adenocarcinomas.
- Vandenhaute et al.30 previously suggested that MUC4 was only weakly expressed in adjacent normal epithelial cells in gallbladder cancer and therefore would likely serve as tumor marker or prognostic factor. Miyahara et al.16 demonstrated that MUC4 was upregulated in gallbladder carcinoma, altering erbB2 signaling and actively contributing to carcinogenesis. Furthermore, they showed that MUC4 expression was elevated in moderately to highly differentiated gallbladder carcinomas, but there was no significant association with survival rate or metastasis.16 According to Miyahara et al.,16 MUC4 expression at the mRNA and protein levels was significantly higher in early stage tumors (T1 and T2), especially in differentiated tumor group. Our study found that MUC4 expression is not correlated with histological differentiation, tumor stage or lymphovascular or perineural invasion. The only significant correlation we found was negative nodal status. These results contrast with previous studies showing aggressive prognostic roles for MUC4. However, MUC4 has been reported to be involved in early carcinogenesis rather than tumor progression, indicating that MUC4 may be useful marker for early diagnosis of cancers, particularly pancreatic carcinoma and ovarian carcinoma.25,28 In fact, MUC4 was identified as one of the most differentially expressed genes in pancreatic adenocarcinoma, with undetectable expression in the normal pancreas and early neoexpression in precancerous pancreatic intraepithelial neoplastic lesions.7,25 In our study, the significant correlation between negative nodal status and MUC4 expression could be viewed in a similar light, although the conclusions that can be drawn are limited by the relatively small number (5) of subjects with positive nodal status in our study.
- We found no significant relationship between mean survival and MUC1 or MUC4 expression, although there was a sizeable difference in survival between subjects with low (38.0 months) and high (73.8 months) MUC4 expression. This is in contrast to the correlations between MUC1 and MUC4 expression and poor survival reported previously. As mentioned above, these discordances may be due to several procedural differences or limitations of the sample cohorts, in addition to the limited modality of the immunohistochemical approach.
DISCUSSION
- 1. Misra S, Chaturvedi A, Misra NC, Sharma ID. Carcinoma of the gallbladder. Lancet Oncol 2003; 4: 167-176. ArticlePubMed
- 2. Kimura K, Ohto M, Saisho H, et al. Association of gallbladder carcinoma and anomalous pancreaticobiliary ductal union. Gastroenterology 1985; 89: 1258-1265. ArticlePubMed
- 3. Hanada K, Tsuchida A, Iwao T, et al. Gene mutations of K-ras in gallbladder mucosae and gallbladder carcinoma with an anomalous junction of the pancreaticobiliary duct. Am J Gastroenterol 1999; 94: 1638-1642. ArticlePubMed
- 4. Yonezawa S, Goto M, Yamada N, Higashi M, Nomoto M. Expression profiles of MUC1, MUC2, and MUC4 mucins in human neoplasms and their relationship with biological behavior. Proteomics 2008; 8: 3329-3341. ArticlePubMed
- 5. Higashi M, Yonezawa S, Ho JJ, et al. Expression of MUC1 and MUC2 mucin antigens in intrahepatic bile duct tumors: its relationship with a new morphological classification of cholangiocarcinoma. Hepatology 1999; 30: 1347-1355. ArticlePubMed
- 6. Tamada S, Goto M, Nomoto M, et al. Expression of MUC1 and MUC2 mucins in extrahepatic bile duct carcinomas: its relationship with tumor progression and prognosis. Pathol Int 2002; 52: 713-723. ArticlePubMed
- 7. Saitou M, Goto M, Horinouchi M, et al. MUC4 expression is a novel prognostic factor in patients with invasive ductal carcinoma of the pancreas. J Clin Pathol 2005; 58: 845-852. ArticlePubMedPMC
- 8. Tamada S, Shibahara H, Higashi M, et al. MUC4 is a novel prognostic factor of extrahepatic bile duct carcinoma. Clin Cancer Res 2006; 12(14 Pt 1): 4257-4264. ArticlePubMedPDF
- 9. Jeon JM, Lee HW, Park JY, et al. Expression of MUC1 and MUC4 and its prognostic significance in non-small cell lung carcinoma. Korean J Pathol 2010; 44: 397-403. Article
- 10. Singh AP, Chauhan SC, Bafna S, et al. Aberrant expression of transmembrane mucins, MUC1 and MUC4, in human prostate carcinomas. Prostate 2006; 66: 421-429. ArticlePubMed
- 11. Jonckheere N, Van Seuningen I. The membrane-bound mucins: from cell signalling to transcriptional regulation and expression in epithelial cancers. Biochimie 2010; 92: 1-11. ArticlePubMed
- 12. Kawamoto T, Shoda J, Miyahara N, et al. Expression of MUC1 recognized by a monoclonal antibody MY.1E12 is a useful biomarker for tumor aggressiveness of carcinoma of the gallbladder. Clin Exp Metastasis 2004; 21: 353-362. ArticlePubMed
- 13. Yamato T, Sasaki M, Watanabe Y, Nakanuma Y. Expression of MUC1 and MUC2 mucin core proteins and their messenger RNA in gall bladder carcinoma: an immunohistochemical and in situ hybridization study. J Pathol 1999; 188: 30-37. ArticlePubMed
- 14. Ghosh M, Kamma H, Kawamoto T, et al. MUC 1 core protein as a marker of gallbladder malignancy. Eur J Surg Oncol 2005; 31: 891-896. ArticlePubMed
- 15. Yonezawa S, Higashi M, Yamada N, et al. Mucins in human neoplasms: clinical pathology, gene expression and diagnostic application. Pathol Int 2011; 61: 697-716. ArticlePubMed
- 16. Miyahara N, Shoda J, Ishige K, et al. MUC4 interacts with ErbB2 in human gallbladder carcinoma: potential pathobiological implications. Eur J Cancer 2008; 44: 1048-1056. ArticlePubMed
- 17. Shibahara H, Tamada S, Higashi M, et al. MUC4 is a novel prognostic factor of intrahepatic cholangiocarcinoma-mass forming type. Hepatology 2004; 39: 220-229. ArticlePubMed
- 18. Workman HC, Sweeney C, Carraway KL 3rd. The membrane mucin Muc4 inhibits apoptosis induced by multiple insults via ErbB2-dependent and ErbB2-independent mechanisms. Cancer Res 2009; 69: 2845-2852. ArticlePubMedPMCPDF
- 19. Albrecht H, Carraway KL 3rd. MUC1 and MUC4: switching the emphasis from large to small. Cancer Biother Radiopharm 2011; 26: 261-271. ArticlePubMedPMC
- 20. Hollingsworth MA, Swanson BJ. Mucins in cancer: protection and control of the cell surface. Nat Rev Cancer 2004; 4: 45-60. ArticlePubMedPDF
- 21. Hilkens J, Ligtenberg MJ, Vos HL, Litvinov SV. Cell membrane-associated mucins and their adhesion-modulating property. Trends Biochem Sci 1992; 17: 359-363. ArticlePubMed
- 22. Wang RQ, Fang DC. Alterations of MUC1 and MUC3 expression in gastric carcinoma: relevance to patient clinicopathological features. J Clin Pathol 2003; 56: 378-384. ArticlePubMedPMC
- 23. Hattrup CL, Gendler SJ. MUC1 alters oncogenic events and transcription in human breast cancer cells. Breast Cancer Res 2006; 8: R37.ArticlePubMedPMCPDF
- 24. Takao S, Uchikura K, Yonezawa S, Shinchi H, Aikou T. Mucin core protein expression in extrahepatic bile duct carcinoma is associated with metastases to the liver and poor prognosis. Cancer 1999; 86: 1966-1975. ArticlePubMed
- 25. Chauhan SC, Singh AP, Ruiz F, et al. Aberrant expression of MUC4 in ovarian carcinoma: diagnostic significance alone and in combination with MUC1 and MUC16 (CA125). Mod Pathol 2006; 19: 1386-1394. ArticlePubMedPDF
- 26. Weed DT, Gomez-Fernandez C, Pacheco J, et al. MUC4 and ERBB2 expression in major and minor salivary gland mucoepidermoid carcinoma. Head Neck 2004; 26: 353-364. ArticlePubMed
- 27. Weed DT, Gomez-Fernandez C, Yasin M, et al. MUC4 and ErbB2 expression in squamous cell carcinoma of the upper aerodigestive tract: correlation with clinical outcomes. Laryngoscope 2004; 114(8 Pt 2 Suppl 101): 1-32. Article
- 28. Andrianifahanana M, Moniaux N, Schmied BM, et al. Mucin (MUC) gene expression in human pancreatic adenocarcinoma and chronic pancreatitis: a potential role of MUC4 as a tumor marker of diagnostic significance. Clin Cancer Res 2001; 7: 4033-4040. PubMed
- 29. Xiong L, Yang Z, Yang L, Liu J, Miao X. Expressive levels of MUC1 and MUC5AC and their clinicopathologic significances in the benign and malignant lesions of gallbladder. J Surg Oncol 2012; 105: 97-103. ArticlePubMedPDF
- 30. Vandenhaute B, Buisine MP, Debailleul V, et al. Mucin gene expression in biliary epithelial cells. J Hepatol 1997; 27: 1057-1066. ArticlePubMed
REFERENCES
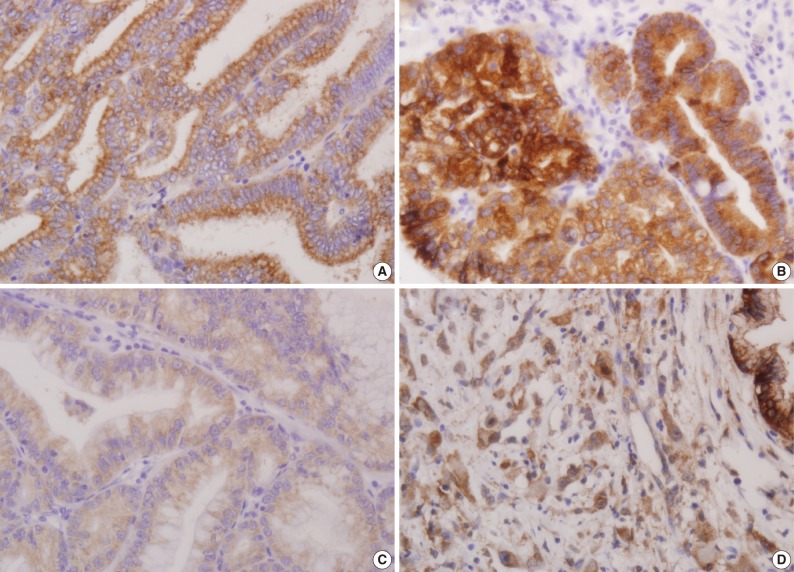


Figure & Data
References
Citations
- Differentiating Neoplastic From Non-neoplastic Gallbladder Lesions Using MUC1 and MUC5AC: An Immunohistochemical Analysis
Umika Gupta, Vijai Singh, Sanjeev Yadav
Cureus.2025;[Epub] CrossRef - Tumors and tumor-like lesions of the gall bladder—A review
Nuzhat Husain, Saumya Shukla, Pallavi Srivastava
Indian Journal of Pathology and Microbiology.2025; 68(4): 676. CrossRef - Environmental and Metabolic Risk Factors Linked to Gallbladder Dysplasia
Andrei Bojan, Catalin Pricop, Manuela Ciocoiu, Maria Cristina Vladeanu, Iris Bararu Bojan, Oana Viola Badulescu, Minerva Codruta Badescu, Carmen Elena Plesoianu, Dan Iliescu Halitchi, Liliana Georgeta Foia
Metabolites.2024; 14(5): 273. CrossRef - Expression of Mucoproteins in Gallbladder Cancer
Puneet Kumar, Priyesh Shukla, Soni Kumari, Ruhi Dixit, Gopeshwar Narayan, V. K. Dixit, A. K. Khanna
Indian Journal of Surgery.2022; 84(3): 456. CrossRef - Prognostic and clinicopathological value of MUC1 expression in colorectal cancer
Chao Li, Tao Liu, Libin Yin, Didi Zuo, Yuyang Lin, Lei Wang
Medicine.2019; 98(9): e14659. CrossRef - Prognostic Significance of Mucin Antigen MUC1 in Various Human Epithelial Cancers
Feng Xu, Fuquan Liu, Hongwei Zhao, Guangyu An, Guosheng Feng
Medicine.2015; 94(50): e2286. CrossRef - Increased Expression of CCN2, Epithelial Membrane Antigen, and Fibroblast Activation Protein in Hepatocellular Carcinoma with Fibrous Stroma Showing Aggressive Behavior
Gi Jeong Kim, Hyungjin Rhee, Jeong Eun Yoo, Jung Eun Ko, Jee San Lee, Hyunki Kim, Jin Sub Choi, Young Nyun Park, Philip C. Trackman
PLoS ONE.2014; 9(8): e105094. CrossRef - State-of-the-art in the management of locally advanced and metastatic gallbladder cancer
Mairéad G. McNamara, Cristiane Metran-Nascente, Jennifer J. Knox
Current Opinion in Oncology.2013; 25(4): 425. CrossRef - Clinicopathological and Prognostic Significance of MUC-2, MUC-4 and MUC-5AC Expression in Japanese Gastric Carcinomas
Li-Jun Xiao, Shuang Zhao, En-Hong Zhao, Xin Zheng, Wen-Feng Gou, Ya-Nan Xing, Yasuo Takano, Hua-Chuan Zheng
Asian Pacific Journal of Cancer Prevention.2012; 13(12): 6447. CrossRef
 PubReader
 Cite this Article
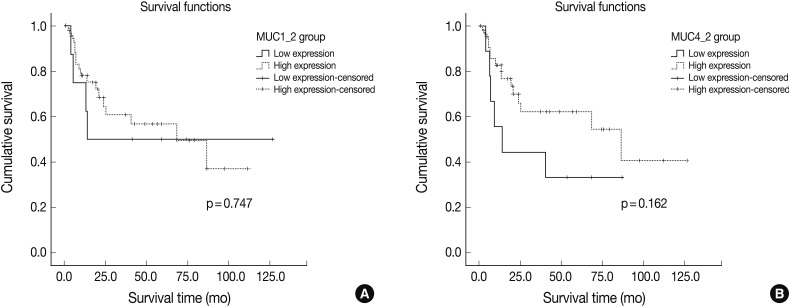


Fig. 1
Fig. 2

p-value, by χ2 test. L, low expression; H, high expression; WD, well differentiated; MD, moderately differentiated; PD, poorly differentiated; LN, lymph node.
Extent scale: 0 (<5%), 1 (<33%), 2 (≤66%), 3 (>66%). Intensity scale: 0 (negative), 1 (weak), 2 (strong).
HR, hazard ratio; CI, confidence interval; MUC, mucin; MD, moderately differentiated; PD, poorly differentiated; WD, well differentiated; LN, lymph node.

