 E-submission
Articles
- Page Path
- HOME > J Pathol Transl Med > Volume 47(2); 2013 > Article
-
Original Article
Hedgehog Related Protein Expression in Breast Cancer: Gli-2 Is Associated with Poor Overall Survival - Soyoung Im, Hyun Joo Choi, Changyoung Yoo, Ji-Han Jung, Ye-Won Jeon1, Young Jin Suh1, Chang Suk Kang2
-
Korean Journal of Pathology 2013;47(2):116-123.
DOI: https://doi.org/10.4132/KoreanJPathol.2013.47.2.116
Published online: April 24, 2013
Department of Hospital Pathology, St. Vincent's Hospital, The Catholic University of Korea College of Medicine, Suwon, Korea.
1Department of Surgery, St. Vincent's Hospital, The Catholic University of Korea College of Medicine, Suwon, Korea.
2Department of Hospital Pathology, St. Mary's Hospital, The Catholic University of Korea College of Medicine, Seoul, Korea.
- Corresponding Author: Hyun Joo Choi, M.D. Department of Pathology, St. Vincent's Hospital, The Catholic University of Korea College of Medicine, 93 Jungbu-daero, Paldal-gu, Suwon 442-723, Korea. Tel: +82-31-249-7592, Fax: +82-31-244-6786, chj0103@catholic.ac.kr
© 2013 The Korean Society of Pathologists/The Korean Society for Cytopathology
This is an Open Access article distributed under the terms of the Creative Commons Attribution Non-Commercial License (http://creativecommons.org/licenses/by-nc/3.0/) which permits unrestricted non-commercial use, distribution, and reproduction in any medium, provided the original work is properly cited.
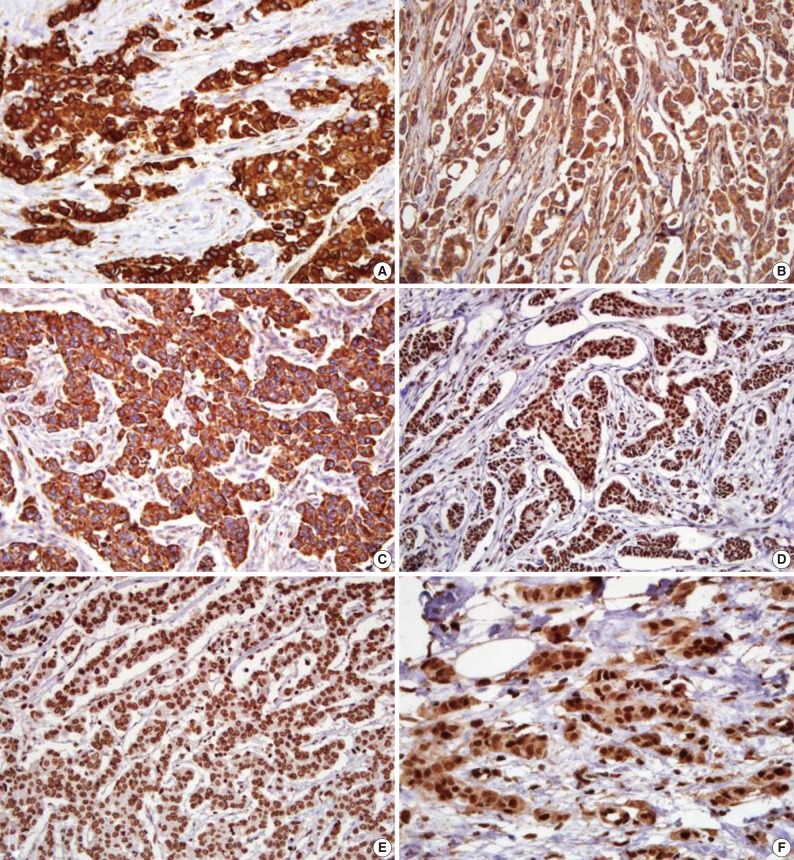

Figure & Data
References
Citations
- Expression of SHH Signaling Pathway Genes in Pleomorphic Adenoma and Mucoepidermoid Carcinoma: A Preliminary Study
Deepak Gowda Sadashivappa Pateel, Gou Rean Wong, Anand Ramanathan, Fong Fong Liew, Rosnah Binti Zain
Journal of Advanced Oral Research.2026;[Epub] CrossRef - Dysregulation of deubiquitination in breast cancer
Lili Kong, Xiaofeng Jin
Gene.2024; 902: 148175. CrossRef - siRNA treatment targeting integrin α11 overexpressed via EZH2-driven axis inhibits drug-resistant breast cancer progression
Prakash Chaudhary, Kiran Yadav, Ho Jin Lee, Keon Wook Kang, Jongseo Mo, Jung-Ae Kim
Breast Cancer Research.2024;[Epub] CrossRef - Implicating clinical utility of altered expression of PTCH1 & SMO in oral squamous cell carcinoma
Hitarth V. Patel, Jigna S. Joshi, Franky D. Shah
Journal of Molecular Histology.2024; 55(4): 379. CrossRef - A clinicopathological exploration of Hedgehog signaling: implications in oral carcinogenesis
Hitarth V. Patel, Jigna S. Joshi, Franky D. Shah
Journal of Cancer Research and Clinical Oncology.2023; 149(18): 16525. CrossRef - GLI3 and androgen receptor are mutually dependent for their malignancy-promoting activity in ovarian and breast cancer cells
Min Lin, Haiyan Zhu, Qi Shen, Lu-Zhe Sun, Xueqiong Zhu
Cellular Signalling.2022; 92: 110278. CrossRef - Persistent Properties of a Subpopulation of Cancer Cells Overexpressing the Hedgehog Receptor Patched
Álvaro Javier Feliz Morel, Anida Hasanovic, Aurélie Morin, Chloé Prunier, Virginie Magnone, Kevin Lebrigand, Amaury Aouad, Sarah Cogoluegnes, Judith Favier, Claude Pasquier, Isabelle Mus-Veteau
Pharmaceutics.2022; 14(5): 988. CrossRef - Case Report: Submucosal gastroblastoma with a novel PTCH1::GLI2 gene fusion in a 58-year-old man
Cuimin Chen, Junliang Lu, Huanwen Wu
Frontiers in Oncology.2022;[Epub] CrossRef - Higher Expressions of SHH and AR Are Associated with a Positive Receptor Status and Have Impact on Survival in a Cohort of Croatian Breast Cancer Patients
Ivan Budimir, Čedna Tomasović-Lončarić, Kristina Kralik, Josipa Čonkaš, Domagoj Eljuga, Rado Žic, Božo Gorjanc, Hrvoje Tucaković, Doroteja Caktaš, Josip Jaman, Valentino Lisek, Zlatko Vlajčić, Krešimir Martić, Petar Ozretić
Life.2022; 12(10): 1559. CrossRef - New insight into the role of PTCH1 protein in serous ovarian carcinomas
Valentina Karin‑Kujundzic, Adriana Covarrubias‑Pinto, Anita Skrtic, Semir Vranic, Ljiljana Serman
International Journal of Oncology.2022;[Epub] CrossRef - Hedgehog gene expression patterns among intrinsic subtypes of breast cancer: Prognostic relevance
Araceli García-Martínez, Ariadna Pérez-Balaguer, Fernando Ortiz-Martínez, Eloy Pomares-Navarro, Elena Sanmartín, Marta García-Escolano, Yoel G. Montoyo-Pujol, Elena Castellón-Molla, Gloria Peiró
Pathology - Research and Practice.2021; 223: 153478. CrossRef - Coexpression of Epha10 and Gli3 Promotes Breast Cancer Cell Proliferation, Invasion and Migration
Jing Peng, Danhua Zhang
Journal of Investigative Medicine.2021; 69(6): 1215. CrossRef - The Role of Smoothened-Dependent and -Independent Hedgehog Signaling Pathway in Tumorigenesis
Jian Yi Chai, Vaisnevee Sugumar, Mohammed Abdullah Alshawsh, Won Fen Wong, Aditya Arya, Pei Pei Chong, Chung Yeng Looi
Biomedicines.2021; 9(9): 1188. CrossRef - HER2-mediated GLI2 stabilization promotes anoikis resistance and metastasis of breast cancer cells
Parul Gupta, Nehal Gupta, Neel M. Fofaria, Alok Ranjan, Sanjay K. Srivastava
Cancer Letters.2019; 442: 68. CrossRef - Role of Hedgehog Signaling in Breast Cancer: Pathogenesis and Therapeutics
Natalia Riobo-Del Galdo, Ángela Lara Montero, Eva Wertheimer
Cells.2019; 8(4): 375. CrossRef - Carbonic anhydrase XII expression is linked to suppression of Sonic hedgehog ligand expression in triple negative breast cancer cells
G. Guerrini, J. Durivault, I. Filippi, M. Criscuoli, S. Monaci, J. Pouyssegur, A. Naldini, F. Carraro, S.K. Parks
Biochemical and Biophysical Research Communications.2019; 516(2): 408. CrossRef - Sonic hedgehog and Wnt/β-catenin pathways mediate curcumin inhibition of breast cancer stem cells
Xiaoting Li, Xiaoqian Wang, Chunfeng Xie, Jianyun Zhu, Yu Meng, Yue Chen, Yuan Li, Ye Jiang, Xue Yang, Shijia Wang, Jiaqi Chen, Qi Zhang, Shanshan Geng, Jieshu Wu, Caiyun Zhong, Yu Zhao
Anti-Cancer Drugs.2018; 29(3): 208. CrossRef - Glioma-Associated Oncogene Homolog Inhibitors Have the Potential of Suppressing Cancer Stem Cells of Breast Cancer
Kuo-Shyang Jeng, Chi-Juei Jeng, I-Shyan Sheen, Szu-Hua Wu, Ssu-Jung Lu, Chih-Hsuan Wang, Chiung-Fang Chang
International Journal of Molecular Sciences.2018; 19(5): 1375. CrossRef - Cancer Stem Cell Metabolism and Potential Therapeutic Targets
Vusala Snyder, Tamika C. Reed-Newman, Levi Arnold, Sufi Mary Thomas, Shrikant Anant
Frontiers in Oncology.2018;[Epub] CrossRef - Targeting the Multidrug Transporter Ptch1 Potentiates Chemotherapy Efficiency
Anida Hasanovic, Isabelle Mus-Veteau
Cells.2018; 7(8): 107. CrossRef - Combined inhibition of GLI and FLT3 signaling leads to effective anti-leukemic effects in human acute myeloid leukemia
Emily-Marie Latuske, Hauke Stamm, Marianne Klokow, Gabi Vohwinkel, Jana Muschhammer, Carsten Bokemeyer, Manfred Jücker, Maxim Kebenko, Walter Fiedler, Jasmin Wellbrock
Oncotarget.2017; 8(17): 29187. CrossRef - Prognostic role of Gli1 expression in breast cancer: a meta-analysis
Bilan Wang, Ting Yu, Yuzhu Hu, Mengmeng Xiang, Haoning Peng, Yunzhu Lin, Lu Han, Lingli Zhang
Oncotarget.2017; 8(46): 81088. CrossRef - Inhibition of Ciliogenesis Promotes Hedgehog Signaling, Tumorigenesis, and Metastasis in Breast Cancer
Nadia B. Hassounah, Martha Nunez, Colleen Fordyce, Denise Roe, Ray Nagle, Thomas Bunch, Kimberly M. McDermott
Molecular Cancer Research.2017; 15(10): 1421. CrossRef - The sonic hedgehog signaling pathway contributes to the development of salivary gland neoplasms regardless of perineural infiltration
Manuela Torres Andion Vidal, Sílvia Vanessa Lourenço, Fernando Augusto Soares, Clarissa Araújo Gurgel, Eduardo J. B. Studart, Ludmila de Faro Valverde, Iguaracyra Barreto de Oliveira Araújo, Eduardo Antônio Gonçalves Ramos, Flávia Caló de Aquino Xavier, J
Tumor Biology.2016; 37(7): 9587. CrossRef - Cancer stem cells and HER2 positive breast cancer: The story so far
Deep Shah, Clodia Osipo
Genes & Diseases.2016; 3(2): 114. CrossRef - Tamoxifen Resistance: Emerging Molecular Targets
Milena Rondón-Lagos, Victoria Villegas, Nelson Rangel, Magda Sánchez, Peter Zaphiropoulos
International Journal of Molecular Sciences.2016; 17(8): 1357. CrossRef - The Hedgehog signaling pathway is associated with poor prognosis in breast cancer patients with the CD44+/CD24− phenotype
Haishan Zhao, Hongtao Tang, Qinghuan Xiao, Miao He, Lin Zhao, Yingzi Fu, Huizhe Wu, Zhaojin Yu, Qian Jiang, Yuanyuan Yan, Feng Jin, Minjie Wei
Molecular Medicine Reports.2016; 14(6): 5261. CrossRef - Significance of the hedgehog pathway-associated proteins Gli-1 and Gli-2 and the epithelial-mesenchymal transition-associated proteins Twist and E-cadherin in hepatocellular carcinoma
Hyung Wook Chun, Ran Hong
Oncology Letters.2016; 12(3): 1753. CrossRef - Taxane‐induced hedgehog signaling is linked to expansion of breast cancer stem‐like populations after chemotherapy
Jennifer Sims‐Mourtada, Lynn M. Opdenaker, Joshua Davis, Kimberly M. Arnold, Daniel Flynn
Molecular Carcinogenesis.2015; 54(11): 1480. CrossRef - Loss of Tumor Suppressor ARID1A Protein Expression Correlates with Poor Prognosis in Patients with Primary Breast Cancer
Hyun Deuk Cho, Jong Eun Lee, Hae Yoen Jung, Mee-Hye Oh, Ji-Hye Lee, Si-Hyong Jang, Kyung-Ju Kim, Sun Wook Han, Sung Yong Kim, Han Jo Kim, Sang Byung Bae, Hyun Ju Lee
Journal of Breast Cancer.2015; 18(4): 339. CrossRef - Prognostic impact of the expression of Hedgehog proteins in cervical carcinoma FIGO stages I–IV treated with radiotherapy or chemoradiotherapy
Louise Bohr Mordhorst, Cecilia Ahlin, Bengt Sorbe
Gynecologic Oncology.2014; 135(2): 305. CrossRef - Sonic hedgehog signaling may promote invasion and metastasis of oral squamous cell carcinoma by activating MMP-9 and E-cadherin expression
Hai-Xia Fan, Shan Wang, Hong Zhao, Nian Liu, Dong Chen, Miao Sun, Jin-Hua Zheng
Medical Oncology.2014;[Epub] CrossRef
 PubReader
 ePub Link
-
 Cite this Article
- Cite this Article
-
- Close
- Download Citation
- Close
- Figure
-

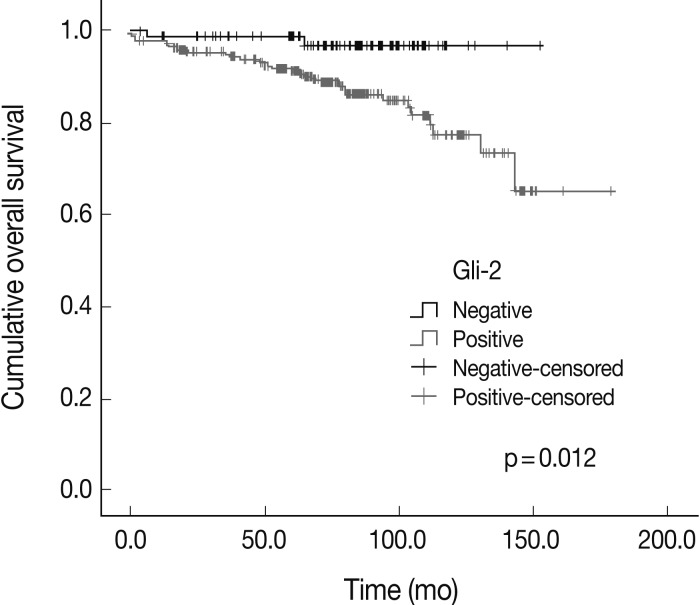


Fig. 1
Fig. 2
| Clinicopathologic factors | No. of cases (%) | No. of positive cases (%) |
|||||
|---|---|---|---|---|---|---|---|
| Shh | Ptch | Smo | Gli-1 | Gli-2 | Gli-3 | ||
| Age (yr) | |||||||
| < 50 | 179 (53.6) | 87 (48.6) | 100 (55.9) | 47 (26.3) | 77 (43.0) | 141 (78.8) | 99 (55.3) |
| > 50 | 155 (46.4) | 77 (49.7) | 83 (53.5) | 28 (18.1) | 64 (41.3) | 111 (71.6) | 92 (59.4) |
| p-value | 0.845 | 0.671 | 0.074 | 0.750 | 0.130 | 0.456 | |
| Size (cm) | |||||||
| < 2 | 129 (38.6) | 60 (46.5) | 72 (55.8) | 30 (23.3) | 57 (44.2) | 95 (73.6) | 85 (65.9) |
| 2-5 | 172 (51.5) | 84 (48.8) | 91 (52.9) | 38 (22.1) | 71 (41.3) | 129 (75.0) | 93 (54.1) |
| > 5 | 33 (9.9) | 20 (60.6) | 20 (60.6) | 7 (21.2) | 13 (39.4) | 28 (84.8) | 13 (39.4) |
| p-value | 0.350 | 0.687 | 0.956 | 0.829 | 0.403 | 0.011 |
|
| Node metastasis | |||||||
| 0 | 179 (53.6) | 84 (46.9) | 96 (53.6) | 40 (22.3) | 80 (44.7) | 136 (76.0) | 111 (62.0) |
| 1-3 | 98 (29.3) | 40 (40.8) | 47 (48.0) | 18 (18.4) | 36 (36.7) | 74 (75.5) | 36 (36.7) |
| > 4 | 57 (17.1) | 40 (70.2) | 40 (70.2) | 17 (29.8) | 25 (43.9) | 42 (73.7) | 44 (77.2) |
| p-value | 0.001 |
0.025 |
0.257 | 0.423 | 0.940 | 0.000 |
|
| Stage | |||||||
| I | 78 (23.4) | 32 (41.0) | 45 (57.7) | 18 (23.1) | 36 (46.2) | 57 (73.1) | 54 (69.2) |
| II | 169 (50.6) | 78 (46.2) | 83 (49.1) | 36 (21.3) | 67 (39.6) | 126 (74.6) | 89 (52.7) |
| III | 81 (24.3) | 48 (59.3) | 49 (60.5) | 19 (23.5) | 33 (40.7) | 63 (77.8) | 45 (55.6) |
| IV | 6 (1.8) | 6 (100.0) | 6 (100.0) | 2 (33.3) | 5 (83.3) | 6 (100.0) | 3 (50.0) |
| p-value | 0.007 |
0.037 |
0.896 | 0.159 | 0.475 | 0.100 | |
| Nuclear grade | |||||||
| 1 | 39 (11.7) | 20 (51.3) | 23 (59.0) | 4 (10.3) | 15 (38.5) | 34 (87.2) | 18 (46.2) |
| 2 | 168 (50.3) | 79 (47.0) | 90 (53.6) | 31 (18.5) | 68 (40.5) | 128 (76.2) | 89 (53.0) |
| 3 | 127 (38.0) | 65 (51.2) | 70 (55.1) | 40 (31.5) | 58 (45.7) | 90 (70.9) | 84 (66.1) |
| p-value | 0.747 | 0.826 | 0.004 |
0.590 | 0.112 | 0.026 |
|
| Histologic grade | |||||||
| 1 | 75 (22.5) | 34 (45.3) | 40 (53.3) | 9 (12.0) | 35 (46.7) | 61 (81.3) | 42 (56.0) |
| 2 | 136 (40.7) | 64 (47.1) | 73 (53.7) | 28 (20.6) | 61 (44.9) | 105 (77.2) | 81 (59.6) |
| 3 | 123 (36.8) | 66 (53.7) | 70 (56.9) | 38 (30.9) | 45 (36.6) | 86 (69.9) | 68 (55.3) |
| p-value | 0.433 | 0.837 | 0.007 |
0.273 | 0.160 | 0.764 | |
| ER | |||||||
| – | 154 (46.1) | 79 (51.3) | 67 (43.5) | 48 (31.2) | 53 (34.4) | 102 (66.2) | 75 (48.7) |
| + | 180 (53.9) | 85 (47.2) | 116 (64.4) | 27 (15.0) | 88 (48.9) | 150 (83.3) | 116 (64.4) |
| p-value | 0.458 | 0.000 |
0.000 |
0.008 |
0.000 |
0.004 |
|
| PR | |||||||
| – | 184 (55.1) | 95 (51.6) | 97 (52.7) | 54 (29.3) | 68 (37.0) | 139 (75.5) | 92 (50.0) |
| + | 150 (44.9) | 69 (46.0) | 86 (57.3) | 21 (14.0) | 73 (48.7) | 113 (75.3) | 99 (66.0) |
| p-value | 0.306 | 0.399 | 0.001 |
0.031 |
0.965 | 0.003 |
|
| HER2 | |||||||
| – | 251 (75.1) | 108 (43.0) | 144 (57.4) | 52 (20.7) | 107 (42.6) | 193 (76.9) | 144 (57.4) |
| + | 83 (24.9) | 56 (67.5) | 39 (47.0) | 23 (27.7) | 34 (41.0) | 59 (71.1) | 47 (56.6) |
| p-value | 0.000 |
0.099 | 0.186 | 0.790 | 0.287 | 0.905 | |
| Total (n = 290) |
LumA (n = 67) | LumB HER2 neg (n = 43) | LumB HER2 pos (n = 25) | HER2 (n = 58) | Triple negative (n = 97) | p-value | |
|---|---|---|---|---|---|---|---|
| Shh | |||||||
| – | 147 (50.7) | 33 (49.3) | 27 (62.8) | 12 (48.0) | 15 (25.9) | 60 (61.9) | 0.000 |
| + | 143 (49.3) | 34 (50.7) | 16 (37.2) | 13 (52.0) | 43 (74.1) | 37 (38.1) | |
| Ptch | |||||||
| – | 132 (45.5) | 21 (31.3) | 10 (23.3) | 13 (52.0) | 31 (53.4) | 57 (58.8) | 0.000 |
| + | 158 (54.5) | 46 (68.7) | 33 (76.7) | 12 (48.0) | 27 (46.6) | 40 (41.2) | |
| Smo | |||||||
| – | 225 (77.6) | 58 (86.6) | 40 (93.0) | 20 (80.0) | 40 (69.0) | 67 (69.1) | 0.004 |
| + | 65 (22.4) | 9 (13.4) | 3 (7.0) | 5 (20.0) | 18 (31.0) | 30 (30.9) | |
| Gli-1 | |||||||
| – | 171 (59.0) | 35 (52.2) | 25 (58.1) | 9 (36.0) | 40 (69.0) | 62 (63.9) | 0.039 |
| + | 119 (41.0) | 32 (47.8) | 18 (41.9) | 16 (64.0) | 18 (31.0) | 35 (36.1) | |
| Gli-2 | |||||||
| – | 75 (25.9) | 10 (14.9) | 8 (18.6) | 5 (20.0) | 20 (34.5) | 32 (33.0) | 0.031 |
| + | 215 (74.1) | 57 (85.1) | 35 (81.4) | 20 (80.0) | 38 (65.5) | 65 (67.0) | |
| Gli-3 | |||||||
| – | 122 (42.1) | 17 (25.4) | 20 (46.5) | 6 (24.0) | 30 (51.7) | 49 (50.5) | 0.003 |
| + | 168 (57.9) | 50 (74.6) | 23 (53.5) | 19 (76.0) | 28 (48.3) | 48 (49.5) |
| Breast carcinoma (n = 322) |
||||
|---|---|---|---|---|
| Total | No. of deceased | p-value | ||
| Age (yr) | < 50 | 170 | 17 | 0.233 |
| ≥ 50 | 152 | 19 | ||
| Stage | I | 73 | 2 | 0.000 |
| II | 163 | 14 | ||
| III | 80 | 16 | ||
| IV | 6 | 4 | ||
| Phenotype | LumA | 67 | 1 | 0.130 |
| LumB HER2 neg | 43 | 8 | ||
| LumB HER2 pos | 25 | 1 | ||
| HER2 | 58 | 5 | ||
| Triple negative | 97 | 9 | ||
| Shh | – | 167 | 17 | 0.447 |
| + | 155 | 19 | ||
| Ptch | – | 147 | 15 | 0.638 |
| + | 175 | 21 | ||
| Smo | – | 252 | 27 | 0.695 |
| + | 70 | 9 | ||
| Gli-1 | – | 186 | 25 | 0.354 |
| + | 136 | 11 | ||
| Gli-2 | – | 79 | 2 | 0.012 |
| + | 243 | 34 | ||
| Gli-3 | – | 139 | 21 | 0.469 |
| + | 183 | 15 | ||
Shh, sonic hedgehog; Ptch, patched; Smo, smoothened; Gli, glioma-associated oncogenes; ER, estrogen receptor; PR, progesterone receptor; HER2, human epidermal growth factor receptor 2. Statistically significant (p<0.05).
Values are presented as number (%). LumA, luminal A; LumB HER2 neg, luminal B HER2 negative; LumB HER pos, luminal B HER2 positive; Shh, sonic hedgehog; Ptch, patched; Smo, smoothened; Gli, glioma-associated oncogenes. Statistically significant (p<0.05). Classification is only available in 290 cases.
LumA, luminal A; LumB HER2 neg, luminal B HER2 negative; LumB HER pos, luminal B HER2 positive; Shh, sonic hedgehog; Ptch, patched; Smo, smoothened; Gli, glioma-associated oncogenes. Statistically significant (p<0.05).

