 E-submission
Articles
- Page Path
- HOME > J Pathol Transl Med > Volume 47(3); 2013 > Article
-
Original Article
Histopathologic Predictors of Lymph Node Metastasis and Prognosis in Tonsillar Squamous Cell Carcinoma - Dong Jin Lee,, Mi Jung Kwon1,, Eun Sook Nam2, Ji Hyun Kwon2, Jin Hwan Kim3, Young-Soo Rho3, Hyung Sik Shin2, Seong Jin Cho2
-
Korean Journal of Pathology 2013;47(3):203-210.
DOI: https://doi.org/10.4132/KoreanJPathol.2013.47.3.203
Published online: June 25, 2013
Department of Otorhinolaryngology-Head and Neck Surgery, Hallym University Kangnam Sacred Heart Hospital, Hallym University College of Medicine, Seoul, Korea.
1Department of Pathology, Hallym University Sacred Heart Hospital, Hallym University College of Medicine, Anyang, Korea.
2Department of Pathology, Ilsong Memorial Institute of Head and Neck Cancer, Hallym University Kangdong Sacred Heart Hospital, Hallym University College of Medicine, Seoul, Korea.
3Department of Otorhinolaryngology-Head and Neck Surgery, Ilsong Memorial Institute of Head and Neck Cancer, Hallym University Kangdong Sacred Heart Hospital, Hallym University College of Medicine, Seoul, Korea.
- Corresponding Author: Seong Jin Cho, M.D., Hyung Sik Shin, M.D. Department of Pathology, Kangdong Sacred-Heart Hospital, Hallym University College of Medicine, 150 Seongan-ro, Gangdong-gu, Seoul 134-701, Korea. Tel: +82-2-2224-2557, Fax: +82-2-2224-2214, apilas@hanmail.net
- *Dong Jin Lee and Mi Jung Kwon contributed equally to this work.
© 2013 The Korean Society of Pathologists/The Korean Society for Cytopathology
This is an Open Access article distributed under the terms of the Creative Commons Attribution Non-Commercial License (http://creativecommons.org/licenses/by-nc/3.0/) which permits unrestricted non-commercial use, distribution, and reproduction in any medium, provided the original work is properly cited.

Figure & Data
References
Citations
- Muscle invasion as a reliable prognostic marker of oral squamous cell carcinoma: A clinicopathological study
Raktim Mukherjee, Soumya Dey, Ebrahim Mohammad, Iqbal Khan, Keya Basu, Uttara Chatterjee
Indian Journal of Pathology and Microbiology.2026; 69(1): 59. CrossRef - A Systematic Review of Occult Contralateral Neck Metastasis in Tonsillar Squamous Cell Carcinoma
Nihal Punjabi, Arjun Sharma, Jamie Park, Kari Kennedy, Jared C. Inman
The Laryngoscope.2025; 135(1): 27. CrossRef - OpenAi’s ChatGPT-4, BARD and YOU.com (AI) and the Cancer Patient, for Now, Caveat Emptor, but Stay Tuned
Glenn Tisman, Raju Seetharam
Digital Medicine and Healthcare Technology.2023;[Epub] CrossRef - Comprehensive Transcriptome Analysis Reveals the Distinct Gene Expression Patterns of Tumor Microenvironment in HPV-Associated and HPV-Non Associated Tonsillar Squamous Cell Carcinoma
Reham M. Alahmadi, Najat Marraiki, Mohammed Alswayyed, Hatim A. Khoja, Abdullah E. Al-Anazi, Rawan M. Alahmadi, Meshael M. Alkusayer, Bandar Alosaimi, Maaweya Awadalla
Cancers.2023; 15(23): 5548. CrossRef - Predictors of contralateral‐bilateral nodal disease in oropharyngeal cancer: A National Cancer Data Base Study
Masanari G. Kato, Mark A. Ellis, Shaun A. Nguyen, Terry A. Day
Head & Neck.2018; 40(2): 338. CrossRef - Clinical implication of programmed cell death-1 ligand-1 expression in tonsillar squamous cell carcinoma in association with intratumoral heterogeneity, human papillomavirus, and epithelial-to-mesenchymal transition
Mi Jung Kwon, Young-Soo Rho, Eun Sook Nam, Seong Jin Cho, Hye-Rim Park, Soo Kee Min, Jinwon Seo, Ji-Young Choe, Eun Soo Kim, Bumjung Park, Mineui Hong, Kyueng-Whan Min
Human Pathology.2018; 80: 28. CrossRef - Comparison of the eighth version of the American Joint Committee on Cancer manual to the seventh version for colorectal cancer: A retrospective review of our data
Guo-Jun Tong, Gui-Yang Zhang, Jian Liu, Zhao-Zheng Zheng, Yan Chen, Ping-Ping Niu, Xu-Ting Xu
World Journal of Clinical Oncology.2018; 9(7): 148. CrossRef - HIPK2 Overexpression and Its Prognostic Role in Human Papillomavirus-Positive Tonsillar Squamous Cell Carcinoma
Mi Jung Kwon, So Young Kang, Eun Sook Nam, Seong Jin Cho, Young-Soo Rho
BioMed Research International.2017; 2017: 1. CrossRef - Frequent hepatocyte growth factor overexpression and low frequency of c-Met gene amplification in human papillomavirus–negative tonsillar squamous cell carcinoma and their prognostic significances
Mi Jung Kwon, Dong Hoon Kim, Hye-Rim Park, Hyung Sik Shin, Ji Hyun Kwon, Dong Jin Lee, Jin Hwan Kim, Seong Jin Cho, Eun Sook Nam
Human Pathology.2014; 45(7): 1327. CrossRef - CT and MR imaging findings of palatal tumors
Hiroki Kato, Masayuki Kanematsu, Hiroki Makita, Keizo Kato, Daijiro Hatakeyama, Toshiyuki Shibata, Keisuke Mizuta, Mitsuhiro Aoki
European Journal of Radiology.2014; 83(3): e137. CrossRef
 PubReader
 ePub Link
-
 Cite this Article
- Cite this Article
-
- Close
- Download Citation
- Close
- Figure
-
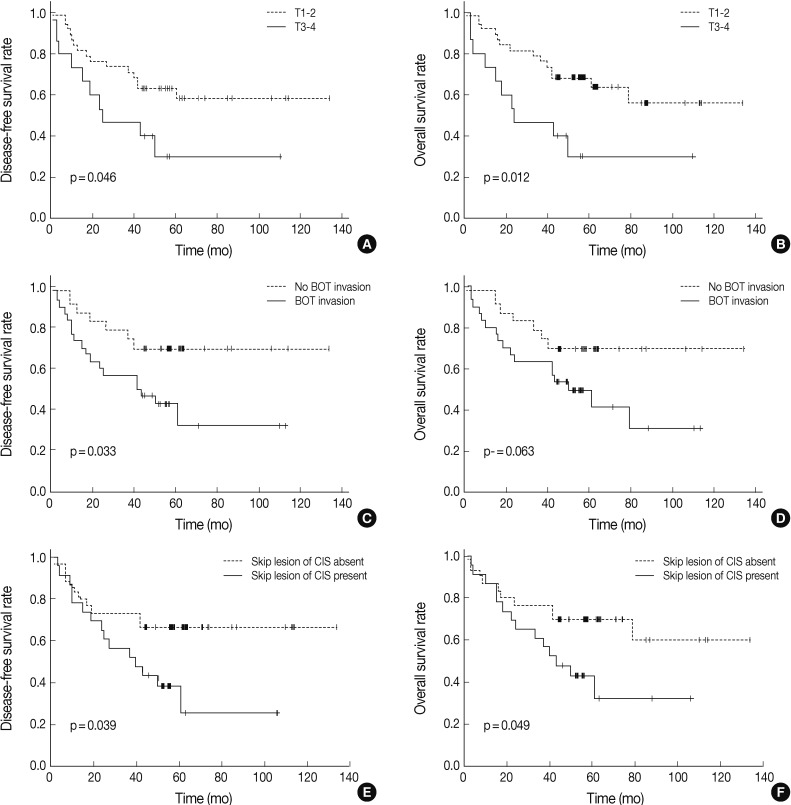

Fig. 1
| Variable | Ipsilateral LNM |
p-value | Contralateral LNM |
p-value | ||
|---|---|---|---|---|---|---|
| Absent | Present | Absent | Present | |||
| Age (yr) | 0.732 | 0.242 | ||||
| ≤ 50 | 4 | 13 | 16 | 1 | ||
| > 50 | 7 | 29 | 28 | 8 | ||
| Gender | 1.000 | 0.574 | ||||
| Male | 10 | 38 | 39 | 9 | ||
| Female | 1 | 4 | 5 | 0 | ||
| Smoking (pack-yr) | 0.098 | 1.000 | ||||
| < 20 | 0 | 10 | 9 | 1 | ||
| ≥ 20 | 11 | 32 | 35 | 8 | ||
| Alcohol (drink/wk) | 0.094 | 0.054 | ||||
| < 14 | 0 | 11 | 7 | 4 | ||
| ≥ 14 | 11 | 31 | 37 | 5 | ||
| Tumor side | 0.256 | 1.000 | ||||
| Right | 5 | 27 | 26 | 6 | ||
| Left | 6 | 15 | 18 | 3 | ||
| T stage | 1.000 | 0.046 |
||||
| T1-2 | 8 | 30 | 34 | 4 | ||
| T3-4 | 3 | 12 | 10 | 5 | ||
| BOT invasion | 4 | 26 | 0.177 | 22 | 8 | 0.061 |
| No invasion | 7 | 16 | 22 | 1 | ||
| Soft palate invasion | 3 | 23 | 0.175 | 18 | 8 | 0.011 |
| No invasion | 8 | 19 | 26 | 1 | ||
| PM invasion | 2 | 7 | 0.905 | 7 | 2 | 0.646 |
| No invasion | 9 | 35 | 37 | 7 | ||
| PPW invasion | 2 | 9 | 1.000 | 7 | 4 | 0.054 |
| No invasion | 9 | 33 | 37 | 5 | ||
| NP invasion | 0 | 3 | 1.000 | 3 | 0 | 1.000 |
| No invasion | 11 | 39 | 41 | 9 | ||
| Variable | Ipsilateral LNM |
p-value | Contralateral LNM |
p-value | ||
|---|---|---|---|---|---|---|
| Absent | Present | Absent | Present | |||
| Histologic grade | 0.482 | 1.000 | ||||
| WD or MD | 9 | 29 | 31 | 7 | ||
| PD | 2 | 13 | 13 | 2 | ||
| Adjacent dysplasia | 0.327 | 0.728 | ||||
| Present | 7 | 19 | 21 | 5 | ||
| Absent | 4 | 23 | 23 | 4 | ||
| In situ SCC | 0.488 | 0.160 | ||||
| Present | 5 | 24 | 22 | 7 | ||
| Absent | 6 | 18 | 22 | 2 | ||
| Skip lesion of CIS | 0.313 | 0.278 | ||||
| Present | 7 | 18 | 19 | 6 | ||
| Absent | 4 | 24 | 25 | 3 | ||
| Tumor necrosis | 1.000 | 0.701 | ||||
| Present | 3 | 14 | 15 | 2 | ||
| Absent | 8 | 28 | 29 | 7 | ||
| Invasive front | 0.183 | 0.148 | ||||
| Cohesive | 8 | 20 | 21 | 7 | ||
| Non-cohesive | 3 | 22 | 23 | 2 | ||
| Depth of invasion (cm) | 1.000 | 0.822 | ||||
| ≤ 2 | 8 | 29 | 31 | 6 | ||
| > 2 | 3 | 13 | 13 | 3 | ||
| Lymphatic invasion | < 0.001 |
0.092 | ||||
| Present | 3 | 37 | 31 | 9 | ||
| Absent | 8 | 5 | 13 | 0 | ||
| Muscle invasion | 0.002 |
0.701 | ||||
| Present | 3 | 33 | 29 | 7 | ||
| Absent | 8 | 9 | 15 | 2 | ||
| Perineural invasion | 0.322 | 1.000 | ||||
| Present | 0 | 7 | 6 | 1 | ||
| Absent | 11 | 35 | 38 | 8 | ||
| Ipsilateral ECS | < 0.001 |
0.010 |
||||
| Present | 0 | 33 | 24 | 9 | ||
| Absent | 11 | 9 | 20 | 0 | ||
| Disease-free survival (p-value) | Overall survival (p-value) | |
|---|---|---|
| Age (≤ 50 yr vs > 50 yr) | 0.137 | 0.064 |
| Sex (female vs male) | 0.289 | 0.277 |
| Smoking (< 20 pack-yr vs ≥ 20 pack-yr) | 0.055 | 0.071 |
| Alcohol (< 14 drink/wk vs ≥ 14 drink/wk) | 0.808 | 0.440 |
| T stage (T1,2 vs T3,4) | 0.046 |
0.012 |
| N stage (N0 vs N1,2,3) | 0.304 | 0.447 |
| Stage (I-II vs III-IV) | 0.539 | 0.658 |
| BOT invasion (no vs yes) | 0.033 |
0.063 |
| Soft palate invasion (no vs yes) | 0.131 | 0.241 |
| Pterygoid muscle invasion (no vs yes) | 0.083 | 0.094 |
| PPW invasion (no vs yes) | 0.186 | 0.082 |
| Histologic grade (WD, MD vs PD) | 0.070 | 0.067 |
| Adjacent dysplasia (no vs yes) | 0.059 | 0.097 |
| In situ SCC (no vs yes) | 0.480 | 0.330 |
| Skip lesion of CIS (no vs yes) | 0.039 |
0.049 |
| Tumor necrosis (no vs yes) | 0.361 | 0.200 |
| Invasive front (cohesive vs noncohesive) | 0.115 | 0.286 |
| Depth of invasion (≤ 2 cm vs > 2 cm) | 0.159 | 0.107 |
| Lymphatic invasion (no vs yes) | 0.210 | 0.319 |
| Perineural invasion (no vs yes) | 0.140 | 0.521 |
| Superior constrictor muscle invasion (no vs yes) | 0.108 | 0.172 |
| Disease-free survival |
p-value | Overall survival |
p-value | |||
|---|---|---|---|---|---|---|
| HR | 95% CI | HR | 95% CI | |||
| BOT invasion | 1.968 | 0.727-5.328 | 0.183 | - | - | - |
| Skip lesion of CIS | 2.189 | 1.975-4.914 | 0.048 |
2.230 | 0.979-5.081 | 0.056 |
| T1,2 vs T3,4 | 1.567 | 0.628-3.913 | 0.336 | 3.060 | 1.071-8.746 | 0.019 |
TSCC, tonsillar squamous cell carcinoma; LNM, cervical lymph node metastasis; BOT, base of tongue; PM, pteryoid muscle; PPW, posterior pharyngeal wall; NP, nasopharynx. Statistically significant values.
TSCC, tonsillar squamous cell carcinoma; LNM, cervical lymph node metastasis; WD, well differentiated; MD, moderately differentiated; PD, poorly differentiated; SCC, squamous cell carcinoma; CIS, carcinoma Statistically significant values.
BOT, base of tongue; PPW, posterior pharyngeal wall; WD, well differentiated; MD, moderately differentiated; PD, poorly differentiated; SCC, squamous cell carcinoma; CIS, carcinoma Statistically significant values.
TSCC, tonsillar squamous cell carcinoma; HR, hazard ratio; CI, confidence interval; BOT, base of tongue; CIS, carcinoma Statistically significant values.

