 E-submission
Articles
- Page Path
- HOME > J Pathol Transl Med > Volume 47(3); 2013 > Article
-
Original Article
Prognostic Significance of Heat Shock Protein 70 Expression in Early Gastric Carcinoma - Youngran Kang,, Woon Yong Jung,, Hyunjoo Lee1, Wonkyung Jung, Eunjung Lee, Bong Kyung Shin, Aeree Kim, Han Kyeom Kim, Baek-hui Kim
-
Korean Journal of Pathology 2013;47(3):219-226.
DOI: https://doi.org/10.4132/KoreanJPathol.2013.47.3.219
Published online: June 25, 2013
Department of Pathology, Korea University Guro Hospital, Korea University College of Medicine, Seoul, Korea.
1Department of Pathology, Kangbuk Samsung Hospital, Sungkyunkwan University School of Medicine, Seoul, Korea.
- Corresponding Author: Baek-hui Kim, M.D. Department of Pathology, Korea University Guro Hospital, Korea University College of Medicine, 148 Gurodong-ro, Guro-gu, Seoul 152-703, Korea. Tel: +82-2-2626-3255, Fax: +82-2-2626-1486, maelstrom@naver.com
*Youngran Kang and Woon Yong Jung contributed equally to this work.
© 2013 The Korean Society of Pathologists/The Korean Society for Cytopathology
This is an Open Access article distributed under the terms of the Creative Commons Attribution Non-Commercial License (http://creativecommons.org/licenses/by-nc/3.0/) which permits unrestricted non-commercial use, distribution, and reproduction in any medium, provided the original work is properly cited.
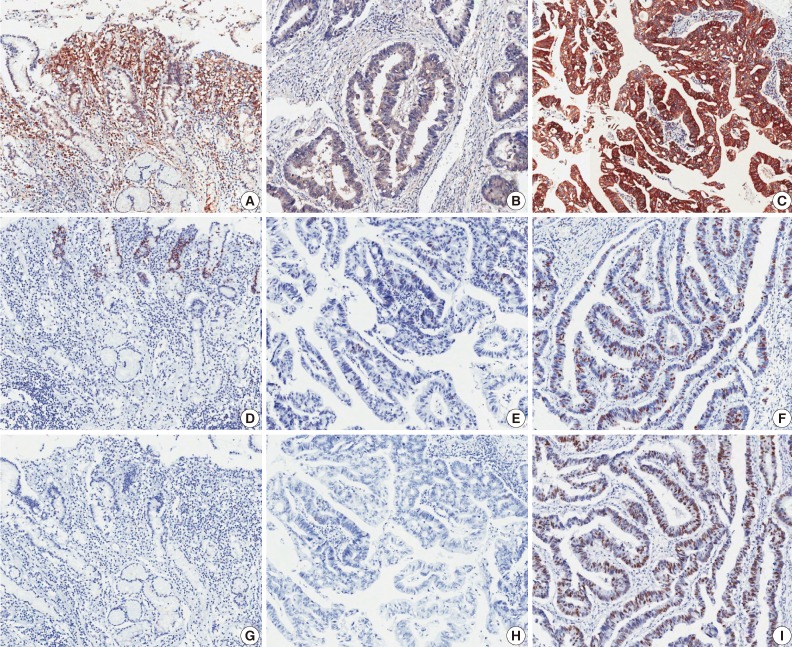
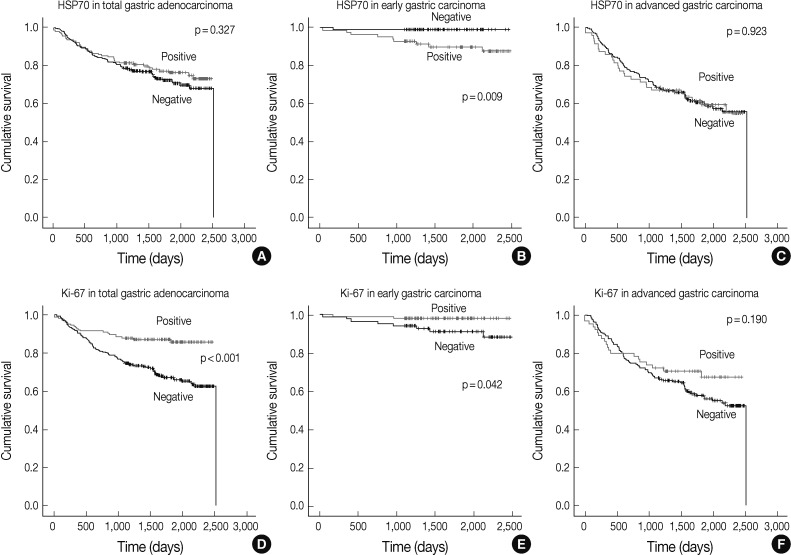
Figure & Data
References
Citations
- The Prognostic Importance of Ki-67 in Gastrointestinal Carcinomas: A Meta-analysis and Multi-omics Approach
Mahdieh Razmi, Fatemeh Tajik, Farideh Hashemi, Ayna Yazdanpanah, Fatemeh Hashemi-Niasari, Adeleh Divsalar
Journal of Gastrointestinal Cancer.2024; 55(2): 599. CrossRef - Clinicopathological significance of HSP70 expression in gastric cancer: a systematic review and meta-analysis
Xiaolu Wang, Li Xie, Lijing Zhu
BMC Gastroenterology.2021;[Epub] CrossRef - Beta-sheet-specific interactions with heat shock proteins define a mechanism of delayed tumor cell death in response to HAMLET
Aftab Nadeem, James C.S. Ho, Tuan Hiep Tran, Sanchari Paul, Victoria Granqvist, Nadege Despretz, Catharina Svanborg
Journal of Molecular Biology.2019; 431(14): 2612. CrossRef - Evolving paradigms on the interplay of mitochondrial Hsp70 chaperone system in cell survival and senescence
Shubhi Srivastava, Vinaya Vishwanathan, Abhijit Birje, Devanjan Sinha, Patrick D’Silva
Critical Reviews in Biochemistry and Molecular Biology.2019; 54(6): 517. CrossRef - Clinicopathologic significance and prognostic value of Ki-67 expression in patients with gastric cancer: a meta-analysis
Guanying Luo, Yunzhao Hu, Zhiqiao Zhang, Peng Wang, Zhaowen Luo, Jinxin Lin, Canchang Cheng, You Yang
Oncotarget.2017; 8(30): 50273. CrossRef - Extracellular HSP70-peptide complexes promote the proliferation of hepatocellular carcinoma cells via TLR2/4/JNK1/2MAPK pathway
Yi Zhe, Yan Li, Dan Liu, Dong-Ming Su, Jin-Gang Liu, Hang-Yu Li
Tumor Biology.2016; 37(10): 13951. CrossRef - The cytomegalovirus protein UL138 induces apoptosis of gastric cancer cells by binding to heat shock protein 70
Wenjing Chen, Kezhi Lin, Liang Zhang, Gangqiang Guo, Xiangwei Sun, Jing Chen, Lulu Ye, Sisi Ye, Chenchen Mao, Jianfeng Xu, Lifang Zhang, Lubin Jiang, Xian Shen, Xiangyang Xue
Oncotarget.2016; 7(5): 5630. CrossRef - Targeting the hsp70 gene delays mammary tumor initiation and inhibits tumor cell metastasis
J Gong, D Weng, T Eguchi, A Murshid, M Y Sherman, B Song, S K Calderwood
Oncogene.2015; 34(43): 5460. CrossRef
 PubReader
 ePub Link
-
 Cite this Article
- Cite this Article
-
- Close
- Download Citation
- Close
- Figure
-


Fig. 1
Fig. 2
| Clinicopathologic characteristic | All gastric carcinoma (EGC and AGC) |
EGC |
AGC |
|||||||
|---|---|---|---|---|---|---|---|---|---|---|
| No. of patients | HSP70 |
No. of patients | HSP70 |
No. of patients | HSP70 |
|||||
| Positive | p-value | Positive | p-value | Positive | p-value | |||||
| Total | 458 | 155 (34) | 184 | 85 (46) | 274 | 70 (26) | ||||
| Sex | Male | 311 | 113 (36) | 0.101 | 123 | 56 (46) | 0.797 | 188 | 57 (30) | 0.007 |
| Female | 147 | 42 (29) | 61 | 29 (48) | 86 | 13 (15) | ||||
| Age (yr) | < 60 | 214 | 79 (37) | 0.193 | 86 | 44 (51) | 0.206 | 128 | 35 (27) | 0.523 |
| ≥ 60 | 244 | 76 (31) | 98 | 41 (42) | 146 | 35 (24) | ||||
| Histologic grade | WD | 74 | 26 (35) | 0.007 | 56 | 24 (43) | 0.538 | 18 | 2 (11) | 0.046 |
| MD | 165 | 74 (45) | 83 | 39 (47) | 82 | 35 (43) | ||||
| PD | 219 | 55 (25) | 45 | 22 (49) | 174 | 33 (19) | ||||
| Lauren classification | Intestinal | 239 | 100 (42) | < 0.001 | 139 | 63 (45) | 0.677 | 100 | 37 (37) | 0.001 |
| Diffuse | 219 | 55 (25) | 45 | 22 (49) | 174 | 33 (19) | ||||
| pT category |
pT1 | 184 | 85 (46) | < 0.001 | 184 | 85 (46) | NA | NA | NA | NA |
| pT2 | 62 | 19 (31) | NA | NA | 62 | 19 (31) | ||||
| pT3 | 63 | 11 (17) | NA | NA | 63 | 11 (17) | ||||
| pT4 | 149 | 40 (27) | NA | NA | 149 | 40 (27) | ||||
| Mucosal or submucosal invasion depth (EGC only) |
LP | NA | NA | NA | 62 | 29 (47) | 0.540 | NA | NA | NA |
| MM | NA | NA | 23 | 6 (26) | NA | NA | ||||
| SM1 | NA | NA | 31 | 14 (45) | NA | NA | ||||
| SM2 | NA | NA | 29 | 20 (69) | NA | NA | ||||
| SM3 | NA | NA | 39 | 16 (41) | NA | NA | ||||
| pN category |
pN0 | 242 | 98 (40) | < 0.001 | 165 | 77 (47) | 0.534 | 77 | 21 (27) | 0.270 |
| pN1 | 52 | 20 (38) | 10 | 5 (50) | 42 | 15 (36) | ||||
| pN2 | 51 | 11 (22) | 6 | 2 (33) | 45 | 9 (20) | ||||
| pN3 | 113 | 26 (23) | 3 | 1 (33) | 110 | 25 (23) | ||||
| TNM stage |
I | 208 | 91 (44) | < 0.001 | 175 | 82 (47) | 0.429 | 33 | 9 (27) | 0.343 |
| II | 89 | 28 (31) | 9 | 3 (33) | 80 | 25 (31) | ||||
| III | 147 | 32 (22) | 0 | 0 (0) | 147 | 32 (22) | ||||
| IV | 14 | 4 (29) | 0 | 0 (0) | 14 | 4 (29) | ||||
| Lymphatic invasion | Present | 150 | 45 (30) | 0.225 | 23 | 11 (48) | 0.867 | 127 | 34 (27) | 0.666 |
| Absent | 308 | 110 (36) | 161 | 74 (46) | 147 | 36 (24) | ||||
| p53 | Positive | 163 | 59 (36) | 0.429 | 59 | 30 (51) | 0.385 | 104 | 29 (28) | 0.488 |
| Negative | 295 | 96 (33) | 125 | 55 (44) | 170 | 64 (24) | ||||
| Ki-67 | Positive | 165 | 63 (38) | 0.141 | 100 | 37 (37) | 0.006 | 65 | 26 (40) | 0.002 |
| Negative | 293 | 92 (31) | 84 | 48 (58) | 209 | 44 (21) | ||||
| Variable | Parameter | p-value | Hazard ratio | 95% CI |
|---|---|---|---|---|
| Lymph node metastasis | Present vs absent | 0.003 | 10.162 | 2.185-47.265 |
| Invasion depth | Submucosa vs mucosa | 0.015 | 6.051 | 1.413-25.918 |
| Histologic grade | PD vs WD and MD | 0.179 | 0.313 | 0.058-1.702 |
| HSP70 expresssion | Present vs absent | 0.024 | 11.497 | 1.388-95.233 |
| Ki-67 expression | Present vs absent | 0.039 | 0.178 | 0.034-0.917 |
Values are presented as number (%). HSP70, heat shock protein 70; EGC, early gastric cancer; AGC, advanced gastric cancer; NA, not applicable; WD, well differentiated; MD, moderately differentiated; PD, poorly differentiated; LP, lamina propria; MM, muscularis mucosa; SM, submucosa. AJCC Cancer Staging Manual, 7th edition; Japanese Classification of Gastric Carcinoma, 2nd edition.
CI, confidence interval; PD, poorly differentiated; WD, well differentiated; MD, moderately differentiated; HSP70, heat shock protein 70.

