 E-submission
Articles
- Page Path
- HOME > J Pathol Transl Med > Volume 47(5); 2013 > Article
-
Original Article
MAD2 Expression in Ovarian Carcinoma: Different Expression Patterns and Levels among Various Types of Ovarian Carcinoma and Its Prognostic Significance in High-Grade Serous Carcinoma - Po Eun Park, Ji Yun Jeong, Sun Zoo Kim, Ji Young Park
-
Korean Journal of Pathology 2013;47(5):418-425.
DOI: https://doi.org/10.4132/KoreanJPathol.2013.47.5.418
Published online: October 25, 2013
Department of Pathology, Kyungpook National University Hospital, Kyungpook National University School of Medicine, Daegu, Korea.
- Corresponding Author: Ji Young Park, M.D. Department of Pathology, Kyungpook National University Hospital, Kyungpook National University School of Medicine, 130 Dongdeok-ro, Jung-gu, Daegu 700-721, Korea. Tel: +82-53-420-5247, Fax: +82-53-426-1525, jyparkmd@knu.ac.kr
© 2013 The Korean Society of Pathologists/The Korean Society for Cytopathology
This is an Open Access article distributed under the terms of the Creative Commons Attribution Non-Commercial License (http://creativecommons.org/licenses/by-nc/3.0/) which permits unrestricted non-commercial use, distribution, and reproduction in any medium, provided the original work is properly cited.
Abstract
-
Background
- Mitotic arrest deficiency protein 2 (MAD2) is a key component of spindle assembly checkpoint function, which mediates cell apoptosis through microtubule kinetics. Aberrant expression of MAD2 is believed to be associated with the development of chromosome instability. MAD2 also has a signihicant role in cellular drug resistance to taxane chemotherapeutic agents.
-
Methods
- Expression of MAD2 and p53 was investigated using immunohistochemistry in 85 cases of ovarian carcinomas. Clinicopathological data including progression-free survival were analyzed.
-
Results
- A significant (p=.035) association was observed between the grade of serous carcinoma and the expression level of MAD2. While low-grade serous carcinoma showed a low-level expression of MAD2, high-grade serous carcinoma showed a high-level expression of MAD2. We also determined that low-level expression of MAD2 was associated with reduced progression-free survival (PFS) (p=.016) in high-grade serous carcinoma.
-
Conclusions
- MAD2 expression in ovarian carcinoma is related to the grade of serous carcinoma and PFS of high-grade serous carcinoma. Expression level of MAD2 detected by immunohistochemistry may serve as an indicator in predicting the response of microtubule-interfering chemotherapeutic agents.
- Patients and histopathological data
- A total of 85 cases of ovarian carcinoma were analyzed in this study. All samples were obtained from patients undergoing laparotomy for ovarian carcinoma between 2007 and 2012.
- For histologic examination, formalin-fixed and paraffin-embedded (FFPE) tumor sections obtained from resected specimens, including serous carcinoma (n=44), mucinous carcinoma (n=19), endometrioid carcinoma (n=10), clear cell carcinoma (n=10), and transitional cell carcinoma (n=2), were cut and stained with hematoxylin and eosin. Two experienced gynecologic pathologists interpreted all tumor sections and independently assessed the histologic diagnosis and grading. Nuclear grade was evaluated according to the MD Anderson Cancer Center (MDACC) binary grading system in serous and endometrioid carcinoma.12 All ovarian carcinomas were classified as type I or type II according to a new model for pathogenesis of ovarian cancer, based on recently proposed clinical, pathological, and molecular genetic studies.13 For each case, clinical variables such as age, stage, follow-up period, type of debulking surgery, existence of tumor relapse, and chemotherapeutic agents used were collected retrospectively. Stage was reevaluated according to the seventh edition of American Joint Committee on Cancer (AJCC) guidelines, and follow-up period was estimated from the date of the debulking surgery to the date of death from disease progression. Deaths from causes other than disease progression and non-relapsing patients at the date of final contact were censored. Optimal debulking was defined as no residual tumor greater than 1 cm in diameter, and suboptimal debulking was defined as the presence of a residual tumor with a diameter greater than 1 cm. Tumor relapse was defined as a radiological or pathological diagnosis of recurrent disease after surgery. All patients, excepting 7 cases of stage Ia mucinous carcinoma and 7 cases of serous carcinoma who refused adjuvant treatment or whose data was lost just after the surgery, received adjuvant combination chemotherapy of carboplatin with paclitaxel.
- Immunohistochemistry
- Immunohistochemical studies were performed on FFPE tumor sections using the Ventana Benchmark XT immunostainer (Roche, Tucson, AZ, USA) autosomal platform system. Anti-MAD2 antibody (BD Transduction Laboratories, Franklin Lakes, NJ, USA) was diluted to 1:100. Immunohistochemistry (IHC) of p53 was also performed using the same protocol but with Dako monoclonal mouse p53 protein.
- Immunohistochemistry scoring
- Light microscopic examination was performed without the given clinicopathological data. A semi-quantitative and two-step evaluation was used to evaluate MAD2 expression. First, the intensity of the nuclear or cytoplasmic staining of MAD2 was scored as: 1+, weak; 2+, moderate; 3+, strong. The percentage of tumor cells showing an intensity score greater than 2+, moderate was then estimated in 10 vision fields at ×400 magnification. The final MAD2 score as a percentage of tumor cells was graded as follows: score 0, 0-5%; score 1, 6-25%; score 2, 26-50%; score 3, 51-75%; score 4, 76-100%. According to this scoring system, expression of MAD2 was divided into two groups: low-level expression of MAD2 (MAD2-L, with a score ≤1) and high-level expression of MAD2 (MAD2-H, with a score ≥2).
- When scoring p53 expression, 10 vision fields at ×400 magnification were also examined, and the percentage of positive cells regardless of intensity was calculated. p53 IHC was graded as positive if 10% or more of the tumor cells were stained and negative if the percentage of stained tumor cells was less than 10%.
- Statistical analysis
- We attempted to correlate clinicopathological variables such as age, stage, and histological classification with expression levels of MAD2 and p53 protein using the χ2 test and Fisher's exact test. Uni- and multivariate analyses of variables for PFS were performed using Cox's proportional hazard regression model. The Kaplan-Meier method with log-rank test was used in the generation and comparison of the PFS curve. SPSS ver. 18.0 (IBM, Armonk, NY, USA) was used for data analysis, and p<.05 was considered statistically significant.
MATERIALS AND METHODS
- Patients and tumor characteristics associated with MAD2 and p53 expression
- The mean age of patients at the time of diagnosis was 52.2 years (range, 18 to 78 years). Staging according to the seventh edition of AJCC guidelines demonstrated stage I disease in 39 cases, stage II disease in 5 cases, stage III disease in 28 cases, and stage IV disease in 13 cases. The mean follow-up period was 24.7 months (range, 0 to 79 months). Among 37 cases of high-grade serous carcinoma, 5 cases underwent suboptimal debulking surgery.
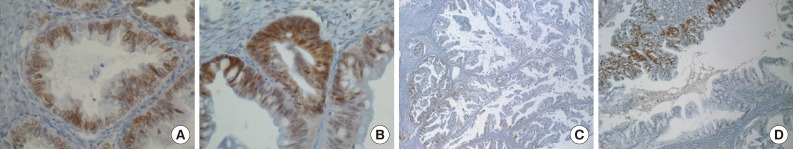
- Positive signals of MAD2 IHC showed brown-yellow nuclear or cytoplasmic staining (Figs. 1, 2). According to the histologic subtypes, distinguishing staining patterns were noted. All of the serous carcinomas showed nuclear staining. It is known that when a tumor has a low MAD2, nuclear membranous staining, illustrated by brown nuclear staining focused on the nuclear envelope, predominates. However, as the MAD2 score increases, intense nuclear staining increases as well. This phenomenon generally appeared in other histologic subtypes with the exception of endometrioid carcinoma, in which nuclear membranous staining predominated even with a high MAD2 score (Fig. 2A). While most of the positive tumor cells showed nuclear staining, a few cases of mucinous carcinoma showed only cytoplasmic staining (Fig. 2B). A heterogeneous staining pattern was observed in all tumor subtypes and was especially common in mucinous carcinoma (Fig. 2C, D).
- The median MAD2 score was 2 and the range of MAD2 scores was 0 to 4. The median and range of the MAD2 score for each histologic subtype were as follows: serous carcinoma, 2 (0-4); mucinous carcinoma, 2 (1-4); endometrioid carcinoma, 2 (0-3); clear cell carcinoma, 1 (0-2); and transitional cell carcinoma, 1 (0-2). Endometrioid carcinoma, clear cell carcinoma, and transitional cell carcinoma tend to have a low MAD2 score and typically do not show a MAD2 score of 3 or 4.
- All 85 cases of ovarian carcinoma were divided into two groups according to expression level of MAD2, as described above. MAD2-L was observed in 40 cases (47.1%) and MAD2-H was observed in 45 cases (52.9%) (details are shown in Table 1). Age, stage, and histologic type by pathogenesis did not show significant correlation with MAD2 expression level. However, when restricting cases within serous tumors, significant association was observed between grade of serous carcinoma and expression level of MAD2. Low-grade serous carcinomas showed significant lower levels of MAD2 expression, while high-grade serous carcinomas showed significant higher levels of MAD2 expression (p=.035).
- p53 showed positive staining in 42 cases (49.4%) and negative staining in 43 cases (50.6%). It revealed no association with age but significant association with stage (p=.039) and histologic type by pathogenesis (p=.003) (Table 2). Advanced stage and pathogenic type II tumors showed more p53-positive immunostaining. In comparing low- and high-grade serous carcinomas, significant differences in p53 immunostaining (p=.013) were also observed, as in the case of MAD2 expression.
- However, a Pearson's chi-square test showed no significant association between MAD2 expression and p53 expression (p=.1).
- Among the 85 cases, 11 relapsed within the follow-up period, including 8 cases of serous carcinoma, 2 cases of endometrioid carcinoma, and 1 case of clear cell carcinoma. All relapsed serous carcinomas were high-grade, with 5 cases classified as pathologic stage III and 3 cases as pathologic stage IV. Two of 8 relapsed high-grade serous carcinoma patients underwent suboptimal debulking surgery. When comparing 19 cases of non-relapsed high-grade serous carcinoma (excluding the censored case) with 8 cases of relapsed high-grade serous carcinoma, MAD2 expression levels were as follows: the mean, median, and range of the non-relapsed group were 2.11, 2, and 0-4, respectively, whereas those of the relapsed group were 1.63, 1, and 0-4. Analyzed by Fisher's exact test, the relapsed group showed significant association with the MAD2-L group (p=.033).
- Prognostic implications
- All collected clinicopathological parameters were analyzed for prognostic implications. PFS of all of the 85 patients was estimated. Uni- and multivariate analysis were performed to evaluate the associations between PFS and other parameters, including age (≥60 years vs <60 years), stage (III, IV vs I, II), type of pathogenesis of ovarian tumors (type II vs type I), MAD2 expression (MAD2-L vs MAD2-H), and p53 expression (positive vs negative) (Table 3). In univariate analysis, age older than 60 (p=.007), advanced stage (stage III, IV) (p=.025), and type II tumor of ovarian tumor pathogenesis (p=.037) showed a significant association with short PFS. However, in multivariate analysis, only age (p=.02) showed a significant prognostic implication.
- When discussing ovarian carcinoma, most are classified as high-grade serous carcinoma, and among 11 cases of relapse in this study, 8 cases were high-grade serous carcinoma, and all of the relapsed serous carcinomas were high-grade. Therefore, we constructed a Kaplan-Meier survival curve to compare the MAD2-L and MAD2-H groups of high-grade serous carcinoma, which showed significant correlation between MAD2 expression and PFS (p=.04) (Fig. 3). The MAD2-L group of high-grade serous carcinoma showed shorter PFS than the MAD-H group of high-grade serous carcinoma. We performed an additional analysis for the prognostic variables influencing tumor relapse on the subject of high-grade serous carcinoma cases. Multivariate analysis of variables, including age (≥60 years vs <60 years), stage (III, IV vs I, II), MAD2 expression (MAD2-L vs MAD2-H), p53 expression (positive vs negative), debulking surgery (suboptimal vs optimal), with PFS revealed that MAD2 expression (p=.016) was a significant prognostic factor affecting PFS in high-grade serous carcinoma along with age (p=.044) and type of debulking surgery (p=.016) (Table 4).
RESULTS
- When scoring expression of MAD2 on light microscopy, the heterogeneity of staining was the most troublesome. The heterogeneity occurred primarily in percentage scoring rather than intensity scoring and was especially prominent in mucinous carcinoma. Even within the same slide, the percentage of positive staining cells was almost 100% in some areas of the tumor, while the percentage was nearly 0% in other areas. For accuracy of the MAD2 score, we attempted to estimate the percentage of positive tumor cell staining with an intensity score greater than 2+ in the whole slide field, but it was nearly impossible due to severe heterogeneity in staining. Therefore, we randomly selected 10 high-power vision fields as representative of the whole slide. This may have resulted in some selection bias in MAD2 scoring in cases of mucinous carcinoma. However, we think that MAD2 scoring was accurate and appropriate for the study.
- Aberrant expression of MAD2, especially MAD2 overexpression, has reportedly been associated with tumorigenesis and tumor progression.3-10 High-level expression of MAD2 was identified as an independent prognostic factor in lung cancer and colon cancer.6,7 Tumor cells in gastric cancer with liver metastasis showed higher expression of MAD2 than in gastric cancer without liver metastasis, suggesting the ratio of MAD2 expression of cancer to normal gastric tissue as a predictive marker for liver metastasis.8 Additionally, in soft-tissue sarcoma, MAD2 overexpression showed an association with pleomorphic morphology and abnormal mitosis.5 However, the mechanism of MAD2 overexpression contribution to tumor progression and aggressiveness is not fully understood. A recent cell culture model experiment conducted by Schvartzman et al.11 provided direct evidence of the necessity of MAD2 overexpression for generation of chromosome instability (CIN) in the p53 or retinoblastoma (Rb) mutant model. MAD2 is thought to be repressed by p53 or Rb. Therefore, inhibition of p53 or Rb, which are widespread events in human malignancy, lead to upregulation of MAD2.
- On the other hand, pathogenesis of ovarian tumors was newly divided into two groups designated as type I and type II.13 They are considered to have different pathogeneses, with different clinical, pathologic, and molecular features. TP53 mutation is frequent in type II tumors and have high chromosomal instability compared with type I tumors. In this study, p53 expression showed a strong correlation with the type of ovarian carcinoma (p=.003), and this is consistent with our knowledge and the results of many other studies.14,15 Results of our study revealed a relationship between p53 expression and advanced stage (p=.039), type I pathogenesis (p=.003) and high nuclear grade in serous carcinoma (p=.013), but no significant relationship between p53 expression and PFS.
- In cases of MAD2 expression, no significant correlation was observed between type I and type II tumors (p=.32). However, when limiting cases within serous tumors, the grade of serous tumor showed a statistically significant correlation with MAD2 expression (p=.035) (Table 1). Low-grade serous carcinoma tends to show a low level of MAD2 expression, and high-grade serous carcinoma tends to show a high level of MAD2 expression. This result can be explained by the relationship of a high level of CIN observed in high-grade serous carcinoma, a kind of type II tumor, and by MAD2 being an important mediator in development of CIN. This is the first paper reporting on differences in expression of MAD2 in different types of ovarian carcinoma and the significant association of MAD2 expression with grade of serous carcinoma in relation to CIN. However, in this study, the relationship between p53 expression and MAD2 expression showed no significant correlation. This indicates the existence of another pathway in development of CIN, which is also involved with the MAD2-mediated p53 inhibition pathway.
- MAD2 expression also showed prognostic implication in patients with ovarian carcinoma. In high-grade serous carcinoma, MAD2 expression level was identified as a significant prognostic factor influencing PFS along with age and type of debulking surgery when using a multivariate Cox's proportional hazard model. The low-level MAD2 expression group showed significantly reduced PFS compared with the high-level MAD2 expression group. This result is in agreement with other previously conducted studies in ovarian carcinoma and in carcinoma in other organs.16-20 We similarly conclude that low expression level of MAD2 is associated with reduced PFS in high-grade serous carcinoma, supporting the previous study and contributing additional data.18 However, we performed MAD2 IHC on diverse types of ovarian carcinoma and obtained various expression patterns of MAD2, including different expression levels observed in low- and high-grade serous carcinoma. In high-grade serous carcinoma, age, MAD2 score group, and type of debulking surgery were significant prognostic factors in multivariate analysis. But, pathologic stage, generally known as an important prognostic factor, appeared to have no prognostic significance. These findings may imply the questionable representation of our samples. Nevertheless, it is suggested that high-grade serous carcinoma with low expression of MAD2 has the tendency for poor prognosis and shorter PFS, which showed statistical significance in this study.
- An experiment demonstrating the importance of MAD2 in its mitotic checkpoint function in response to microtubule disruption agent in ovarian carcinoma has recently been conducted. In checkpoint-defective ovarian cell lines, induced expression of MAD2 restored the mitotic checkpoint function.21 This indicates that decreased expression of MAD2 may contribute to defective mitotic checkpoint control and restoration of MAD2 expression induces mitotic arrest in response to microtubule disruption. Therefore, in order to achieve a sufficient effect of a microtubule stabilizing agent like taxane, a sufficient MAD2 level must be ensured, and, if the expression level of MAD2 is low, defective mitotic checkpoint function, low efficacy of microtubule disruption agent and high risk of cancer relapse are anticipated. This has a significant implication for the possibility of using MAD2 expression level by immunohistochemistry as an index for predicting the response of a microtubule disruption agent as well as for future patient selection and therapeutic intervention in ovarian cancer. However, further studies and verification are needed.
- In this study, expression of p53 and MAD2 showed good correlation with histopathogenesis. In addition, we report an association of MAD2 expression with the grade of ovarian serous carcinoma. Findings of this study revealed that MAD2 expression level in tumor cells is an important prognostic factor, along with age and type of debulking surgery, related to PFS in high-grade ovarian serous carcinoma. We suggest that high-grade ovarian serous carcinoma with low level expression of MAD2 in immunohistochemistry may be resistant to microtubule-disrupting agent and may show earlier recurrence. Extensive further studies and verification are necessary in order to confirm the potential of the use of immunohistochemistry of MAD2 as an easy and effective parameter in the treatment of patients with ovarian cancer.
DISCUSSION
Acknowledgments
Acknowledgments
- 1. Kurman RJ, Hedrick Ellenson L, Ronnett BM. Blaustein's pathology of the female genital tract. 6th ed. London: Springer, 2011; 680.
- 2. Yu H. Structural activation of Mad2 in the mitotic spindle checkpoint: the two-state Mad2 model versus the Mad2 template model. J Cell Biol 2006; 173: 153-157. ArticlePubMedPMCPDF
- 3. Wang L, Yin F, Du Y, et al. MAD2 as a key component of mitotic checkpoint: a probable prognostic factor for gastric cancer. Am J Clin Pathol 2009; 131: 793-801. PubMed
- 4. Chen X, Cheung ST, So S, et al. Gene expression patterns in human liver cancers. Mol Biol Cell 2002; 13: 1929-1939. ArticlePubMedPMC
- 5. Hisaoka M, Matsuyama A, Hashimoto H. Aberrant MAD2 expression in soft-tissue sarcoma. Pathol Int 2008; 58: 329-333. ArticlePubMed
- 6. Kato T, Daigo Y, Aragaki M, et al. Overexpression of MAD2 predicts clinical outcome in primary lung cancer patients. Lung Cancer 2011; 74: 124-131. ArticlePubMed
- 7. Rimkus C, Friederichs J, Rosenberg R, Holzmann B, Siewert JR, Janssen KP. Expression of the mitotic checkpoint gene MAD2L2 has prognostic significance in colon cancer. Int J Cancer 2007; 120: 207-211. ArticlePubMed
- 8. Tanaka K, Nishioka J, Kato K, et al. Mitotic checkpoint protein hsMAD2 as a marker predicting liver metastasis of human gastric cancers. Jpn J Cancer Res 2001; 92: 952-958. ArticlePubMedPMC
- 9. Yu L, Liu S, Guo W, Zhang B, Liang Y, Feng Q. Upregulation of Mad2 facilitates in vivo and in vitro osteosarcoma progression. Oncol Rep 2012; 28: 2170-2176. ArticlePubMed
- 10. Sotillo R, Hernando E, Díaz-Rodríguez E, et al. Mad2 overexpression promotes aneuploidy and tumorigenesis in mice. Cancer Cell 2007; 11: 9-23. ArticlePubMed
- 11. Schvartzman JM, Duijf PH, Sotillo R, Coker C, Benezra R. Mad2 is a critical mediator of the chromosome instability observed upon Rb and p53 pathway inhibition. Cancer Cell 2011; 19: 701-714. ArticlePubMedPMC
- 12. Kurman RJ, Hedrick Ellenson L, Ronnett BM. Blaustein's pathology of the female genital tract. 6th ed. London: Springer, 2011; 729-730.
- 13. Kurman RJ, Shih Ie M. Pathogenesis of ovarian cancer: lessons from morphology and molecular biology and their clinical implications. Int J Gynecol Pathol 2008; 27: 151-160. PubMedPMC
- 14. Arik D, Kulaçoğlu S. p53, bcl-2, and nm23 expressions in serous ovarian tumors: correlation with the clinical and histopathological parameters. Turk Patoloji Derg 2011; 27: 38-45. ArticlePubMed
- 15. Malamou-Mitsi V, Crikoni O, Timotheadou E, et al. Prognostic significance of HER-2, p53 and Bcl-2 in patients with epithelial ovarian cancer. Anticancer Res 2007; 27: 1157-1165. PubMed
- 16. Morishita M, Sumi T, Nakano Y, et al. Expression of mitotic-arrest deficiency 2 predicts the efficacy of neoadjuvant chemotherapy for locally advanced uterine cervical cancer. Exp Ther Med 2012; 3: 341-346. ArticlePubMed
- 17. Nakano Y, Sumi T, Teramae M, et al. Expression of the mitotic-arrest deficiency 2 is associated with chemotherapy resistance in ovarian serous adenocarcinoma. Oncol Rep 2012; 28: 1200-1204. ArticlePubMed
- 18. Furlong F, Fitzpatrick P, O'Toole S, et al. Low MAD2 expression levels associate with reduced progression-free survival in patients with high-grade serous epithelial ovarian cancer. J Pathol 2012; 226: 746-755. ArticlePubMedPMC
- 19. Fung MK, Cheung HW, Wong HL, et al. MAD2 expression and its significance in mitotic checkpoint control in testicular germ cell tumour. Biochim Biophys Acta 2007; 1773: 821-832. ArticlePubMed
- 20. Fung MK, Cheung HW, Ling MT, Cheung AL, Wong YC, Wang X. Role of MEK/ERK pathway in the MAD2-mediated cisplatin sensitivity in testicular germ cell tumour cells. Br J Cancer 2006; 95: 475-484. ArticlePubMedPMCPDF
- 21. Wang X, Jin DY, Ng RW, et al. Significance of MAD2 expression to mitotic checkpoint control in ovarian cancer cells. Cancer Res 2002; 62: 1662-1668. PubMed
REFERENCES


| Variable | No. of cases (n = 85) |
MAD2 expression |
p-value | |
|---|---|---|---|---|
| MAD2-La (n = 40, 47.1%) | MAD2-Hb (n = 45, 52.9%) | |||
| Age (yr) | ||||
| < 60 | 59 (69.4) | 30 (35.3) | 29 (34.1) | .29 |
| ≥ 60 | 26 (30.6) | 10 (11.8) | 16 (18.8) | |
| Stagec | ||||
| I, II | 42 (49.4) | 20 (23.5) | 22 (25.9) | .92 |
| III, IV | 43 (50.6) | 20 (23.5) | 23 (27.1) | |
| Type I tumors | 44 (51.8) | 23 (27.1) | 21 (24.7) | .32 |
| Low-grade serous CA | 7 (8.2) | 6 (7.1) | 1 (1.2) | |
| Low-grade endometrioid CA | 8 (9.4) | 2 (2.4) | 6 (7.1) | |
| Clear cell CA | 10 (11.8) | 7 (8.2) | 3 (3.5) | |
| Mucinous CA | 19 (22.4) | 8 (9.4) | 11 (12.9) | |
| Type II tumors | 41 (48.2) | 17 (20.0) | 24 (28.2) | |
| High-grade serous CA | 37 (43.5) | 14 (16.5) | 23 (27.1) | |
| High-grade endometrioid CA | 2 (2.4) | 2 (2.4) | 0 (0) | |
| Transitional cell CA | 2 (2.4) | 1 (1.2) | 1 (1.2) | |
| p53 expression | ||||
| positive | 42 (49.4) | 16 (18.8) | 26 (30.6) | .1 |
| negative | 43 (50.6) | 24 (28.2) | 19 (22.4) | |
| Serous CA (n = 44) | ||||
| Low-grade serous CA | 7 (15.9) | 6 (13.6) | 1 (2.3) | .035d |
| High-grade serous CA | 37 (84.1) | 14 (31.8) | 23 (52.3) | |
Values are presented as number (%).
MAD2, mitotic arrest deficieny protein 2; CA, carcinoma.
aMAD2-L is a group of ovarian carcinomas showing low-level expression of MAD2 (with MAD2 score≤1);
bMAD2-H is a group of ovarian carcinomas showing high-level expression of MAD2 (with MAD2 score≥2);
cStaging is checked according to the seventh edition of American Joint committee on Cancer (AJCC) guidelines;
dSignificant.
| Variable | No. of cases (n = 85) |
p53 expression |
p-value | |
|---|---|---|---|---|
| Positive (n = 42, 49.4%) | Negative (n = 43, 50.6%) | |||
| Age (yr) | ||||
| < 60 | 59 (69.4) | 29 (34.1) | 30 (35.3) | .94 |
| ≥ 60 | 26 (30.6) | 13 (15.3) | 13 (15.3) | |
| Stagea | ||||
| I, II | 42 (49.4) | 16 (18.8) | 26 (30.6) | .039b |
| III, IV | 43 (50.6) | 26 (30.6) | 17 (20.0) | |
| Type I tumors | 44 (51.8) | 15 (17.6) | 29 (34.1) | .003b |
| Low-grade serous CA | 7 (8.2) | 1 (1.2) | 6 (7.1) | |
| Low-grade endometrioid CA | 8 (9.4) | 1 (1.2) | 7 (8.2) | |
| Clear cell CA | 10 (11.8) | 2 (2.4) | 8 (9.4) | |
| Mucinous CA | 19 (22.4) | 11 (12.9) | 8 (9.4) | |
| Type II tumors | 41 (48.2) | 27 (31.8) | 14 (16.5) | |
| High-grade serous CA | 37 (43.5) | 25 (29.4) | 12 (14.1) | |
| High-grade endometrioid CA | 2 (2.4) | 1 (1.2) | 1 (1.2) | |
| Transitional cell CA | 2 (2.4) | 1 (1.2) | 1 (1.2) | |
| Serous CA (n = 44) | ||||
| Low-grade serous CA | 7 (15.9) | 1 (2.3) | 6 (13.6) | .013b |
| High-grade serous CA | 37 (84.1) | 25 (56.8) | 12 (27.3) | |
| Variables | Hazard ratio (univariate CI) | p-value | Hazard ratio (multivariate CI) | p-value |
|---|---|---|---|---|
| Age (yr) | ||||
| ≥ 60/ < 60 | 5.340 (1.578-18.066) | .007c | 4.407 (1.261-15.406) | .02c |
| Stage | ||||
| III, IV/I, II | 5.773 (1.241-26.858) | .025c | 2.989 (0.556-16.081) | .2 |
| Ovarian CA type | ||||
| Type II/type I | 4.110 (1.087-15.541) | .037c | 2.539 (0.565-11.410) | .22 |
| MAD2 expression | ||||
| MAD2-La/MAD2-Hb | 2.456 (0.651-9.265) | .19 | 3.826 (0.915-16.000) | .07 |
| p53 expression | ||||
| Positive/negative | 1.373 (0.418-4.510) | .6 | 1.308 (0.361-4.737) | .68 |
| Variable | Hazard ratio (multivariate CI) | p-value |
|---|---|---|
| Age (yr) | ||
| ≥ 60/ < 60 | 6.272 (1.054-37.328) | .044c |
| Stage | ||
| III, IV/I, II | 3.982 (0.334-47.542) | .28 |
| MAD2 expression | ||
| MAD2-La/MAD2-Hb | 27.970 (1.838-425.629) | .016c |
| Debulking surgery | ||
| suboptimal/optimal | 36.458 (1.979-671.739) | .016c |
Figure & Data
References
Citations
- MAD2L1 supports MYC-driven liver carcinogenesis in mice and predicts poor prognosis in human hepatocarcinoma
Xinjun Lu, Ya Zhang, Jiahao Xue, Matthias Evert, Diego Calvisi, Xin Chen, Xue Wang
Toxicological Sciences.2025; 203(1): 41. CrossRef - Checkpoint Genes in Check: Impact of BUB1, BUB1B, and MAD2 Alterations on the Treatment Outcomes of Advanced Ovarian Cancer
Sinjini Sarkar, Ranita Pal, Trisha Choudhury, Manisha Vernekar, Puja Chatterjee, Kalyan Kusum Mukherjee, Partha Nath, Santosh Kumar Behera, Sunil Kumar, Vilas D. Nasare
Journal of Current Oncological Trends.2025; 2(1): 72. CrossRef - Biomarkers in high grade serous ovarian cancer
Mark Bates, Bashir M. Mohamed, Faye Lewis, Sharon O’Toole, John J. O’Leary
Biochimica et Biophysica Acta (BBA) - Reviews on Cancer.2024; 1879(6): 189224. CrossRef - The role of the MAD2-TLR4-MyD88 axis in paclitaxel resistance in ovarian cancer
Mark Bates, Cathy D. Spillane, Michael F. Gallagher, Amanda McCann, Cara Martin, Gordon Blackshields, Helen Keegan, Luke Gubbins, Robert Brooks, Doug Brooks, Stavros Selemidis, Sharon O’Toole, John J. O’Leary, David Wai Chan
PLOS ONE.2020; 15(12): e0243715. CrossRef - Aneuploidy: Cancer strength or vulnerability?
Giorgia Simonetti, Samantha Bruno, Antonella Padella, Elena Tenti, Giovanni Martinelli
International Journal of Cancer.2019; 144(1): 8. CrossRef - The association between MAD2 and prognosis in cancer: a systematic review and meta-analyses
Tara Byrne, Helen G. Coleman, Janine A. Cooper, W. Glenn McCluggage, Amanda McCann, Fiona Furlong
Oncotarget.2017; 8(60): 102223. CrossRef - Identification of transcription factors (TFs) and targets involved in the cholangiocarcinoma (CCA) by integrated analysis
L Yang, S Feng, Y Yang
Cancer Gene Therapy.2016; 23(12): 439. CrossRef - Proteins of the mitotic checkpoint and spindle are related to chromosomal instability and unfavourable prognosis in patients with myelodysplastic syndrome
Kelly Roveran Genga, Francisco Dário Rocha Filho, Francisco Valdeci de Almeida Ferreira, Juliana Cordeiro de Sousa, Fernando Sergio Studart, Silvia Maria Meira Magalhães, Fabíola Fernandes Heredia, Ronald Feitosa Pinheiro
Journal of Clinical Pathology.2015; 68(5): 381. CrossRef
 PubReader
 ePub Link
-
 Cite this Article
- Cite this Article
-
- Close
- Download Citation
- Close
- Figure
-
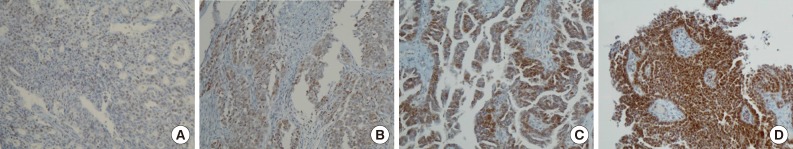

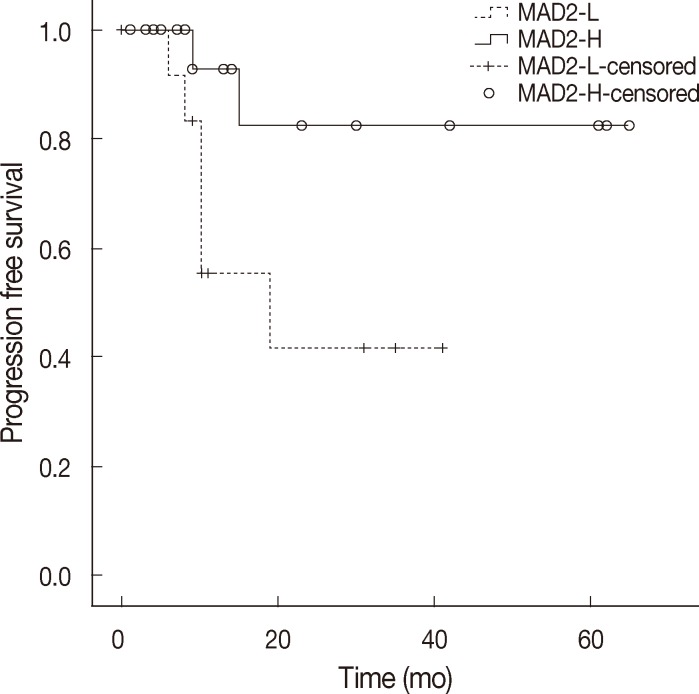


Fig. 1
Fig. 2
Fig. 3
| Variable | No. of cases (n = 85) | MAD2 expression |
p-value | |
|---|---|---|---|---|
| MAD2-L |
MAD2-H |
|||
| Age (yr) | ||||
| < 60 | 59 (69.4) | 30 (35.3) | 29 (34.1) | .29 |
| ≥ 60 | 26 (30.6) | 10 (11.8) | 16 (18.8) | |
| Stage |
||||
| I, II | 42 (49.4) | 20 (23.5) | 22 (25.9) | .92 |
| III, IV | 43 (50.6) | 20 (23.5) | 23 (27.1) | |
| Type I tumors | 44 (51.8) | 23 (27.1) | 21 (24.7) | .32 |
| Low-grade serous CA | 7 (8.2) | 6 (7.1) | 1 (1.2) | |
| Low-grade endometrioid CA | 8 (9.4) | 2 (2.4) | 6 (7.1) | |
| Clear cell CA | 10 (11.8) | 7 (8.2) | 3 (3.5) | |
| Mucinous CA | 19 (22.4) | 8 (9.4) | 11 (12.9) | |
| Type II tumors | 41 (48.2) | 17 (20.0) | 24 (28.2) | |
| High-grade serous CA | 37 (43.5) | 14 (16.5) | 23 (27.1) | |
| High-grade endometrioid CA | 2 (2.4) | 2 (2.4) | 0 (0) | |
| Transitional cell CA | 2 (2.4) | 1 (1.2) | 1 (1.2) | |
| p53 expression | ||||
| positive | 42 (49.4) | 16 (18.8) | 26 (30.6) | .1 |
| negative | 43 (50.6) | 24 (28.2) | 19 (22.4) | |
| Serous CA (n = 44) | ||||
| Low-grade serous CA | 7 (15.9) | 6 (13.6) | 1 (2.3) | .035 |
| High-grade serous CA | 37 (84.1) | 14 (31.8) | 23 (52.3) | |
| Variable | No. of cases (n = 85) | p53 expression |
p-value | |
|---|---|---|---|---|
| Positive (n = 42, 49.4%) | Negative (n = 43, 50.6%) | |||
| Age (yr) | ||||
| < 60 | 59 (69.4) | 29 (34.1) | 30 (35.3) | .94 |
| ≥ 60 | 26 (30.6) | 13 (15.3) | 13 (15.3) | |
| Stage |
||||
| I, II | 42 (49.4) | 16 (18.8) | 26 (30.6) | .039 |
| III, IV | 43 (50.6) | 26 (30.6) | 17 (20.0) | |
| Type I tumors | 44 (51.8) | 15 (17.6) | 29 (34.1) | .003 |
| Low-grade serous CA | 7 (8.2) | 1 (1.2) | 6 (7.1) | |
| Low-grade endometrioid CA | 8 (9.4) | 1 (1.2) | 7 (8.2) | |
| Clear cell CA | 10 (11.8) | 2 (2.4) | 8 (9.4) | |
| Mucinous CA | 19 (22.4) | 11 (12.9) | 8 (9.4) | |
| Type II tumors | 41 (48.2) | 27 (31.8) | 14 (16.5) | |
| High-grade serous CA | 37 (43.5) | 25 (29.4) | 12 (14.1) | |
| High-grade endometrioid CA | 2 (2.4) | 1 (1.2) | 1 (1.2) | |
| Transitional cell CA | 2 (2.4) | 1 (1.2) | 1 (1.2) | |
| Serous CA (n = 44) | ||||
| Low-grade serous CA | 7 (15.9) | 1 (2.3) | 6 (13.6) | .013 |
| High-grade serous CA | 37 (84.1) | 25 (56.8) | 12 (27.3) | |
| Variables | Hazard ratio (univariate CI) | p-value | Hazard ratio (multivariate CI) | p-value |
|---|---|---|---|---|
| Age (yr) | ||||
| ≥ 60/ < 60 | 5.340 (1.578-18.066) | .007 |
4.407 (1.261-15.406) | .02 |
| Stage | ||||
| III, IV/I, II | 5.773 (1.241-26.858) | .025 |
2.989 (0.556-16.081) | .2 |
| Ovarian CA type | ||||
| Type II/type I | 4.110 (1.087-15.541) | .037 |
2.539 (0.565-11.410) | .22 |
| MAD2 expression | ||||
| MAD2-L |
2.456 (0.651-9.265) | .19 | 3.826 (0.915-16.000) | .07 |
| p53 expression | ||||
| Positive/negative | 1.373 (0.418-4.510) | .6 | 1.308 (0.361-4.737) | .68 |
| Variable | Hazard ratio (multivariate CI) | p-value |
|---|---|---|
| Age (yr) | ||
| ≥ 60/ < 60 | 6.272 (1.054-37.328) | .044 |
| Stage | ||
| III, IV/I, II | 3.982 (0.334-47.542) | .28 |
| MAD2 expression | ||
| MAD2-L |
27.970 (1.838-425.629) | .016 |
| Debulking surgery | ||
| suboptimal/optimal | 36.458 (1.979-671.739) | .016 |
Values are presented as number (%). MAD2, mitotic arrest deficieny protein 2; CA, carcinoma. MAD2-L is a group of ovarian carcinomas showing low-level expression of MAD2 (with MAD2 score≤1); MAD2-H is a group of ovarian carcinomas showing high-level expression of MAD2 (with MAD2 score≥2); Staging is checked according to the seventh edition of American Joint committee on Cancer (AJCC) guidelines; Significant.
Values are presented as number (%). CA, carcinoma. Staging is checked according to the seventh edition of American Joint Committee on Cancer (AJCC) guidelines; Significant.
CI, confidence interval; CA, carcinoma; MAD2, mitotic arrest deficieny protein 2. MAD2-L is a group of ovarian carcinomas showing low-level expression of MAD2 (with MAD2 score≤1); MAD2-H is a group of ovarian carcinomas showing high-level expression of MAD2 (with MAD2 score≥2); Significant.
CI, confidence interval; MAD2, mitotic arrest deficieny protein 2. MAD2-L is a group of ovarian carcinomas showing low-level expression of MAD2 (with MAD2 score≤1); MAD2-H is a group of ovarian carcinomas showing high-level expression of MAD2 (with MAD2 score≥2); Significant.

