 E-submission
Articles
- Page Path
- HOME > J Pathol Transl Med > Volume 47(5); 2013 > Article
-
Original Article
Progressive Increase of Regulatory T Cells and Decrease of CD8+ T Cells and CD8+ T Cells/Regulatory T Cells Ratio during Colorectal Cancer Development - Tae Jung Jang
-
Korean Journal of Pathology 2013;47(5):443-451.
DOI: https://doi.org/10.4132/KoreanJPathol.2013.47.5.443
Published online: October 25, 2013
Department of Pathology, Dongguk University College of Medicine, Gyeongju, Korea.
- Corresponding Author: Tae Jung Jang, M.D. Department of Pathology, Dongguk University College of Medicine, 123 Dongdae-ro, Gyeongju 780-714, Korea. Tel: +82-54-770-2410, Fax: +82-54-770-2447, taejung@mail.dongguk.ac.kr
• Received: July 25, 2013 • Revised: October 2, 2013 • Accepted: October 4, 2013
© 2013 The Korean Society of Pathologists/The Korean Society for Cytopathology
This is an Open Access article distributed under the terms of the Creative Commons Attribution Non-Commercial License (http://creativecommons.org/licenses/by-nc/3.0/) which permits unrestricted non-commercial use, distribution, and reproduction in any medium, provided the original work is properly cited.
Abstract
-
Background
- We examined the distribution of CD8+ T cells and regulatory T cells (Tregs), measured the CD8+ T cell/Tregs ratio, investigated the relationship between Tregs and cyclooxygenase-2 (COX-2) expression during colorectal cancer (CRC) development.
-
Methods
- We performed immunohistochemical staining for CD8, forkhead box P3, E-cadherin, and COX-2 in 32 cases of invasive CRC, 10 cases of intramucosal CRC, 27 cases of high-grade tubular adenoma, 22 cases of low-grade tubular adenoma, and 32 cases of non-neoplastic conditions.
-
Results
- We observed a progressive increase in Tregs, and a decrease in CD8+ T cells and the CD8+ T cells/Tregs ratio during CRC development. The alterations were most severe in high-grade tubular adenoma and CRC. COX-2 expression was positively associated with Tregs infiltration. The degree of T cell infiltration differed among tumor compartment and the ratio in the tumor center was the lowest of all areas. The ratio and number of CD8+ T cells in the tumor center and the invasive front of invasive CRC were associated with gender, differentiation, node metastasis and tumor budding.
-
Conclusions
- Alteration in the distribution of both CD8+T cells and Tregs may contribute to the generation of an immune environment suitable for the development and progression of CRC.
- Patients and tissue samples
- A total of 123 patients with non-neoplastic colonic disease (n=17), hyperplastic polyp (n=15), low-grade tubular adenoma (n=22), high-grade tubular adenoma (n=27), intramucosal CRC (n=10), and invasive CRC (n=32; 5 patients with T2 CRC and 27 patients with T3 CRC) treated at Dongguk University Gyeongju Hospital between 2009 and 2012 were enrolled in this study. Non-neoplastic colon tissues with only mild inflammation were selected in colonic tissues that were clinically suspected as infectious colitis and ischemic colitis. We selected patients whose paraffin-embedded tissues were relatively well preserved and whose medical records were complete. We excluded patients who had undergone preoperative chemotherapy and emergency surgery, as well as those who had been diagnosed with mucinous adenocarcinoma. The characteristics of the study subjects are summarized in Table 1. Specimens were fixed in 10% formalin for 12-24 hours and then embedded in paraffin blocks. Tissue sections were sampled along the maximum tumor diameter and included the deepest site of cancer invasion.
- Microscopic examination, immunohistochemistry, and assessment
- Differentiation and depth of tumor and status of lymph node metastasis were assessed after reviewing each tumor slide. The TNM staging system was defined according to the American Joint Committee on Cancer. The presence of tumor budding was determined according to the criteria proposed by Ueno et al.20 In invasive CRC, tumor budding foci were examined in tissue sections that had been immunohistochemically stained using anti-E-cadherin antibody, and the number of tumor buds (NTB) was determined in a field in which budding intensity was considered maximal under high-power magnification. To identify the relationship between NTB, the number of T cells expressing CD8 and FOXP3, and CD8+ T cells/Tregs in invasive CRC, our cases were divided into two categories according to NTB: low NTB (0-10) and high NTB (>10).
- Tissue sections with a thickness of 4 µm were prepared and spread on poly-L-lysine-coated slides. The paraffin sections were then immersed in three changes of xylene and hydrated using a graded series of alcohol solutions. Antigen retrieval was performed routinely by immersing the sections in a 0.01 M citrate buffer (pH 6.0) in an autoclave for 15 minutes. Endogenous peroxidase activity was blocked with 3% hydrogen peroxide for 15 minutes, after which the sections were incubated with primary antibody for two hours at room temperature. The primary antibodies included anti-E-cadherin (1:1,000, Transduction Laboratories, Lexington, KY, USA), anti-CD8 (1:250, Dako, Santa Barbara, CA, USA), anti-FOXP3 antibody (1:100, Abcam, Cambridge, UK) and anti-COX-2 (1:500, Cayman Chemical, Ann Arbor, MI, USA). Immunohistochemical staining was performed using an EnVision kit (Dako) and the color was developed using 3,3'-diaminobenzidine tetrahydrochloride (Zymed Laboratories, Inc., South San Francisco, CA, USA) as a chromogen. The sections were counterstained with Meyer's hematoxylin for three minutes and then mounted. The brown reactive end product stained the membrane for CD8 proteins and the nuclei for FOXP3. Mouse and rabbit IgG isotype were used as a negative control. Tonsil tissue was used as a positive control.
- The immunoreactivity of CD8 and FOXP3 was evaluated in the tumor center, invasive front, boundary between the tumor and non-neoplastic mucosa, and adjacent non-neoplastic mucosa for invasive CRC, as well as in the tumor center and boundary for tubular adenomas. In the case of intramucosal CRC, we only counted T cells expressing CD8 and FOXP3 in the tumor center because they all occurred focally and were surrounded by adenomatous lesions. Immunostained cells were counted in five randomly selected high-power fields (HPFs) in the aforementioned areas, and 5 HPFs were averaged in each case. The CD8+ T cells/Tregs ratio was calculated based on the number of both T cells. The immunoreactivity for cytoplasmic COX-2 expression was evaluated by assessing the percentage of positive cells, and this was graded as negativity (0-5%) or positivity (>5%).
- Statistical analysis
- Statistical analyses consisted of Kruskal-Wallis test (KW), Mann-Whitney (MW), t-test and Fisher's exact test. Statistical significance was assumed if p-value was <.05. Data were expressed as the mean±standard deviation.
MATERIALS AND METHODS
- The number of CD8+ T cells and Tregs, and CD8+ T cells/Tregs ratio in the center and boundary of lesions during CRC development
- As shown Fig. 1, the degree of CD8+ T cell infiltration progressively decreased, while that of Treg infiltration gradually increased during CRC development. Fig. 2 shows the number of both T cells and the CD8+ T cells/Tregs ratio in the tumor center and non-neoplastic mucosa. As shown in Fig. 2A, the number (mean±SD) of CD8+ T cells was 25.1±10.0 in non-neoplastic colon, 27.0±10.3 in hyperplastic polyp, 19.8±14.1 in low-grade tubula adenoma, 12.2±7.4 in high-grade tubular adenoma, 9.6±10.2 in intramucosal CRC, and 9.6±7.8 in invasive CRC. The number of Tregs was 8.5±5.2 in non-neoplastic colon, 6.6±5.0 in hyperplastic polyp, 15.3±8.3 in low-grade tubular adenoma, 30.9±12.0 in high-grade tubular adenoma, 26.4±7.6 in intramucosal CRC, and 32.0±13.0 in invasive CRC. The number of CD8+ T cells progressively decreased, while that of Tregs gradually increased during CRC development (KW, p<.001). The number of CD8+ T cells and Tregs in neoplastic diseases was significantly different from that of non-neoplastic diseases (MW, p<.001) and that of both T cells in low-grade tubular adenoma was also significantly different from that in high-grade tubular adenoma and CRC (MW; p<.001 for Tregs, p=.002 for CD8+ T cells). As shown Fig. 2B, the CD8+ T cells/Tregs ratio (mean±SD) was 5.17±5.10 in non-neoplastic colon, 7.96±9.11 in hyperplastic polyp, 1.54±1.10 in low-grade tubular adenoma, 0.44±0.29 in high-grade tubular adenoma, 0.40±0.41 in intramucosal CRC, and 0.31±0.20 in invasive CRC. The ratio progressively decreased during CRC development (KW, p<.001). It was significantly higher in non-neoplastic conditions than in neoplastic diseases and that of low grade tubular adenoma was also significantly higher than that of other neoplastic diseases (MW, p<.001).
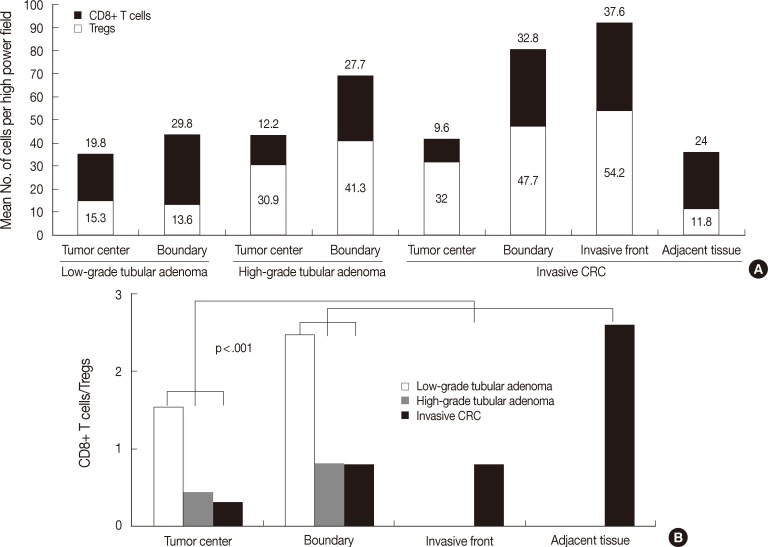
- Fig. 3 shows the number of both T cells and the ratio in the tumor boundary. As shown in Fig. 3A, the number of CD8+ T cells was 29.8±13.6 in low-grade tubular adenoma, 27.7±15.2 in high-grade tubular adenoma, and 32.8±12.8 in invasive CRC. There was no significant difference between groups. The number of Tregs was 13.6±6.1 in low-grade tubular adenoma, 41.3±17.7 in high-grade tubular adenoma, and 47.7±17.3 in invasive CRC. Tregs infiltrated more frequently in high-grade tubular adenoma and invasive CRC than low-grade tubular adenoma (MW, p<.001). As shown in Fig. 3B, the ratio was 2.47±1.43 in low-grade tubular adenoma, 0.81±0.84 in high-grade tubular adenoma, and 0.77±0.46 in invasive CRC. The ratio was significantly lower in high-grade tubular adenoma and invasive CRC than in low-grade tubular adenoma (MW, p<.001).
- The number of both T cells and the ratio were compared between adjacent non-neoplastic mucosa in invasive CRC and non-neoplastic colonic mucosa. In adjacent mucosa of invasive CRC, there were 24.0±11.4 CD8+ T cells and 11.8±5.6 Tregs, and 2.57±1.71 was the CD8+ T cells/Tregs ratio. Those of non-neoplastic colonic mucosa are described above. Adjacent mucosa of invasive CRC showed a higher number of Tregs and lower ratio than the non-neoplastic mucosa, however no significant difference was found.
- The distribution of CD8+ T cells, Tregs, and CD8+ T cells/Tregs ratio among tumor compartments in tubular adenoma and invasive CRC
- The number of both types of T cells and the CD8+ T cells/Tregs ratio in the tumor center and boundary are described above. As shown in Fig. 4A, low-grade tubular adenoma showed a higher number of CD8+ T cells in the boundary than in the tumor center (MW, p=.01) and high-grade tubular adenoma revealed higher number of both T cells in the boundary than in the tumor center (MW, p=.009 for Tregs, p<.001 for CD8+ T cells). As shown in Fig. 4B, the ratio was significantly lower in the tumor center than in the boundary for both tubular adenomas (MW; p=.017 for low-grade tubular adenoma, p=.003 for high-grade tubular adenoma).
- In the case of invasive CRC, as shown in Fig. 4A, the number of CD8+ T cells was 9.6±7.8 in the tumor center, 37.6±21.3 in the invasive front, 32.8±12.8 in the boundary, and 24.0±11.4 in the adjacent non-neoplastic mucosa. The number was higher in both the invasive front and boundary than in other areas, while it was the lowest in the tumor center (KW and MW, p<.001). The number of Tregs was 32.0±13.0 in the tumor center, 54.2±25.3 in the invasive front, 47.7±17.3 in the boundary and 11.8±5.6 in the adjacent non-neoplastic mucosa. The number was the lowest in adjacent non-neoplastic mucosa, while other findings were similar to those for CD8+ T cells (KW and MW, p<.001). As shown in Fig. 4B, the ratio was 0.31±0.20 in the tumor center, 0.77±0.46 in the invasive front, 0.77±0.46 in the boundary, and 2.57±1.71 in the adjacent non-neoplastic mucosa. The ratio was the lowest in the tumor center and the highest in the adjacent non-neoplastic mucosa (KW and MW, p<.001).
- Relationship between COX-2 expression and the number of Tregs
- As shown in Fig. 5A-C, COX-2 expression was not observed in tumor cells, but was observed in subepithelial stromal cells in the periluminal region of the lamina propria in tubular adenoma and CRC. The rate of COX-2 expression positivity was 0% in non-neoplastic colon and hyperplastic polyp, 23% (5 out of 22) in low-grade tubular adenoma, 70% (19 out of 27) in high-grade tubular adenoma, 60% (6 out of 10) in intramucosal CRC, and 91% (29 out of 32) in invasive CRC. COX-2 expression was significantly higher in high grade tubular adenoma and CRC than in low-grade tubular adenoma and non-neoplastic conditions (Fisher's exact test, p<.001). As shown in Fig. 5D, the number of Tregs was 14.9±11.5 in tissues with no COX-2 expression (n=64) and 29.7±13.0 in tissues with COX-2 expression (n=59) when applied to all tissue samples. The number of Tregs was significantly higher in tissues with COX-2 expression than in those with no COX-2 expression (t-test, p<.001). This finding was also observed when applied only to neoplastic diseases (t-test, p=.005).
- Nnumber of CD8+ T cells and Tregs and CD8+ T cells/Tregs ratio among tumor compartments according to clinicopathological parameters in invasive CRC
- As shown in Table 2, female patients had higher numbers of CD8+ T cells in the invasive front (MW, p=.004) and higher CD8+ T cells/Tregs ratio in the tumor center (MW, p=.0048) and invasive front (MW, p<.001) than the male patients. Well-differentiated invasive CRC showed higher numbers of CD8+ T cells than moderately and poorly differentiated ones in the invasive front (MW, p=.019). T2 CRC showed a higher number of CD8+ T cells (p=.011) and Tregs (MW, p=.035) than T3 CRC in the invasive front. Invasive CRC without nodal metastasis showed higher CD8+ T cells/Tregs ratios than those with nodal metastasis in the tumor center (MW, p=.025). Invasive CRC with low NTB showed higher numbers of CD8+ T cells than those with high NTB in the invasive front (MW, p=.034).
RESULTS
- Cancer immunoediting is a dynamic process between the immune system and tumor cells that is composed of three phases: elimination, equilibrium and escape.8 Elimination represents successful immunologic elimination of tumor cells through the immunosurveillance network. Equilibrium is the period of immune-mediated latency after incomplete tumor destruction in the elimination phase, resulting in the survival of less immunogenic tumor cells. The escape phase is the period during which less immunogenic tumor cells become a clinical detectable tumor mass through immune evasion. Tregs are known to contribute to tumor immune evasion in a variety of cancers.8 Treg cells have also been shown to induce the apoptosis of effector T cells including CD8+ T cells through perforin, FasL, and granzyme B.21 It thus appears that the reciprocal correlation between the number of CD8+ T cells and number of Tregs during CRC development in the current study may have been caused by the cytotoxic effect of Tregs against CD8+ T cells. It is known that PGE2 shows immunosuppressive effects on T cells through different mechanisms, including the induction and expansion of Tregs.18,22 The current study showed that COX-2 expression was observed in stromal cells and was higher in high-grade tubular adenoma and CRC than in low-grade tubular adenoma. In addition, the present study also showed a positive association between COX-2 expression and the number of Tregs. This finding is in agreement with findings of previous studies.19,23 In the present study, the alteration of Tregs, CD8+ T cells and CD8+ T cells/Tregs ratio in neoplastic diseases was significantly different from that of non-neoplastic conditions. In addition, the number of different immune cells in low-grade tubular adenoma were significantly different from those of high-grade tubular adenoma and CRC. Based on the finding that Tregs play an important role in immune evasion in a variety of cancers, the current results suggest that the tumor immune evasion phase begins in low-grade tubular adenoma and worsens in high-grade tubular adenoma and CRC. Furthermore, the surrounding non-neoplastic mucosa in invasive CRC showed a higher number of Tregs and lower CD8+ T cells/Tregs ratio than in non-neoplastic colon. It appears that that the less immunogenic tumor cells are likely to survive in adjacent mucosa in CRC. Taken together, these findings indicate that tumor cells may acquire the ability to circumvent recognition from the immune system by governing the distribution of CD8+ T cells and Tregs during CRC development.
- We examined the distribution of both T cells and the ratio of the T cells types to analyze T cell functional disposition in the tumor compartment of tubular adenoma and invasive CRC. The results of our study suggest that both high-grade tubular adenoma and invasive CRC show a similar immune environment. This can be explained by the following findings: 1) the ratio was less than 1 throughout the tumor area for both tumors; however, the ratio was greater than 1 in low-grade tubular adenoma; 2) there was no significant difference in the number of either type of T cells and the ratio at the tumor center and the boundary between both tumors; 3) the number of both T cell types and the ratio in the boundary were higher than those in the tumor center in both tumors; however, low-grade tubular adenoma did not have these characteristics. The current study showed that the degree of T cell infiltration differed among tumor compartments and that the ratio in the tumor center was the lowest. This finding suggests that an immune environment differs among tumor compartments and that the degree of immune evasion is most severe in the tumor center. The tumor microenvironment such as cytokines and an interconnection among a variety of cells may be related to this finding; however, this was beyond the scope of our study and further study is necessary to address the role of tumor microenvironment.
- The current results show that the number of CD8+ T cells in the invasive front is negatively correlated with tumor depth and tumor budding, and that the number in the tumor center was also negatively associated with tumor budding. Tumor-infiltrating lymphocytes in the invasive front have previously been reported to be associated with the absence of tumor budding in CRC.24 Furthermore, the results of that study suggested that peritumoral lymphocytes in the invasive front can cause apoptotic destruction of budding tumor cells. Recently, a high CD8+ T cell/bud index was found to be correlated with favorable clinicopathologic features such as early T stage and absence of vascular invasion.25 In the current study, CD8+ T cells infiltrated more frequently in well-differentiated tumors in the invasive front than in that of other tumors. It has been suggested that the degree of tumor differentiation is dependent on the distribution of immune molecules and correlated with cell-mediated immune responses.26 Specifically, a higher number of CD8+ T cells was observed in well-differentiated squamous cell carcinoma of the head and neck in comparison to poorly differentiated carcinoma. In contrast, CD8+ T cells infiltration in CRC was more prominent in moderately and poorly differentiated adenocarcinoma.12,27 Further studies are needed to evaluate the role of CD8+ T cells in tumor differentiation. Assuming that Tregs infiltration reduces anti-tumor immunity and thus survival, it is interesting that Tregs more frequently infiltrated T2 CRC than T3 CRC in the present study. A previous publication reported that Tregs infiltration at the primary tumor site increases during the early stages of CRC and decreases in advanced diseases.11 Furthermore, many publications have shown that a high frequency of tumor-infiltrating Tregs is correlated with favorable prognosis in patients with CRC.6,7,14 These findings can be explained by the capacity of Tregs to suppress tumor-promoting inflammatory immune response generated by the septic environment in the colon and notably promoted by Th17 cells.14,16 A high tumor infiltrating CD8+ T cells/Tregs ratio was found to be associated with a lower clinical stage and longer survival.15 This is in accordance with our finding that a higher CD8+ T cells/Tregs ratio in the tumor center is negatively associated with node metastasis. Overall, the CD8+ T cells/Tregs ratio and the number of CD8+ T cells in the tumor center and invasive front are associated with the progression of CRC.
- In summary, we observed a progressive increase in Tregs and decrease in CD8+ T cells and CD8+ T cells/Tregs ratio during CRC development. The alterations were the most severe in high-grade tubular adenoma and CRC. In addition, COX-2 expression was positively associated with Tregs infiltration. The degree of T cell infiltration differed among tumor compartments and the ratio in the tumor center was the lowest. The ratio and number of CD8+ T cells in the tumor center and invasive front of invasive CRC were associated with clinicopathological parameters such as gender, tumor differentiation, node metastasis, and tumor budding.
DISCUSSION
- 1. Boon T, Cerottini JC, Van den Eynde B, van der Bruggen P, Van Pel A. Tumor antigens recognized by T lymphocytes. Annu Rev Immunol 1994; 12: 337-365. ArticlePubMed
- 2. Keene JA, Forman J. Helper activity is required for the in vivo generation of cytotoxic T lymphocytes. J Exp Med 1982; 155: 768-782. ArticlePubMedPMCPDF
- 3. Morishima N, Owaki T, Asakawa M, Kamiya S, Mizuguchi J, Yoshimoto T. Augmentation of effector CD8+ T cell generation with enhanced granzyme B expression by IL-27. J Immunol 2005; 175: 1686-1693. ArticlePubMedPDF
- 4. Naito Y, Saito K, Shiiba K, et al. CD8+ T cells infiltrated within cancer cell nests as a prognostic factor in human colorectal cancer. Cancer Res 1998; 58: 3491-3494. PubMed
- 5. Galon J, Costes A, Sanchez-Cabo F, et al. Type, density, and location of immune cells within human colorectal tumors predict clinical outcome. Science 2006; 313: 1960-1964. ArticlePubMed
- 6. Nosho K, Baba Y, Tanaka N, et al. Tumour-infiltrating T-cell subsets, molecular changes in colorectal cancer, and prognosis: cohort study and literature review. J Pathol 2010; 222: 350-366. PubMedPMC
- 7. Salama P, Phillips M, Grieu F, et al. Tumor-infiltrating FOXP3+ T regulatory cells show strong prognostic significance in colorectal cancer. J Clin Oncol 2009; 27: 186-192. ArticlePubMed
- 8. Dunn GP, Old LJ, Schreiber RD. The three Es of cancer immunoediting. Annu Rev Immunol 2004; 22: 329-360. ArticlePubMed
- 9. Wing K, Onishi Y, Prieto-Martin P, et al. CTLA-4 control over Foxp3+ regulatory T cell function. Science 2008; 322: 271-275. ArticlePubMed
- 10. Deaglio S, Dwyer KM, Gao W, et al. Adenosine generation catalyzed by CD39 and CD73 expressed on regulatory T cells mediates immune suppression. J Exp Med 2007; 204: 1257-1265. ArticlePubMedPMCPDF
- 11. Loddenkemper C, Schernus M, Noutsias M, Stein H, Thiel E, Nagorsen D. In situ analysis of FOXP3+ regulatory T cells in human colorectal cancer. J Transl Med 2006; 4: 52.ArticlePubMedPMCPDF
- 12. Yoon HH, Orrock JM, Foster NR, Sargent DJ, Smyrk TC, Sinicrope FA. Prognostic impact of FoxP3+ regulatory T cells in relation to CD8+ T lymphocyte density in human colon carcinomas. PLoS One 2012; 7: e42274.ArticlePubMedPMC
- 13. Svensson H, Olofsson V, Lundin S, et al. Accumulation of CCR4(+)CTLA-4 FOXP3(+)CD25(hi) regulatory T cells in colon adenocarcinomas correlate to reduced activation of conventional T cells. PLoS One 2012; 7: e30695.ArticlePubMedPMC
- 14. Ladoire S, Martin F, Ghiringhelli F. Prognostic role of FOXP3+ regulatory T cells infiltrating human carcinomas: the paradox of colorectal cancer. Cancer Immunol Immunother 2011; 60: 909-918. ArticlePubMedPMCPDF
- 15. Suzuki H, Chikazawa N, Tasaka T, et al. Intratumoral CD8 (+) T/FOXP3 (+) cell ratio is a predictive marker for survival in patients with colorectal cancer. Cancer Immunol Immunother 2010; 59: 653-661. ArticlePubMedPDF
- 16. Tosolini M, Kirilovsky A, Mlecnik B, et al. Clinical impact of different classes of infiltrating T cytotoxic and helper cells (Th1, th2, treg, th17) in patients with colorectal cancer. Cancer Res 2011; 71: 1263-1271. ArticlePubMedPDF
- 17. Brown JR, DuBois RN. COX-2: a molecular target for colorectal cancer prevention. J Clin Oncol 2005; 23: 2840-2855. ArticlePubMed
- 18. Baratelli F, Lin Y, Zhu L, et al. Prostaglandin E2 induces FOXP3 gene expression and T regulatory cell function in human CD4+ T cells. J Immunol 2005; 175: 1483-1490. ArticlePubMedPDF
- 19. Shimizu K, Nakata M, Hirami Y, Yukawa T, Maeda A, Tanemoto K. Tumor-infiltrating Foxp3+ regulatory T cells are correlated with cyclooxygenase-2 expression and are associated with recurrence in resected non-small cell lung cancer. J Thorac Oncol 2010; 5: 585-590. ArticlePubMed
- 20. Ueno H, Murphy J, Jass JR, Mochizuki H, Talbot IC. Tumour 'budding' as an index to estimate the potential of aggressiveness in rectal cancer. Histopathology 2002; 40: 127-132. ArticlePubMedPDF
- 21. Vignali DA, Collison LW, Workman CJ. How regulatory T cells work. Nat Rev Immunol 2008; 8: 523-532. ArticlePubMedPMCPDF
- 22. Sreeramkumar V, Fresno M, Cuesta N. Prostaglandin E2 and T cells: friends or foes? Immunol Cell Biol 2012; 90: 579-586. ArticlePubMedPDF
- 23. Bergmann C, Strauss L, Zeidler R, Lang S, Whiteside TL. Expansion of human T regulatory type 1 cells in the microenvironment of cyclooxygenase 2 overexpressing head and neck squamous cell carcinoma. Cancer Res 2007; 67: 8865-8873. ArticlePubMedPDF
- 24. Zlobec I, Lugli A, Baker K, et al. Role of APAF-1, E-cadherin and peritumoral lymphocytic infiltration in tumour budding in colorectal cancer. J Pathol 2007; 212: 260-268. PubMed
- 25. Lugli A, Karamitopoulou E, Panayiotides I, et al. CD8+ lymphocytes/tumour-budding index: an independent prognostic factor representing a 'pro-/anti-tumour' approach to tumour host interaction in colorectal cancer. Br J Cancer 2009; 101: 1382-1392. ArticlePubMedPMCPDF
- 26. Arany I, Adler-Storthz K, Chen Z, Tyring SK, Brysk MM. Tumor differentiation-dependent local immunity in human head and neck cancers. Cancer Lett 1998; 123: 173-176. ArticlePubMed
- 27. Lee SY, Miyai K, Han HS, et al. Microsatellite instability, EMAST, and morphology associations with T cell infiltration in colorectal neoplasia. Dig Dis Sci 2012; 57: 72-78. ArticlePubMedPDF
REFERENCES
Fig. 1Immunohistochemical staining of CD8 (A-D) and forkhead box P3 (E-H) of non-neoplastic colon (A, E), low-grade tubular adenoma (B, F), high-grade tubular adenoma (C, G), and invasive colorectal cancer (D, H). The degree of CD8+ T cell infiltration is progressively decreased, while that of regulatory T cells infiltration gradually increased during colorectal cancer development.
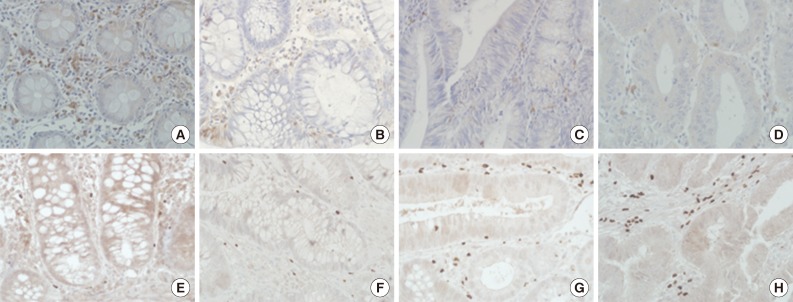
Fig. 2Analysis of the number of both T cell types (A) and CD8+ T cells/regulatory T cells (Tregs) ratio (B) in the center of lesions during colorectal cancer (CRC) development. The number of CD8+ T cells decreases progressively, while the number of Tregs gradually increases during CRC development (p<.001). The number of CD8+ T cells and Tregs in neoplastic diseases is significantly different from that of non-neoplastic diseases (p<.001) and that of both T cell types in low-grade tubular adenoma is also significantly different from that in high-grade tubular adenoma and CRC (p<.001 for Tregs, p=.002 for CD8+ T cells). The ratio progressively decreases during CRC development (p<.001). It is significantly higher in non-neoplastic conditions than in neoplastic diseases and that of low-grade tubular adenoma is also significantly higher than that of other neoplastic diseases (p<.001).
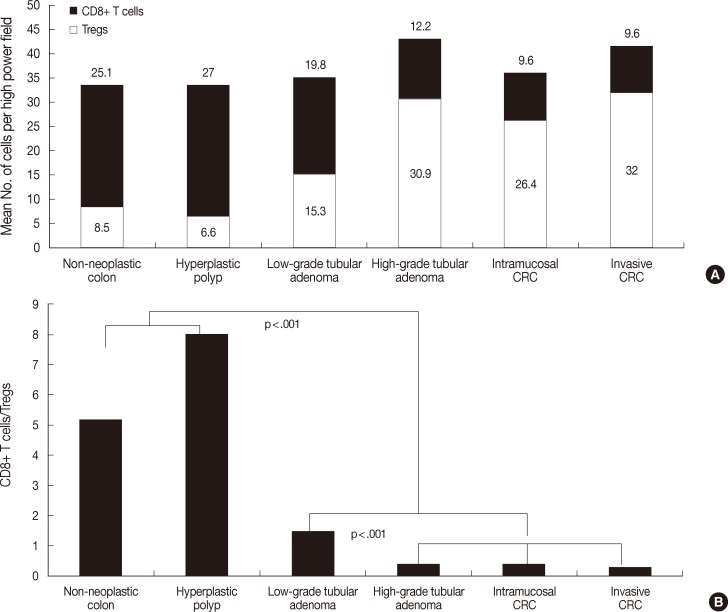
Fig. 3Analysis of the number of both T cells (A) and CD8+ T cells/regulatory T cells (Tregs) ratio (B) in the tumor boundary during colorectal cancer (CRC) development. The number of Tregs is significantly higher in high-grade tubular adenoma and invasive CRC than in low-grade tubular adenoma (p<.001). In contrast, there is no significant difference in the number of CD8+ T cells between groups. The ratio is significantly lower in high-grade tubular adenoma and invasive CRC than in low-grade tubular adenoma (p<.001).
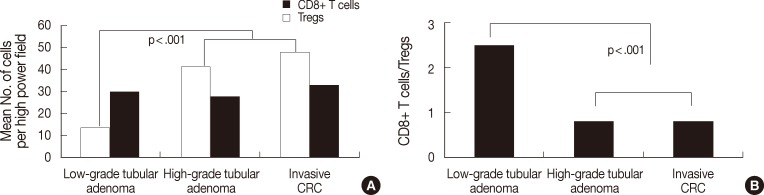
Fig. 4Analysis of the distribution of the number of both T cells (A) and CD8+ T cells/regulatory T cells (Tregs) ratio (B) among tumor compartments of tubular adenomas and invasive colorectal cancer (CRC). Low-grade tubular adenoma shows a higher number of CD8+ T cells in the boundary than in the tumor center (p=.01), and high-grade tubular adenoma reveals a higher number of both T cells in the boundary than in the tumor center (p=.009 for Tregs, p<.001 for CD8+ T cells). In the case of invasive CRC, the number of CD8+ T cells is higher in both the invasive front and boundary than in other areas and lowest in the tumor center (p<.001). The number of Tregs is lowest in adjacent non-neoplastic mucosa, while other findings are similar to those for CD8+ T cell distribution (p<.001). The ratio in the tumor center is the lowest in both tubular adenomas and invasive CRC (p=.017 for low-grade tubular adenoma, p=.003 for high-grade tubular adenoma, p<.001 for invasive CRC).

Fig. 5Immunohistochemical staining of cyclooxygenase-2 (COX-2) in low-grade tubular adenoma (A), high-grade tubular adenoma (B) and invasive colorectal cancer (CRC) (C), and a relationship between COX-2 expression and the number of regulatory T cells (Tregs) in tumors and all subjects (D). COX-2 expression is mainly localized in the subepithelial stromal cells in the periluminal region of tubular adenomas and CRC (arrows). The number of Tregs is significantly higher in tissues with COX-2 expression than in tissues with no COX-2 expression (p<.001). This finding is also found when applied to only neoplastic diseases (p=.005).
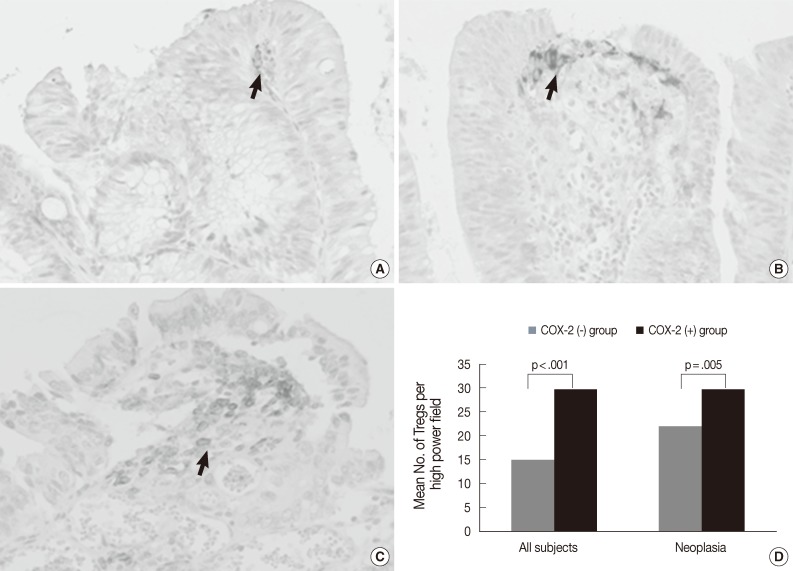
Table 1.Characteristics of patients
Table 2.The number of CD8+ T cells and Tregs, and the CD8+ T cells/Tregs ratio among tumor compartment according to clinicopathological parameters in invasive CRC
| Variable | Group |
Location of CD8+ T cells |
Location of Tregs |
Location of CD8+ T cells/Tregs |
|||||||||
|---|---|---|---|---|---|---|---|---|---|---|---|---|---|
| Tumor center | Invasive front | Boundary | Adjacent tissue | Tumor center | Invasive front | Boundary | Adjacent tissue | Tumor center | Invasive front | Boundary | Adjacent tissue | ||
| Gender | Male | 8.0 ± 6.6 | 28.1 ± 9.9 | 31.6 ± 9.0 | 23.1 ± 5.0 | 32.5 ± 12.8 | 54.2 ± 25.3 | 49.9 ± 19.8 | 13.3 ± 6.2 | 0.25 ± 0.19 | 0.57 ± 0.24 | 0.78 ± 0.52 | 2.27 ± 1.38 |
| Female | 12.4 ± 9.2 | 53.4 ± 25.9* | 34.4 ± 17.2 | 25.3 ± 17.4 | 31.0 ± 13.8 | 54.3 ± 26.4 | 44.1 ± 12.6 | 9.6 ± 3.9 | 0.41 ± 0.19* | 1.10 ± 0.57* | 0.78 ± 0.38 | 3.03 ± 2.12 | |
| Differentiation | Well | 10.3 ± 5.6 | 60.4 ± 30.3* | 34.1 ± 13.9 | 32.0 ± 22.7 | 29.0 ± 6.6 | 72.5 ± 35.9 | 58.1 ± 25.9 | 15.4 ± 5.0 | 0.35 ± 0.18 | 1.10 ± 0.81 | 0.72 ± 0.42 | 2.57 ± 2.65 |
| Moderate to poor | 9.5 ± 8.3 | 33.3 ± 16.7 | 32.5 ± 12.8 | 22.2 ± 6.8 | 32.5 ± 13.8 | 50.9 ± 22.1 | 45.2 ± 14.4 | 11.1 ± 5.6 | 0.30 ± 0.21 | 0.71 ± 0.36 | 0.79 ± 0.48 | 2.56 ± 1.53 | |
| Depth | T2 | 9.5 ± 6.1 | 63.7 ± 31.8* | 31.0 ± 19.9 | 21.2 ± 4.9 | 34.5 ± 14.8 | 81.2 ± 35.4* | 52.0 ± 21.6 | 13.9 ± 5.3 | 0.32 ± 0.21 | 0.98 ± 0.79 | 0.70 ± 0.48 | 1.67 ± 0.57 |
| T3 | 9.7 ± 8.2 | 32.7 ± 15.2 | 33.2 ± 11.2 | 24.6 ± 12.3 | 31.5 ± 12.9 | 49.3 ± 20.1 | 46.7 ± 16.6 | 11.4 ± 5.7 | 0.31 ± 0.21 | 0.73 ± 0.39 | 0.79 ± 0.47 | 2.26 ± 1.82 | |
| Location | Proximal | 8.6 ± 7.8 | 34.1 ± 15.1 | 35.1 ± 9.9 | 29.1 ± 15.3* | 33.8 ± 16.3 | 55.3 ± 20.7 | 56.2 ± 114.8 | 14.5 ± 5.5 | 0.25 ± 0.16 | 0.68 ± 0.34 | 0.68 ± 0.31 | 2.44 ± 1.87 |
| Distal | 10.4 ± 8.0 | 39.9 ± 24.7 | 31.4 ± 14.3 | 20.7 ± 6.5 | 30.7 ± 10.4 | 53.5 ± 28.6 | 42.2 ± 17.0 | 10.1 ± 5.2 | 0.35 ± 0.22 | 0.84 ± 0.53 | 0.83 ± 0.54 | 2.65 ± 1.66 | |
| Node metastasis | Absence | 11.2 ± 8.3 | 37.6 ± 22.0 | 32.6 ± 14.9 | 24.9 ± 13.6 | 30.2 ± 11.5 | 54.9 ± 26.6 | 49.4 ± 17.7 | 11.7 ± 5.2 | 0.37 ± 0.21* | 0.81 ± 0.56 | 0.68 ± 0.32 | 2.60 ± 1.80 |
| Presence | 6.7 ± 6.1 | 37.5 ± 20.9 | 33.1 ± 7.7 | 22.3 ± 5.5 | 35.3 ± 15.4 | 53.0 ± 23.8 | 44.3 ± 17.1 | 12.1 ± 6.6 | 0.20 ± 0.14 | 0.71 ± 0.21 | 0.95 ± 0.64 | 2.50 ± 1.65 | |
| Tumor bud | < 10 | 13.5 ± 10.1 | 50.1 ± 27.1* | 37.0 ± 13.1 | 27.9 ± 15.1 | 37.3 ± 11.2 | 62.9 ± 32.0 | 44.8 ± 20.0 | 12.1 ± 5.1 | 0.37 ± 0.22 | 0.90 ± 0.54 | 0.97 ± 0.60 | 2.90 ± 2.04 |
| ≥ 10 | 7.6 ± 5.7 | 31.0 ± 14.4 | 29.8 ± 12.1 | 21.4 ± 7.7 | 29.2 ± 13.2 | 49.7 ± 20.4 | 49.5 ± 15.8 | 11.7 ± 6.1 | 0.28 ± 0.20 | 0.70 ± 0.41 | 0.65 ± 0.31 | 2.35 ± 1.50 | |
Figure & Data
References
Citations
Citations to this article as recorded by 
- Revealing shared molecular markers and mechanisms in colorectal cancer and COVID-19 through bioinformatics and machine learning
Hairui Wang, Haodong Yao, Wenchao Niu, Rongchang Xing, Lu Cai, Zuoxin Xi, Shichen Gao, Lina Zhao
Briefings in Bioinformatics.2026;[Epub] CrossRef - T-cell Subset Features and Distributions Evolve across the Colorectal Precancer–Cancer Spectrum
Yasutoshi Takashima, Andressa Dias Costa, Naohiko Akimoto, Tomotaka Ugai, Phoenix Bell, Juha P. Väyrynen, Jason L. Hornick, Mari Mino-Kenudson, Yuxue Zhong, Satoko Ugai, Koichiro Haruki, Qian Yao, Kosuke Matsuda, Mayu Higashioka, Daniel D. Buchanan, Amand
Cancer Immunology Research.2026; 14(1): 46. CrossRef - Tumor budding in colorectal cancer: partial EMT, microenvironmental remodeling, and metastatic competence
Ting Wang, Huanhuan Fei, Xiaofan Liu, Linzhu Zhang, Wei Liang, Xiaowei Wei, Fei Fei
Biochemical and Biophysical Research Communications.2026; 830: 154238. CrossRef - The Roles of Vitamin D Receptor (VDR) and CD8+ T‐Lymphocytes in Acral and Mucosal Melanoma Invasion Depth
Hermin Aminah Usman, Fitria Sholihah, Birgitta M. Dewayani, Octavianus Giovani
Journal of Cutaneous Pathology.2025; 52(3): 227. CrossRef - The Immune Environment in Colorectal Adenoma: A Systematic Review
Ugne Silinskaite, Jurate Valciukiene, Matas Jakubauskas, Tomas Poskus
Biomedicines.2025; 13(3): 699. CrossRef - Tumor Microenvironment and Immune Response in Lip Cancer
Anastasia G. Gkegka, Michael I. Koukourakis, Maria Lambropoulou, Alexandra Giatromanolaki
Cancers.2023; 15(5): 1478. CrossRef - Regenerating gene 4 promotes chemoresistance of colorectal cancer by affecting lipid droplet synthesis and assembly
Cong-Yu Zhang, Rui Zhang, Li Zhang, Zi-Mo Wang, Hong-Zhi Sun, Zheng-Guo Cui, Hua-Chuan Zheng
World Journal of Gastroenterology.2023; 29(35): 5104. CrossRef - Molecular mechanisms of tumour budding and its association with microenvironment in colorectal cancer
Phimmada Hatthakarnkul, Jean A. Quinn, Aula Ammar, Gerard Lynch, Hester Van Wyk, Donald C. McMillan, Chanitra Thuwajit, Joanne Edwards
Clinical Science.2022; 136(8): 521. CrossRef - Attackers and defenders: tumor buds and lymphocytes as morphological biomarkers in colorectal cancer
Sonay Kus Öztürk, Tariq S. Haddad, Inti Zlobec, Alessandro Lugli, Iris D. Nagtegaal
Diagnostic Histopathology.2022; 28(11): 480. CrossRef - The prognostic impact of the immune microenvironment in small-cell neuroendocrine carcinoma of the uterine cervix: PD-L1 and immune cell subtypes
Xiaoying Sun, Lili Liu, Ting Wan, Qidan Huang, Jieping Chen, Rongzhen Luo, Jihong Liu
Cancer Cell International.2022;[Epub] CrossRef - Preinvasive Colorectal Lesions of African Americans Display an Immunosuppressive Signature Compared to Caucasian Americans
Kristin Wallace, Georges J. Nahhas, Christine Bookhout, David N. Lewin, Chrystal M. Paulos, Nana Nikolaishvili-Feinberg, Stephanie M. Cohen, Silvia Guglietta, Ali Bakhtiari, E. Ramsay Camp, Elizabeth G. Hill, John A. Baron, Jennifer D. Wu, Alexander V. Al
Frontiers in Oncology.2021;[Epub] CrossRef - Cancer Immunoprevention: Current Status and Future Directions
Mahsa Keshavarz-Fathi, Nima Rezaei
Archivum Immunologiae et Therapiae Experimentalis.2021;[Epub] CrossRef - Transcriptomic Analyses of the Adenoma-Carcinoma Sequence Identify Hallmarks Associated With the Onset of Colorectal Cancer
Qin Hong, Bing Li, Xiumei Cai, Zhengtao Lv, Shilun Cai, Yunshi Zhong, Bo Wen
Frontiers in Oncology.2021;[Epub] CrossRef - Immune Responses Vary in Preinvasive Colorectal Lesions by Tumor Location and Histology
Kristin Wallace, Georges J. El Nahas, Christine Bookhout, Jessica E. Thaxton, David N. Lewin, Nana Nikolaishvili-Feinberg, Stephanie M. Cohen, J. Grant Brazeal, Elizabeth G. Hill, Jennifer D. Wu, John A. Baron, Alexander V. Alekseyenko
Cancer Prevention Research.2021; 14(9): 885. CrossRef - CD103+ T Lymphocyte Count Linked to the Thickness of Invasion on Acral Melanoma without E-Cadherin Involvement
Fauzan Ali Zainal Abidin, Hermin Aminah Usman, Sri Suryanti, Bethy S Hernowo
Clinical, Cosmetic and Investigational Dermatology.2021; Volume 14: 1783. CrossRef - FOXP3 and CD25 double staining antibody cocktails identify regulatory T cells in different types of tumor tissues using tissue microarrays
Xinmin Liu, Xiaohong Wang, Jianmin Ding, Yan Gao, Yiming Zhao, Ruihua Zhao, Qigang Sun, Songlin Zhang
Annals of Diagnostic Pathology.2019; 38: 67. CrossRef - Epithelial CD80 promotes immune surveillance of colonic preneoplastic lesions and its expression is increased by oxidative stress through STAT3 in colon cancer cells
Chiara Marchiori, Melania Scarpa, Andromachi Kotsafti, Susan Morgan, Matteo Fassan, Vincenza Guzzardo, Andrea Porzionato, Imerio Angriman, Cesare Ruffolo, Stefania Sut, Stefano Dall’Acqua, Romeo Bardini, Raffaele De Caro, Carlo Castoro, Marco Scarpa, Igna
Journal of Experimental & Clinical Cancer Research.2019;[Epub] CrossRef - Automated Analysis of Lymphocytic Infiltration, Tumor Budding, and Their Spatial Relationship Improves Prognostic Accuracy in Colorectal Cancer
Ines P. Nearchou, Kate Lillard, Christos G. Gavriel, Hideki Ueno, David J. Harrison, Peter D. Caie
Cancer Immunology Research.2019; 7(4): 609. CrossRef - Colorectal cancer prevention: Immune modulation taking the stage
Rochelle Fletcher, Yi-Jun Wang, Robert E. Schoen, Olivera J. Finn, Jian Yu, Lin Zhang
Biochimica et Biophysica Acta (BBA) - Reviews on Cancer.2018; 1869(2): 138. CrossRef - The Major Role of NF-κB in the Depth of Invasion on Acral Melanoma by Decreasing CD8+ T Cells
Hermin Aminah Usman, Bethy S. Hernowo, Maringan Diapari Lumban Tobing, Reti Hindritiani
Journal of Pathology and Translational Medicine.2018; 52(3): 164. CrossRef - Increased number of arginase 1-positive cells in the stroma of carcinomas compared to precursor lesions and nonneoplastic tissues
Tae Jung Jang, Sun A. Kim, Min Kyung Kim
Pathology - Research and Practice.2018; 214(8): 1179. CrossRef - Hematopoietic stem cell specific V-ATPase controls breast cancer progression and metastasis via cytotoxic T cells
Manoranjan Sahoo, Gajendra K. Katara, Mahmood Y. Bilal, Safaa A. Ibrahim, Arpita Kulshrestha, Sara Fleetwood, Kimiko Suzue, Kenneth D. Beaman
Oncotarget.2018; 9(69): 33215. CrossRef - Morphoproteomic-Guided Host-Directed Therapy for Tuberculosis
Robert E. Brown, Robert L. Hunter, Shen-An Hwang
Frontiers in Immunology.2017;[Epub] CrossRef - O-GlcNAcylation is associated with the development and progression of gastric carcinoma
Tae Jung Jang, Ui Jung Kim
Pathology - Research and Practice.2016; 212(7): 622. CrossRef - The Immune Landscapes of Polypoid and Nonpolypoid Precancerous Colorectal Lesions
Antonella Maglietta, Rosalia Maglietta, Teresa Staiano, Ramona Bertoni, Nicola Ancona, Giancarlo Marra, Leonardo Resta, Hiroshi Shiku
PLOS ONE.2016; 11(7): e0159373. CrossRef - Analysis of CD8+ Treg cells in patients with ovarian cancer: a possible mechanism for immune impairment
Shuping Zhang, Xing Ke, Suyun Zeng, Meng Wu, Jianfang Lou, Lei Wu, Peijun Huang, Lei Huang, Fang Wang, Shiyang Pan
Cellular & Molecular Immunology.2015; 12(5): 580. CrossRef - The Distribution of CD8- and Foxp3-positive T Cells in Skin Squamous Cell Tumors and Basal Cell Carcinomas
Tae Jung Jang
Journal of Life Science.2015; 25(6): 686. CrossRef - Correlation between infiltration of FOXP3+ regulatory T cells and expression of B7-H1 in the tumor tissues of gastric cancer
Jingying Hou, Zhong Yu, Rengyun Xiang, Chuqiang Li, Lin Wang, Shufen Chen, Qingyun Li, Mei Chen, Linyun Wang
Experimental and Molecular Pathology.2014; 96(3): 284. CrossRef - Methionine enkephalin (MENK) improves lymphocyte subpopulations in human peripheral blood of 50 cancer patients by inhibiting regulatory T cells (Tregs)
Qiushi Wang, Xinghua Gao, Zhe Yuan, Zhe Wang, Yiming Meng, Yan Cao, Nicolas P Plotnikoff, Noreen Griffin, Fengping Shan
Human Vaccines & Immunotherapeutics.2014; 10(7): 1836. CrossRef
 PubReader
 ePub Link
-
 Cite this Article
- Cite this Article
-
- Close
- Download Citation
- Close
- Figure
-


Progressive Increase of Regulatory T Cells and Decrease of CD8+ T Cells and CD8+ T Cells/Regulatory T Cells Ratio during Colorectal Cancer Development


Fig. 1 Immunohistochemical staining of CD8 (A-D) and forkhead box P3 (E-H) of non-neoplastic colon (A, E), low-grade tubular adenoma (B, F), high-grade tubular adenoma (C, G), and invasive colorectal cancer (D, H). The degree of CD8+ T cell infiltration is progressively decreased, while that of regulatory T cells infiltration gradually increased during colorectal cancer development.
Fig. 2 Analysis of the number of both T cell types (A) and CD8+ T cells/regulatory T cells (Tregs) ratio (B) in the center of lesions during colorectal cancer (CRC) development. The number of CD8+ T cells decreases progressively, while the number of Tregs gradually increases during CRC development (p<.001). The number of CD8+ T cells and Tregs in neoplastic diseases is significantly different from that of non-neoplastic diseases (p<.001) and that of both T cell types in low-grade tubular adenoma is also significantly different from that in high-grade tubular adenoma and CRC (p<.001 for Tregs, p=.002 for CD8+ T cells). The ratio progressively decreases during CRC development (p<.001). It is significantly higher in non-neoplastic conditions than in neoplastic diseases and that of low-grade tubular adenoma is also significantly higher than that of other neoplastic diseases (p<.001).
Fig. 3 Analysis of the number of both T cells (A) and CD8+ T cells/regulatory T cells (Tregs) ratio (B) in the tumor boundary during colorectal cancer (CRC) development. The number of Tregs is significantly higher in high-grade tubular adenoma and invasive CRC than in low-grade tubular adenoma (p<.001). In contrast, there is no significant difference in the number of CD8+ T cells between groups. The ratio is significantly lower in high-grade tubular adenoma and invasive CRC than in low-grade tubular adenoma (p<.001).
Fig. 4 Analysis of the distribution of the number of both T cells (A) and CD8+ T cells/regulatory T cells (Tregs) ratio (B) among tumor compartments of tubular adenomas and invasive colorectal cancer (CRC). Low-grade tubular adenoma shows a higher number of CD8+ T cells in the boundary than in the tumor center (p=.01), and high-grade tubular adenoma reveals a higher number of both T cells in the boundary than in the tumor center (p=.009 for Tregs, p<.001 for CD8+ T cells). In the case of invasive CRC, the number of CD8+ T cells is higher in both the invasive front and boundary than in other areas and lowest in the tumor center (p<.001). The number of Tregs is lowest in adjacent non-neoplastic mucosa, while other findings are similar to those for CD8+ T cell distribution (p<.001). The ratio in the tumor center is the lowest in both tubular adenomas and invasive CRC (p=.017 for low-grade tubular adenoma, p=.003 for high-grade tubular adenoma, p<.001 for invasive CRC).
Fig. 5 Immunohistochemical staining of cyclooxygenase-2 (COX-2) in low-grade tubular adenoma (A), high-grade tubular adenoma (B) and invasive colorectal cancer (CRC) (C), and a relationship between COX-2 expression and the number of regulatory T cells (Tregs) in tumors and all subjects (D). COX-2 expression is mainly localized in the subepithelial stromal cells in the periluminal region of tubular adenomas and CRC (arrows). The number of Tregs is significantly higher in tissues with COX-2 expression than in tissues with no COX-2 expression (p<.001). This finding is also found when applied to only neoplastic diseases (p=.005).
Fig. 1
Fig. 2
Fig. 3
Fig. 4
Fig. 5
Progressive Increase of Regulatory T Cells and Decrease of CD8+ T Cells and CD8+ T Cells/Regulatory T Cells Ratio during Colorectal Cancer Development
| Variable | No. of cases | Age distribution (yr) | Gender (male:female) |
|---|---|---|---|
| Non-neoplastic colon | 17 | 43-76 | 11:6 |
| Hyperplasitc polyp | 15 | 22-67 | 9:6 |
| Low-grade tubular adenoma | 22 | 35-78 | 12:10 |
| High-grade tubular adenoma | 27 | 42-82 | 20:7 |
| Intramucosal CRC | 10 | 52-78 | 5:5 |
| Invasive CRC | 32 | 57-87 | 20:12 |
| Variable | Group | Location of CD8+ T cells |
Location of Tregs |
Location of CD8+ T cells/Tregs |
|||||||||
|---|---|---|---|---|---|---|---|---|---|---|---|---|---|
| Tumor center | Invasive front | Boundary | Adjacent tissue | Tumor center | Invasive front | Boundary | Adjacent tissue | Tumor center | Invasive front | Boundary | Adjacent tissue | ||
| Gender | Male | 8.0 ± 6.6 | 28.1 ± 9.9 | 31.6 ± 9.0 | 23.1 ± 5.0 | 32.5 ± 12.8 | 54.2 ± 25.3 | 49.9 ± 19.8 | 13.3 ± 6.2 | 0.25 ± 0.19 | 0.57 ± 0.24 | 0.78 ± 0.52 | 2.27 ± 1.38 |
| Female | 12.4 ± 9.2 | 53.4 ± 25.9 |
34.4 ± 17.2 | 25.3 ± 17.4 | 31.0 ± 13.8 | 54.3 ± 26.4 | 44.1 ± 12.6 | 9.6 ± 3.9 | 0.41 ± 0.19 |
1.10 ± 0.57 |
0.78 ± 0.38 | 3.03 ± 2.12 | |
| Differentiation | Well | 10.3 ± 5.6 | 60.4 ± 30.3 |
34.1 ± 13.9 | 32.0 ± 22.7 | 29.0 ± 6.6 | 72.5 ± 35.9 | 58.1 ± 25.9 | 15.4 ± 5.0 | 0.35 ± 0.18 | 1.10 ± 0.81 | 0.72 ± 0.42 | 2.57 ± 2.65 |
| Moderate to poor | 9.5 ± 8.3 | 33.3 ± 16.7 | 32.5 ± 12.8 | 22.2 ± 6.8 | 32.5 ± 13.8 | 50.9 ± 22.1 | 45.2 ± 14.4 | 11.1 ± 5.6 | 0.30 ± 0.21 | 0.71 ± 0.36 | 0.79 ± 0.48 | 2.56 ± 1.53 | |
| Depth | T2 | 9.5 ± 6.1 | 63.7 ± 31.8 |
31.0 ± 19.9 | 21.2 ± 4.9 | 34.5 ± 14.8 | 81.2 ± 35.4 |
52.0 ± 21.6 | 13.9 ± 5.3 | 0.32 ± 0.21 | 0.98 ± 0.79 | 0.70 ± 0.48 | 1.67 ± 0.57 |
| T3 | 9.7 ± 8.2 | 32.7 ± 15.2 | 33.2 ± 11.2 | 24.6 ± 12.3 | 31.5 ± 12.9 | 49.3 ± 20.1 | 46.7 ± 16.6 | 11.4 ± 5.7 | 0.31 ± 0.21 | 0.73 ± 0.39 | 0.79 ± 0.47 | 2.26 ± 1.82 | |
| Location | Proximal | 8.6 ± 7.8 | 34.1 ± 15.1 | 35.1 ± 9.9 | 29.1 ± 15.3 |
33.8 ± 16.3 | 55.3 ± 20.7 | 56.2 ± 114.8 | 14.5 ± 5.5 | 0.25 ± 0.16 | 0.68 ± 0.34 | 0.68 ± 0.31 | 2.44 ± 1.87 |
| Distal | 10.4 ± 8.0 | 39.9 ± 24.7 | 31.4 ± 14.3 | 20.7 ± 6.5 | 30.7 ± 10.4 | 53.5 ± 28.6 | 42.2 ± 17.0 | 10.1 ± 5.2 | 0.35 ± 0.22 | 0.84 ± 0.53 | 0.83 ± 0.54 | 2.65 ± 1.66 | |
| Node metastasis | Absence | 11.2 ± 8.3 | 37.6 ± 22.0 | 32.6 ± 14.9 | 24.9 ± 13.6 | 30.2 ± 11.5 | 54.9 ± 26.6 | 49.4 ± 17.7 | 11.7 ± 5.2 | 0.37 ± 0.21 |
0.81 ± 0.56 | 0.68 ± 0.32 | 2.60 ± 1.80 |
| Presence | 6.7 ± 6.1 | 37.5 ± 20.9 | 33.1 ± 7.7 | 22.3 ± 5.5 | 35.3 ± 15.4 | 53.0 ± 23.8 | 44.3 ± 17.1 | 12.1 ± 6.6 | 0.20 ± 0.14 | 0.71 ± 0.21 | 0.95 ± 0.64 | 2.50 ± 1.65 | |
| Tumor bud | < 10 | 13.5 ± 10.1 | 50.1 ± 27.1 |
37.0 ± 13.1 | 27.9 ± 15.1 | 37.3 ± 11.2 | 62.9 ± 32.0 | 44.8 ± 20.0 | 12.1 ± 5.1 | 0.37 ± 0.22 | 0.90 ± 0.54 | 0.97 ± 0.60 | 2.90 ± 2.04 |
| ≥ 10 | 7.6 ± 5.7 | 31.0 ± 14.4 | 29.8 ± 12.1 | 21.4 ± 7.7 | 29.2 ± 13.2 | 49.7 ± 20.4 | 49.5 ± 15.8 | 11.7 ± 6.1 | 0.28 ± 0.20 | 0.70 ± 0.41 | 0.65 ± 0.31 | 2.35 ± 1.50 | |
Table 1. Characteristics of patients
CRC, colorectal cancer.
Table 2. The number of CD8+ T cells and Tregs, and the CD8+ T cells/Tregs ratio among tumor compartment according to clinicopathological parameters in invasive CRC
Tregs, regulatory T cells; CRC, colorectal cancer. p<.05.

