Articles
- Page Path
- HOME > J Pathol Transl Med > Volume 47(6); 2013 > Article
-
Original Article
Microtubule-Associated Protein Tau, α-Tubulin and βIII-Tubulin Expression in Breast Cancer - Soyoung Im, Changyoung Yoo, Ji-Han Jung, Ye-Won Jeon1, Young Jin Suh1, Youn Soo Lee2, Hyun Joo Choi
-
Korean Journal of Pathology 2013;47(6):534-540.
DOI: https://doi.org/10.4132/KoreanJPathol.2013.47.6.534
Published online: December 24, 2013
Department of Hospital Pathology, St. Vincent's Hospital, The Catholic University of Korea College of Medicine, Suwon, Korea.
1Department of Surgery, St. Vincent's Hospital, The Catholic University of Korea College of Medicine, Suwon, Korea.
2Department of Hospital Pathology, Seoul St. Mary's Hospital, The Catholic University of Korea College of Medicine, Seoul, Korea.
- Corresponding Author: Hyun Joo Choi, M.D. Department of Hospital Pathology, St. Vincent Hospital, The Catholic University of Korea College of Medicine, 93 Jungbu-daero, Paldal-gu, Suwon 442-723, Korea. Tel: +82-31-249-7592, Fax: +82-31-244-6786, chj0103@catholic.ac.kr
© 2013 The Korean Society of Pathologists/The Korean Society for Cytopathology
This is an Open Access article distributed under the terms of the Creative Commons Attribution Non-Commercial License (http://creativecommons.org/licenses/by-nc/3.0/) which permits unrestricted non-commercial use, distribution, and reproduction in any medium, provided the original work is properly cited.
Figure & Data
References
Citations

- Cytoskeletal dynamics in breast cancer: mechanistic insights and therapeutic opportunities
RamaRao Malla, Anshu Tumbali, Pavani Chode, Krithika Manda, Anuveda Sree Samudrala, Yerusha Nuthalapati, Charanteja Mangam, Priyamvada Bhamidipati, Mundla Srilatha, Ganji Purnachandra Nagaraju
Journal of the National Cancer Center.2025;[Epub] CrossRef - Genes Related to Motility in an Ionizing Radiation and Estrogen Breast Cancer Model
Tania Koning, Gloria M. Calaf
Biology.2024; 13(11): 849. CrossRef - Tubulin Isotypes: Emerging Roles in Defining Cancer Stem Cell Niche
Tessy Thomas Maliekal, Dhrishya Dharmapal, Suparna Sengupta
Frontiers in Immunology.2022;[Epub] CrossRef - RAD6 inhibition enhances paclitaxel sensitivity of triple negative breast cancer cells by aggravating mitotic spindle damage
Brittany M. Haynes, Kristen Cunningham, Malathy P. V. Shekhar
BMC Cancer.2022;[Epub] CrossRef - Influence of Paclitaxel and Doxorubicin Therapy of ßIII-Tubulin, Carbonic Anhydrase IX, and Survivin in Chemically Induced Breast Cancer in Female Rat
Alena Pastornická, Silvia Rybárová, Slávka Drahošová, Jozef Mihalik, Andrea Kreheľová, Andriana Pavliuk-Karachevtseva, Ingrid Hodorová
International Journal of Molecular Sciences.2021; 22(12): 6363. CrossRef - Intelligently thermoresponsive flower-like hollow nano-ruthenium system for sustained release of nerve growth factor to inhibit hyperphosphorylation of tau and neuronal damage for the treatment of Alzheimer's disease
Hui Zhou, Youcong Gong, Yanan Liu, Anlian Huang, Xufeng Zhu, Jiawei Liu, Guanglong Yuan, Li Zhang, Ji-an Wei, Jie Liu
Biomaterials.2020; 237: 119822. CrossRef - HE4 promotes collateral resistance to cisplatin and paclitaxel in ovarian cancer cells
J. R. Ribeiro, C. Schorl, N. Yano, N. Romano, K. K. Kim, R. K. Singh, R. G. Moore
Journal of Ovarian Research.2016;[Epub] CrossRef - A strategy to identify housekeeping genes suitable for analysis in breast cancer diseases
Tatiana M. Tilli, Cláudio da Silva Castro, Jack A. Tuszynski, Nicolas Carels
BMC Genomics.2016;[Epub] CrossRef - Increased expression of αTubulin is associated with poor prognosis in patients with pancreatic cancer after surgical resection
Chao Lin, Guo-chao Zhao, Ya-dong Xu, Dan-song Wang, Da-yong Jin, Yuan Ji, Wen-hui Lou, Wen-chuan Wu
Oncotarget.2016; 7(37): 60657. CrossRef - Oblongifolin C inhibits metastasis by up-regulating keratin 18 and tubulins
Xiaoyu Wang, Yuanzhi Lao, Naihan Xu, Zhichao Xi, Man Wu, Hua Wang, Xiyi Li, Hongsheng Tan, Menghong Sun, Hongxi Xu
Scientific Reports.2015;[Epub] CrossRef - Regulation of human MAPT gene expression
Marie-Laure Caillet-Boudin, Luc Buée, Nicolas Sergeant, Bruno Lefebvre
Molecular Neurodegeneration.2015;[Epub] CrossRef
 PubReader
 ePub Link
-
 Cite this Article
- Cite this Article
-
- Close
- Download Citation
- Close
- Figure


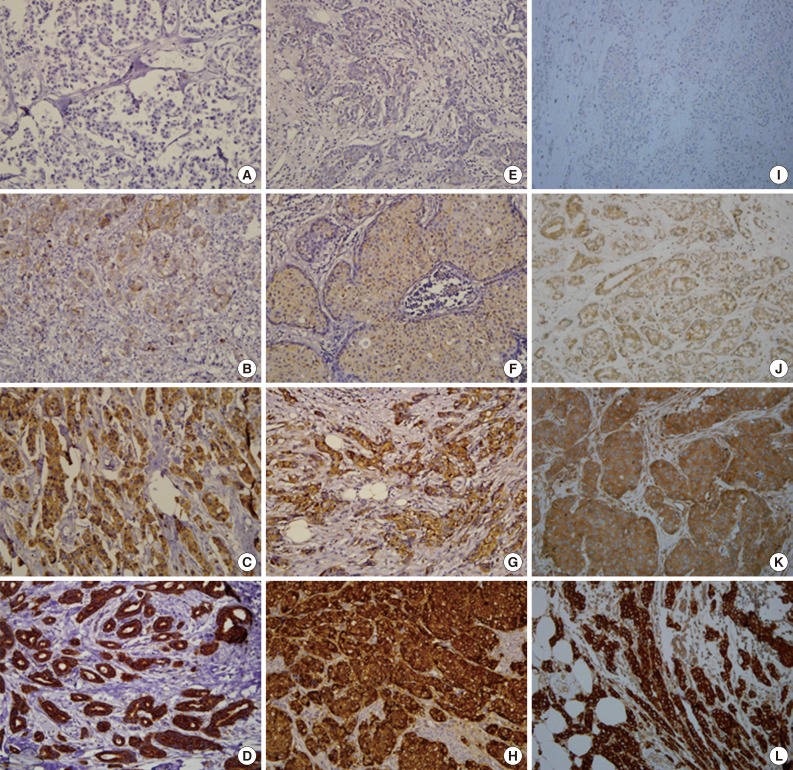
Fig. 1
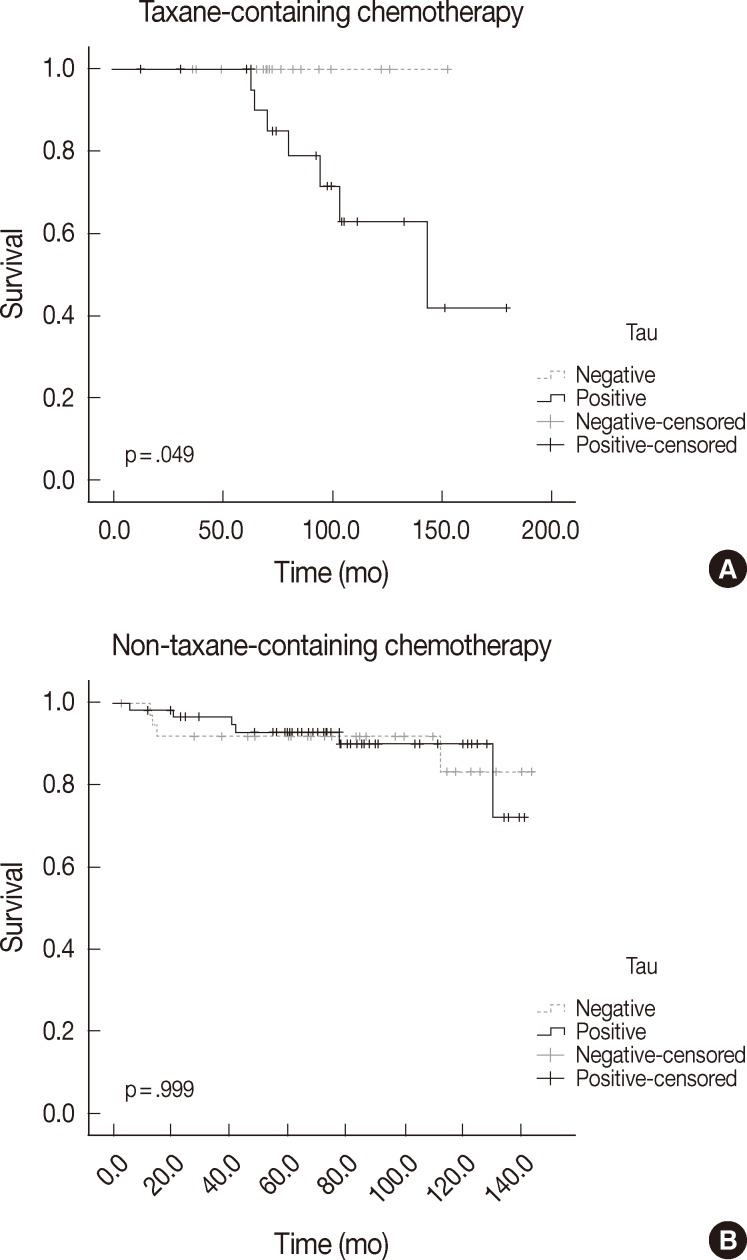
Fig. 2
| Clinicopathologic factor | No. of cases (%) | No. of positive cases (%) |
||||||
|---|---|---|---|---|---|---|---|---|
| Tau | p-value | α-Tubulin | p-value | βIII-Tubulin | p-value | |||
| Age (yr) | < 50 | 99 (54.1) | 66 (57.9) | .185 | 35 (64.8) | .060 | 65 (58.6) | .133 |
| ≥ 50 | 84 (45.9) | 48 (42.1) | 19 (35.2) | 46 (41.4) | ||||
| T stage | 1 | 59 (32.2) | 39 (34.2) | .602 | 20 (37.0) | .425 | 40 (36.0) | .257 |
| 2 | 107 (58.5) | 66 (57.9) | 31 (57.4) | 63 (56.8) | ||||
| 3 | 17 (9.3) | 9 (7.9) | 3 (5.6) | 8 (7.2) | ||||
| LN metastasis | 0 | 96 (52.5) | 49 (43.0) | .003 |
36 (66.7) | .032 |
69 (62.2) | .004 |
| 1-3 | 52 (28.4) | 41 (36.0) | 9 (16.7) | 24 (21.6) | ||||
| ≥ 4 | 35 (19.1) | 24 (21.1) | 9 (16.7) | 18 (16.2) | ||||
| Stage | I | 34 (18.6) | 20 (17.5) | .135 | 15 (27.8) | .079 | 25 (22.5) | .077 |
| II | 102 (55.7) | 59 (51.8) | 29 (53.7) | 63 (56.8) | ||||
| III | 47 (25.7) | 35 (30.7) | 10 (18.5) | 23 (20.7) | ||||
| Nuclear grade | 1 | 11 (6.0) | 11 (9.6) | < .001 |
3 (5.6) | .843 | 6 (5.4) | .006 |
| 2 | 100 (54.6) | 69 (60.5) | 28 (51.9) | 51 (45.9) | ||||
| 3 | 72 (39.3) | 34 (29.8) | 23 (42.6) | 54 (48.6) | ||||
| Histologic grade | 1 | 31 (16.9) | 28 (24.6) | < .001 |
7 (13.0) | .341 | 18 (16.2) | .001 |
| 2 | 75 (41.0) | 52 (45.6) | 20 (37.0) | 35 (31.5) | ||||
| 3 | 77 (42.1) | 34 (29.8) | 27 (50.0) | 58 (52.3) | ||||
| ER | – | 94 (51.4) | 35 (30.7) | < .001 |
28 (51.9) | .932 | 71 (64.0) | < .001 |
| + | 89 (48.6) | 79 (69.3) | 26 (48.1) | 40 (36.0) | ||||
| PR | – | 106 (57.9) | 48 (42.1) | < .001 |
31 (57.4) | .927 | 70 (63.1) | .080 |
| + | 77 (42.1) | 66 (57.9) | 23 (42.6) | 41 (36.9) | ||||
| HER2 | – | 129 (70.5) | 90 (78.9) | .001 |
43 (79.6) | .079 | 77 (69.4) | .679 |
| + | 54 (29.5) | 24 (21.1) | 11 (20.4) | 34 (30.6) | ||||
| Total (n = 183) | Local recurrence |
Distant metastasis |
Disease related death |
||||||||
|---|---|---|---|---|---|---|---|---|---|---|---|
| – | + | p-value | – | + | p-value | – | + | p-value | |||
| Tau | – | 69 (37.7) | 65 (94.2) | 4 (5.8) | .463 | 59 (85.5) | 10 (14.5) | .589 | 64 (92.8) | 5 (7.2) | .279 |
| + | 114 (62.3) | 104 (91.2) | 10 (8.8) | 94 (82.5) | 20 (17.5) | 100 (87.7) | 14 (12.3) | ||||
| α-Tubulin | – | 129 (70.5) | 116 (89.9) | 13 (10.1) | .056 | 103 (79.8) | 26 (20.2) | .034 |
113 (87.6) | 16 (12.4) | .166 |
| + | 54 (29.5) | 53 (98.1) | 1 (1.9) | 50 (92.6) | 4 (7.4) | 51 (94.4) | 3 (5.6) | ||||
| βIII-Tubulin | – | 72 (39.3) | 65 (90.3) | 7 (9.7) | .396 | 59 (81.9) | 13 (18.1) | .625 | 62 (86.1) | 10 (13.9) | .210 |
| + | 111(60.7) | 104 (93.7) | 7 (6.3) | 94 (84.7) | 17 (15.3) | 102 (91.9) | 19 (10.4) | ||||
| Non-taxane-containing regimen |
Taxane-containing regimen |
Chemotherapy received patients |
||||||||
|---|---|---|---|---|---|---|---|---|---|---|
| n = 97 | No. of progressions (%) | p-value | n = 45 | No. of progressions (%) | p-value | n = 142 | No. of progressions (%) | p-value | ||
| Tau | – | 37 | 7 (18.9) | .943 | 19 | 1 (5.3) | .001 |
56 | 8 (14.3) | .041 |
| + | 60 | 11 (18.3) | 26 | 14 (53.8) | 86 | 25 (29.1) | ||||
| α-Tubulin | – | 70 | 15 (21.4) | .241 | 29 | 13 (44.8) | .028 |
99 | 28 (28.3) | .031 |
| + | 27 | 3 (11.1) | 16 | 2 (12.5) | 43 | 5 (11.6) | ||||
| βIII-Tubulin | – | 44 | 8 (18.2) | .931 | 17 | 9 (52.9) | .030 |
61 | 17 (27.9) | .257 |
| + | 53 | 10 (18.9) | 28 | 6 (21.4) | 81 | 16 (19.8) | ||||
| Kaplan-Meier analysis |
||||
|---|---|---|---|---|
| n | No. of deceased | p-value | ||
| Age (yr) | < 50 | 99 | 10 | .659 |
| ≥ 50 | 84 | 9 | ||
| T stage | 1 | 59 | 4 | .151 |
| 2 | 107 | 11 | ||
| 3 | 17 | 4 | ||
| LN metastasis | 0 | 96 | 2 | < .000 |
| 1-3 | 52 | 11 | ||
| ≥ 4 | 35 | 6 | ||
| Stage | I | 34 | 1 | .017 |
| II | 102 | 9 | ||
| III | 47 | 9 | ||
| Tau | – | 69 | 5 | .258 |
| + | 114 | 14 | ||
| α-Tubulin | – | 129 | 16 | .169 |
| + | 54 | 3 | ||
| βIII-Tubulin | – | 72 | 10 | .325 |
| + | 111 | 9 | ||
| Taxane-containing chemotherapy group | ||||
| Tau | – | 19 | 0 | .049 |
| + | 26 | 7 | ||
| α-Tubulin | – | 29 | 7 | .066 |
| + | 16 | 0 | ||
| βIII-Tubulin | – | 17 | 4 | .396 |
| + | 28 | 3 | ||
| Non-taxane-containing chemotherapy group | ||||
| Tau | – | 37 | 4 | .999 |
| + | 60 | 6 | ||
| α-Tubulin | – | 70 | 8 | .578 |
| + | 27 | 2 | ||
| βIII-Tubulin | – | 44 | 4 | .758 |
| + | 53 | 6 | ||
LN, lymph node; ER, estrogen receptor; PR, progesterone receptor. Statistically significant (p<.05).
Values are presented as number (%). Statistically significant (p<.05).
Statistically significant (p<.05).
LN, lymph node. Statistically significant (p<.05).

 E-submission


