 E-submission
Articles
- Page Path
- HOME > J Pathol Transl Med > Volume 48(2); 2014 > Article
-
Original Article
IMP3, a Promising Prognostic Marker in Clear Cell Renal Cell Carcinoma - Ji Young Park, Misun Choe, Yuna Kang, Sang Sook Lee
-
Korean Journal of Pathology 2014;48(2):108-116.
DOI: https://doi.org/10.4132/KoreanJPathol.2014.48.2.108
Published online: April 28, 2014
Department of Pathology, Keimyung University School of Medicine, Daegu, Korea.
- Corresponding Author: Misun Choe, M.D. Department of Pathology, Keimyung University School of Medicine, 56 Dalseong-ro, Jung-gu, Daegu 700-712, Korea. Tel: +82-53-580-3815, Fax: +82-53-580-3823, msc@dsmc.or.kr
© 2014 The Korean Society of Pathologists/The Korean Society for Cytopathology
This is an Open Access article distributed under the terms of the Creative Commons Attribution Non-Commercial License (http://creativecommons.org/licenses/by-nc/3.0/) which permits unrestricted non-commercial use, distribution, and reproduction in any medium, provided the original work is properly cited.

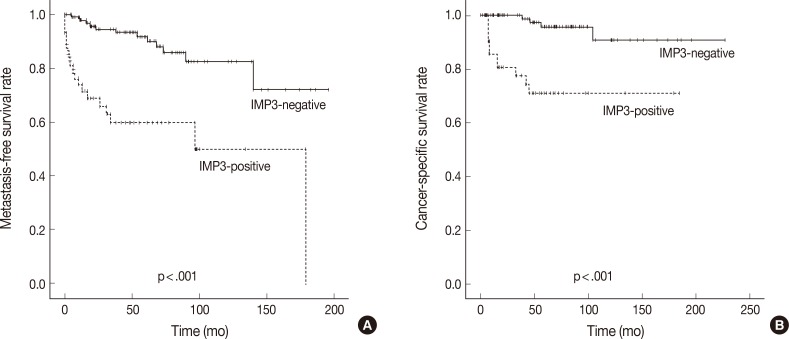
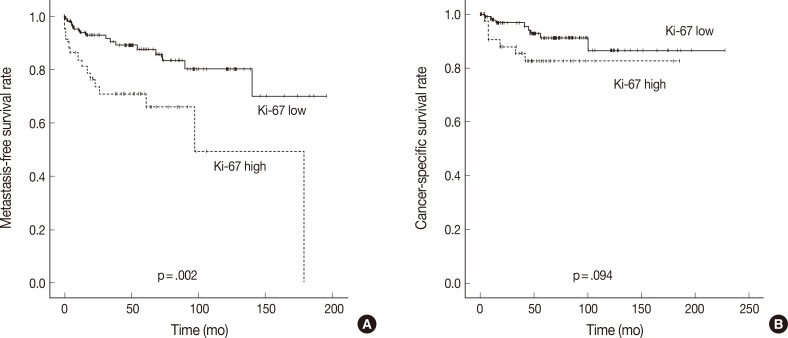

Figure & Data
References
Citations
- IMP3 Immunohistochemical Expression Is Related with Progression and Metastases in Xenografted and Cutaneous Melanomas
Natividad Martin-Morales, Miguel Padial-Molina, Isabel Tovar, Virginea De Araujo Farias, Pedro Hernández-Cortés, Esperanza Ramirez-Moreno, Mercedes Caba-Molina, Justin Davis, Alejandro Carrero Castaño, Jose Mariano Ruiz de Almodovar, Pablo Galindo-Moreno,
Pathobiology.2024; 91(2): 132. CrossRef - circRARS synergises with IGF2BP3 to regulate RNA methylation recognition to promote tumour progression in renal cell carcinoma
Yuenan Liu, Kailei Chen, Yi Shou, Sen Li, Jun Wang, Qingyang Zhang, Ziwei Huang, Jiaju Xu, Mingfeng Li, Di Liu, Huageng Liang, Hongmei Yang, Xiaoping Zhang
Clinical and Translational Medicine.2023;[Epub] CrossRef - Prognostic value of insulin‑like growth factor 2 mRNA‑binding protein 3 and vascular endothelial growth factor‑A in patients with primary non‑small‑cell lung cancer
Jiannan Liu, Ying Liu, Wenjing Gong, Xiangshuo Kong, Congcong Wang, Shuhua Wang, Aina Liu
Oncology Letters.2019;[Epub] CrossRef - Epithelial‑mesenchymal transition in colorectal carcinoma cells is mediated by DEK/IMP3
Shuping You, Yun Guan, Weihong Li
Molecular Medicine Reports.2017;[Epub] CrossRef
 PubReader
 ePub Link
-
 Cite this Article
- Cite this Article
-
- Close
- Download Citation
- Close
- Figure
-
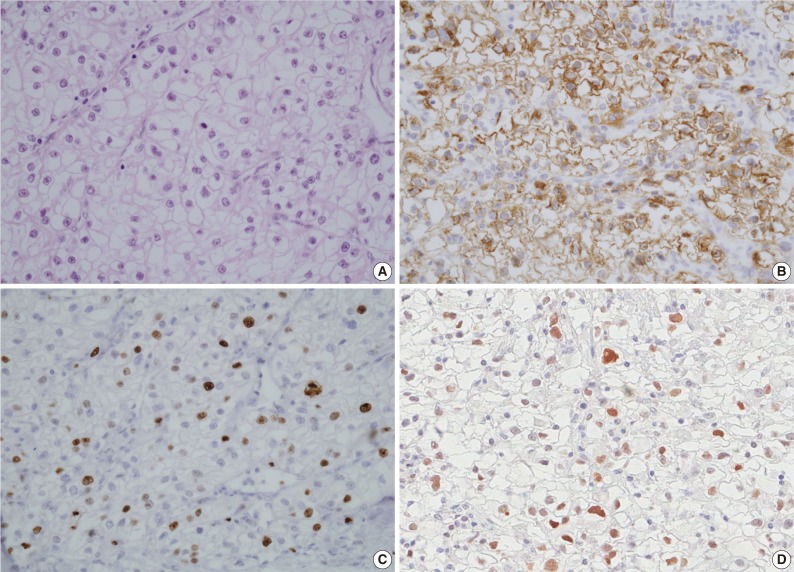


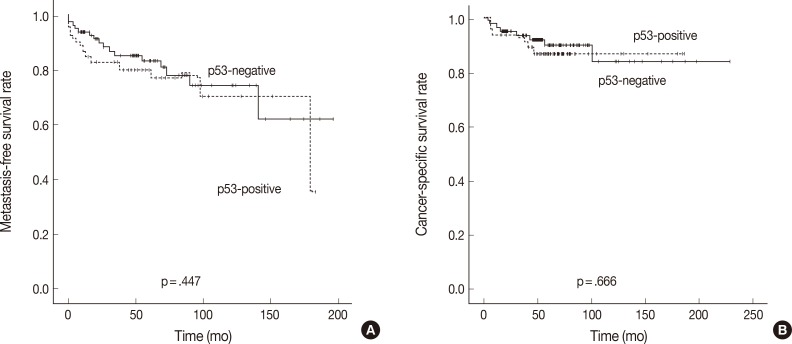


Fig. 1
Fig. 2
Fig. 3
Fig. 4
| Feature | IMP3 expression |
p-value | |
|---|---|---|---|
| Negative (n = 105) | Positive (n = 43) | ||
| Age (yr) | 55.9± 11.7 (19-82) | 56.9± 11.6 (26-76) | .648 |
| Size (cm) | 5.2 ± 2.2 (2-11) | 6.6 ± 2.8 (1.0-14.0) | .001 |
| Sex | .158 | ||
| Male | 73 (69.5) | 35 (81.4) | |
| Female | 32 (30.5) | 8 (18.6) | |
| pT stage | .001 | ||
| pT1 | 74 (70.5) | 20 (46.5) | |
| pT2 | 20 (19.0) | 7 (16.3) | |
| pT3 | 11 (10.5) | 15 (34.9) | |
| pT4 | 0 (0) | 1 (2.3) | |
| Nuclear grade | <.001 | ||
| 1 | 2 (1.9) | 0 (0) | |
| 2 | 35 (33.3) | 2 (4.7) | |
| 3 | 68 (64.8) | 31 (72.1) | |
| 4 | 0 (0) | 10 (23.3) | |
| Sarcomatoid change | <.001 | ||
| Absent | 105 (100) | 37 (0) | |
| Present | 0 (0) | 6 (100) | |
| Distant metastasis | <.001 | ||
| Absent | 93 (88.6) | 25 (58.1) | |
| Present | 12 (11.4) | 18 (41.9) | |
| Outcome | <.001 | ||
| Alive | 101 (96.2) | 32 (74.4) | |
| Died of disease | 4 (3.8) | 11 (25.6) | |
| Feature | n | p53 positive (n=61) |
Ki-67 high (n = 44) |
||
|---|---|---|---|---|---|
| n (%) | p-value | n (%) | p-value | ||
| Sex | .092 | .242 | |||
| Male | 108 | 49 (69.5) | 35 (79.5) | ||
| Female | 40 | 12 (30.5) | 9 (20.5) | ||
| pT stage | .966 | <.001 | |||
| pT1 | 94 | 40 (65.8) | 21 (47.7) | ||
| pT2 | 27 | 9 (14.8) | 7 (15.9) | ||
| pT3 | 26 | 11 (18.0) | 15 (34.1) | ||
| pT4 | 1 | 1 (1.6) | 1 (2.3) | ||
| Nuclear grade | .605 | <.001 | |||
| 1 | 2 | 1 (1.6) | 0 (0) | ||
| 2 | 37 | 15 (24.6) | 4 (9.1) | ||
| 3 | 99 | 39 (63.9) | 33 (75.0) | ||
| 4 | 10 | 6 (9.8) | 7 (15.9) | ||
| Sarcomatoid change | .23 | .009 | |||
| Absent | 142 | 57 (93.4) | 39 (88.6) | ||
| Present | 6 | 4 (6.6) | 5 (11.4) | ||
| Distant metastasis | .497 | .007 | |||
| Absent | 118 | 47 (77.0) | 29 (65.9) | ||
| Present | 30 | 14 (23.0) | 15 (34.1) | ||
| Outcome | .651 | .130 | |||
| Survival | 133 | 54 (88.5) | 37 (84.1) | ||
| Died of disease | 15 | 7 (11.5) | 7 (15.9) | ||
| Feature | Tumor IMP3 expression |
p-value | |
|---|---|---|---|
| Negative (n = 105) | Positive (n=43) | ||
| p53 | <.001 | ||
| Negative | 72 (68.6) | 15 (34.9) | |
| Positive | 33 (31.4) | 28 (65.1) | |
| Ki-67 PI | <.001 | ||
| Low (<10%) | 87 (82.9) | 17 (39.5) | |
| High (≥ 10%) | 18 (17.1) | 26 (60.5) | |
| Feature | Metastasis |
Died of disease |
||||
|---|---|---|---|---|---|---|
| Absent (n = 118) | Present (n=30) | p-value | Absent (n = 133) | Present (n = 15) | p-value | |
| Age (yr) | 55.4±11.7 | 59.3±13.1 | .100 | 56.1±11.7 | 57.5±11.2 | .663 |
| Size (cm) | 5.3±2.4 | 6.8±2.6 | .002 | 5.5±2.4 | 6. 9±3.0 | .034 |
| Sex | .332 | .357 | ||||
| Male | 84 (71.2) | 24 (80.0) | 95 (71.4) | 13 (86.7) | ||
| Female | 34 (28.8) | 6 (20.0) | 38 (28.6) | 2 (13.3) | ||
| pT stage | <.001 | <.001 | ||||
| pT1 | 82 (69.5) | 12 (40.0) | 88 (69.5) | 6 (40.0) | ||
| pT2 | 24 (20.3) | 3 (10.0) | 27 (20.3) | 0 (0.0) | ||
| pT3 | 12 (10.2) | 14 (46.7) | 18 (10.2) | 8 (53.3) | ||
| pT4 | 0 (0) | 1 (3.3) | 0 (0) | 1 (6.7) | ||
| Nuclear grade | <.001 | <.001 | ||||
| 1 | 2 (1.7) | 0 (0) | 2 (1.5) | 0 (0) | ||
| 2 | 36 (30.5) | 1 (3.3) | 36 (27.1) | 1 (6.7) | ||
| 3 | 78 (66.1) | 21 (70.0) | 91 (68.4) | 8 (53.3) | ||
| 4 | 2 (1.7) | 8 (26.7) | 4 (3.0) | 6 (40.0) | ||
| Sarcomatoid change | .001 | <.001 | ||||
| Absent | 117 (99.1) | 25 (83.3) | 132 (99.2) | 10 (66.6) | ||
| Present | 1 (0.9) | 5 (16.7) | 1 (0.8) | 5 (33.4) | ||
| IMP3 | <.001 | <.001 | ||||
| Negative | 93 (78.8) | 12 (40.0) | 101 (71.2) | 4 (26.7) | ||
| Positive | 25 (21.2) | 18 (60.0) | 32 (28.8) | 11(73.3) | ||
| p53 | .497 | .651 | ||||
| Negative | 71 (60.2) | 16 (53.3) | 79 (59.4) | 8 (53.3) | ||
| Positive | 47 (39.8) | 14 (46.7) | 54 (40.6) | 7 (46.7) | ||
| Ki-67 PI | .007 | .130 | ||||
| Low (<10%) | 89 (75.4) | 15 (50.0) | 96 (72.2) | 8 (53.3) | ||
| High (> 10%) | 29 (24.6) | 15 (50.0) | 37 (27.8) | 7 (46.7) | ||
Values are presented as mean±standard deviation (range) or number of patients (%). The bold values indicate a statistically significant difference (p<.05). IMP3, insulin-like growth factor II mRNA-binding protein 3.
Values are presented as number of patients (%). The bold values indicate a statistically significant difference (p<0.05).
Values are presented as number of patients (%). The bold values indicate a statistically significant difference (p<.05). IMP3, insulin-like growth factor II mRNA-binding protein 3; PI, proliferating index.
Values are presented as mean±standard deviation or number of patients (%). The bold values indicate a statistically significant difference (p<.05). IMP3, insulin-like growth factor II mRNA-binding protein 3; PI, proliferating index.

