Warning: mkdir(): Permission denied in /home/virtual/lib/view_data.php on line 81

Warning: fopen(upload/ip_log/ip_log_2024-11.txt): failed to open stream: No such file or directory in /home/virtual/lib/view_data.php on line 83

Warning: fwrite() expects parameter 1 to be resource, boolean given in /home/virtual/lib/view_data.php on line 84
A scoring system for the diagnosis of non-alcoholic steatohepatitis from liver biopsy
Skip Navigation
Skip to contents

J Pathol Transl Med : Journal of Pathology and Translational Medicine

OPEN ACCESS
SEARCH
Search

Articles

Page Path
HOME > J Pathol Transl Med > Volume 54(3); 2020 > Article
Original Article
A scoring system for the diagnosis of non-alcoholic steatohepatitis from liver biopsy
Kyoungbun Lee1,2orcid, Eun Sun Jung1,3orcid, Eunsil Yu1,4orcid, Yun Kyung Kang1,5orcid, Mee-Yon Cho1,6orcid, Joon Mee Kim1,7orcid, Woo Sung Moon1,8orcid, Jin Sook Jeong1,9orcid, Cheol Keun Park1,10orcid, Jae-Bok Park1,11orcid, Dae Young Kang1,12orcid, Jin Hee Sohn1,13orcid, So-Young Jin,1,14orcid
Journal of Pathology and Translational Medicine 2020;54(3):228-236.
DOI: https://doi.org/10.4132/jptm.2020.03.07
Published online: April 15, 2020

1Gastrointestinal Pathology Study Group of the Korean Society of Pathologists, Korea

2Department of Pathology, Seoul National University College of Medicine, Seoul, Korea

3Department of Pathology, Seoul St. Mary’s Hospital, College of Medicine, The Catholic University of Korea, Seoul, Korea

4Department of Pathology, Asan Medical Center, University of Ulsan College of Medicine, Seoul, Korea

5Department of Pathology, Inje University Seoul Paik Hospital, Seoul, Korea

6Department of Pathology, Yonsei University Wonju College of Medicine, Wonju, Korea

7Department of Pathology, Inha University Hospital, Incheon, Korea

8Department of Pathology, Jeonbuk National University Medical School, Jeonju, Korea

9Department of Pathology, Dong-A University College of Medicine, Busan, Korea

10Department of Pathology, Anatomic Pathology Reference Lab., Seegene Medical Foundation, Seoul, Korea

11Department of Pathology, Daegu Catholic University School of Medicine, Daegu, Korea

12Department of Pathology, Chungnam National University Hospital, Chungnam National University School of Medicine, Daejeon, Korea

13Department of Pathology, Kangbuk Samsung Hospital, Sungkyunkwan University School of Medicine, Seoul, Korea

14Department of Pathology, Soon Chun Hyang University Seoul Hospital, Seoul, Korea

Corresponding Author: So-Young Jin, MD, Department of Pathology, Soon Chun Hyang University Seoul Hospital, 59 Daesagwan-ro, Yongsan-gu, Seoul 04401, Korea Tel: +82-2-709-9424, Fax: +82-2-709-9441, E-mail: jin0924@schmc.ac.kr
• Received: December 27, 2019   • Revised: March 16, 2020   • Accepted: March 17, 2020

© 2020 The Korean Society of Pathologists/The Korean Society for Cytopathology

This is an Open Access article distributed under the terms of the Creative Commons Attribution Non-Commercial License (http://creativecommons.org/licenses/by-nc/4.0) which permits unrestricted non-commercial use, distribution, and reproduction in any medium, provided the original work is properly cited.

prev next
  • 5,872 Views
  • 237 Download
  • 5 Web of Science
  • 6 Crossref
  • 5 Scopus
  • Background
    Liver biopsy is the essential method to diagnose non-alcoholic steatohepatitis (NASH), but histological features of NASH are too subjective to achieve reproducible diagnoses in early stages of disease. We aimed to identify the key histological features of NASH and devise a scoring model for diagnosis.
  • Methods
    Thirteen pathologists blindly assessed 12 histological factors and final histological diagnoses (‘not-NASH,’ ‘borderline,’ and ‘NASH’) of 31 liver biopsies that were diagnosed as non-alcoholic fatty liver disease (NAFLD) or NASH before and after consensus. The main histological parameters to diagnose NASH were selected based on histological diagnoses and the diagnostic accuracy and agreement of 12 scoring models were compared for final diagnosis and the NAFLD Activity Score (NAS) system.
  • Results
    Inter-observer agreement of final diagnosis was fair (κ = 0.25) before consensus and slightly improved after consensus (κ = 0.33). Steatosis at more than 5% was the essential parameter for diagnosis. Major diagnostic factors for diagnosis were fibrosis except 1C grade and presence of ballooned cells. Minor diagnostic factors were lobular inflammation (≥ 2 foci/ × 200 field), microgranuloma, and glycogenated nuclei. All 12 models showed higher inter-observer agreement rates than NAS and post-consensus diagnosis (κ = 0.52–0.69 vs. 0.33). Considering the reproducibility of factors and practicability of the model, summation of the scores of major (× 2) and minor factors may be used for the practical diagnosis of NASH.
  • Conclusions
    A scoring system for the diagnosis of NAFLD would be helpful as guidelines for pathologists and clinicians by improving the reproducibility of histological diagnosis of NAFLD.
Hepatic steatosis has long been regarded as a general morphological change caused by a variety of etiologies, e.g., alcohol, viral hepatitis, drugs or toxins, or metabolic disease. Alcoholic steatohepatitis is a prototype of fatty liver disease but excessive alcohol consumption is regarded as a major challenge to studying the disease. Recently, abnormal hepatic steatosis, irrespective of inducing agents, has been classified as an independent disease that can lead to hepatocellular damage, can progress into chronic liver disease, and increase the incidence of liver cancer. Non-alcoholic fatty liver disease (NAFLD) is a disease entity characterized by hepatic steatosis without a history of significant alcohol use or other known liver disease. Metabolic syndrome, obesity, hyperlipidemia, nutritional imbalance associated with gastro-intestinal surgery, or parenteral nutrition are risk factors for NAFLD.
NAFLD is part of a hepatic steatosis spectrum that ranges from simple steatosis without clinical abnormality to steatohepatitis with manifestation of clinical symptoms. Clinical assessment, including abnormal liver function tests, radiologic findings, presence of subjective symptoms, other causes of liver disease, or consumption of alcohol or drugs, etc., is critical information for diagnosing NAFLD. A histological assessment with liver biopsy is considered the only means by which to judge simple steatosis and non-alcoholic steatohepatitis (NASH). The degree of steatosis, evidence of hepatocyte injury, and presence of fibrosis, which implies chronic liver injury or the possibility of progression to chronic liver disease, are the major factors that help to discriminate simple steatosis and steatohepatitis. Several grading systems have been published by US and European pathologists since Brunt et al. [1] published the first grading system in 1999 [2-5]. Common morphologic factors include the degree of steatosis, inflammation, ballooning change of hepatocytes indicating cellular damage, and fibrosis reflecting the chronicity of liver disease. These systems play an important role in providing quantitative assessment criteria for NAFLD, but they generally do not provide diagnostic criteria for judging if the disease is so called simple steatosis or NASH [3]. However, clinicians and researchers require pathologists to identify simple steatosis versus NASH for treatment or clinical study.
Classifications for simple steatosis or NASH differ depending on the researcher, and the histomorphological criteria for NAFLD pathological features in liver tissue remains subjective with low reproducibility. Thus, in this study we divided NAFLD into three diagnostic categories: ‘not-NASH,’ ‘borderline,’ and ‘NASH,’ and evaluated diagnostic agreement and proposed a diagnostic scoring system that could increase diagnostic consistency and accuracy.
Case selection and histological review
Thirteen pathologists reviewed 31 liver biopsies that were clinically and pathologically diagnosed as NAFLD from 10 hospitals (Daegu Catholic University Medical Center, Dong-A University Hospital, Samsung Medical Center, Seoul National University Hospital, Inje University Seoul Paik Hospital, Seoul St. Mary’s Hospital, Soon Chun Hyang University Seoul Hospital, Wonju Severance Christian Hospital, Inha University Hospital, Chungnam National University Hospital). The selection criteria were clinically NAFLD (non-alcoholic, serologically negative for viral and autoimmune markers, abnormal levels of liver enzymes such as aspartate aminotransferase and alanine aminotransferase), and aged ≥ 19 years. Cirrhosis cases were excluded. Drug and toxic injuries were excluded. One hematoxylin and eosin and one Masson’s Trichrome–stained slide for each case were prepared anonymously and randomized by a researcher not involved in the study. Pathologists blindly assessed 12 histological parameters and made a final diagnosis of one of three diagnostic categories: ‘not-NASH,’ ‘borderline,’ and ‘NASH,’ in 31 liver biopsies. Twelve histological parameters and detailed scoring criteria were followed as previously reported [6].
Evaluation of diagnostic agreement, selection of histological parameters, and comparison of diagnostic models
The review was blindly conducted twice before and after the consensus meeting. Pre-consensus and post-consensus diagnostic agreements were compared, and selection of diagnostic parameters and modeling were based on the post-consensus results. The gold standard was the diagnosis that accounted for more than half of the participants’ agreements after consensus. Final diagnosis agreement rates were assessed by Free-Marginal Multirater Kappa (multirater κfree) [7]. Among the 12 histological parameters, histological parameters that significantly discriminated ‘not-NASH,’ ‘borderline,’ and ‘NASH’ were selected by chi-square test, univariate, and multivariate repeated measures logistic regression analysis. A p-value of <.05 was considered statistically significant. All statistical analyses (except kappa analysis) were performed using IBM SPSS statistics ver. 21 (IBM Corp., Armonk, NY, USA). The Kappa value was calculated using an online Kappa Calculator [8]. The cut-off value of the weighted model was determined by the receiver operating characteristic (ROC) curve.
Ethics statement
The Institutional Review Board of Seoul St. Mary’s Hospital approved this study with a waiver of informed consent (KIRB-00562_5-001).
Distribution of diagnoses and diagnostic agreement of NAFLD
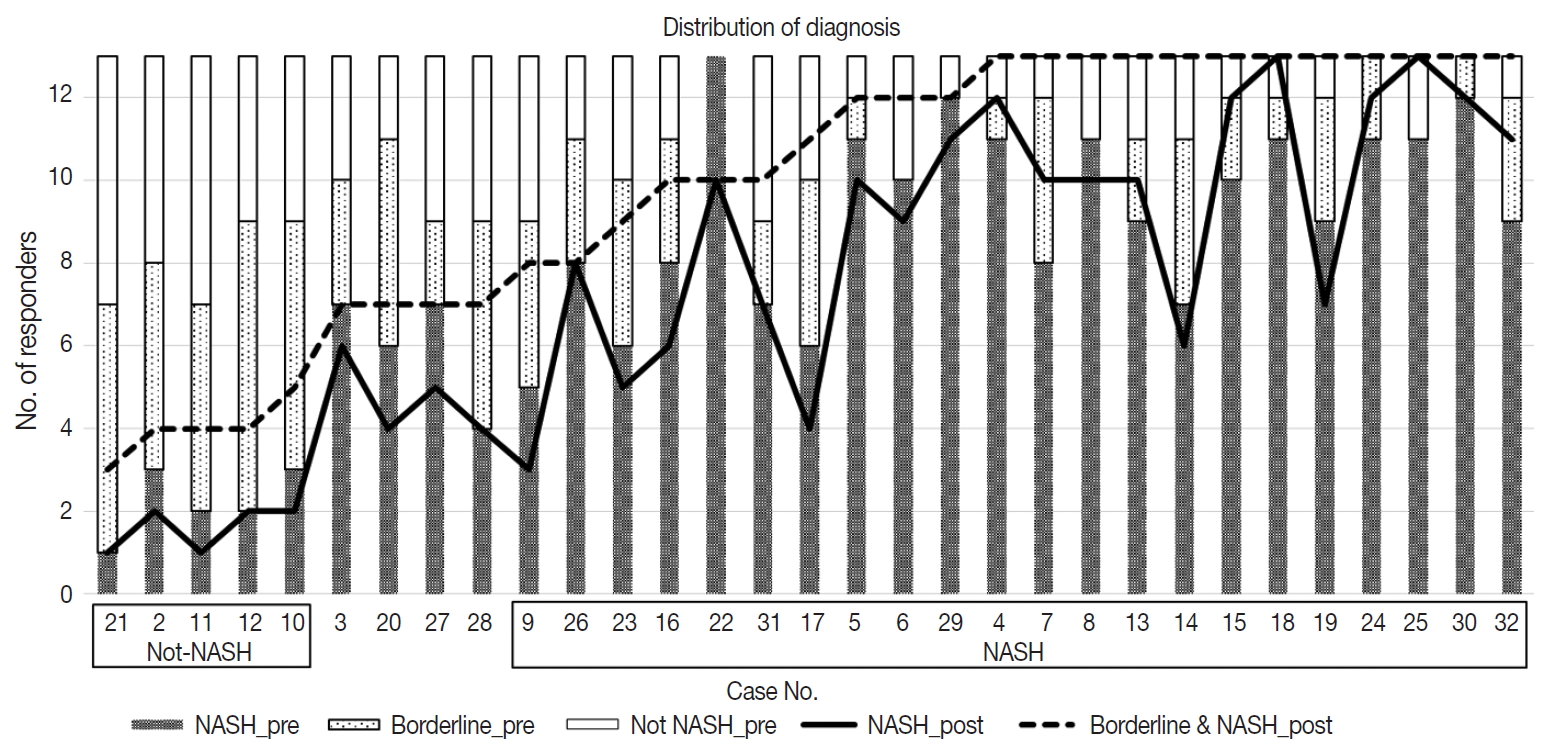
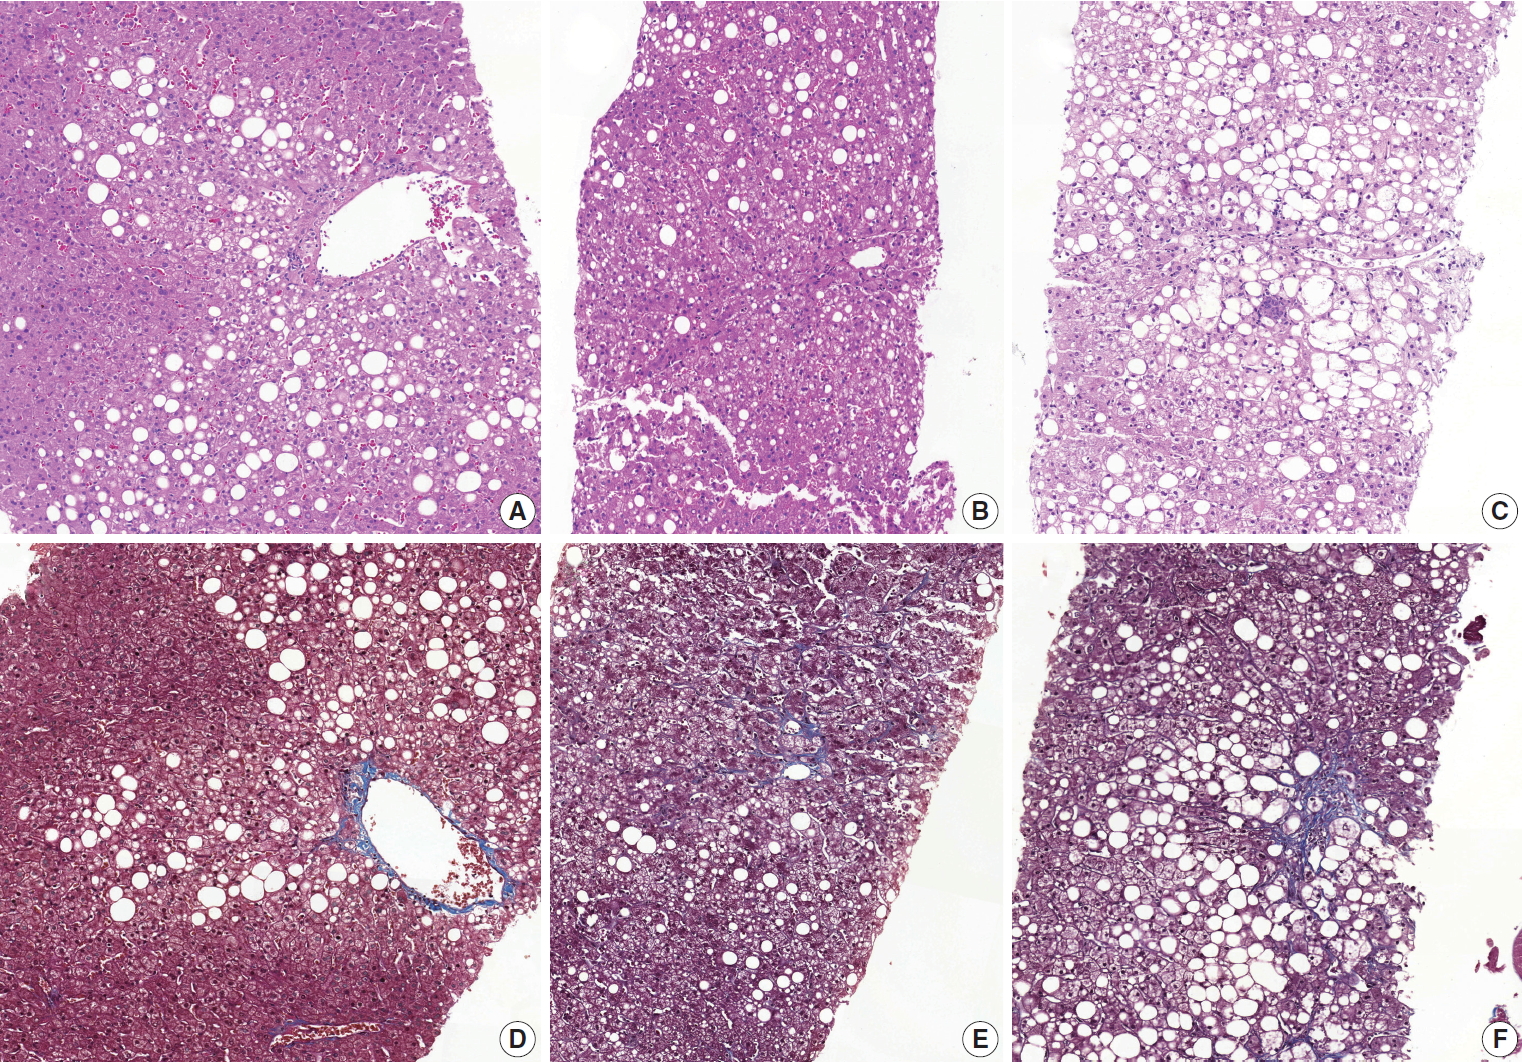
Diagnostic frequency of all 31 cases before (pre) consensus and after (post) consensus were plotted and shown in Fig. 1. The agreement rate of ‘NASH’ or ‘borderline’ in the pre-consensus diagnoses of all 31 cases was 53%–100%, and there was no case in which the major diagnosis was ‘not-NASH.’ After consensus, five cases were classified as ‘not-NASH’ (case Nos. 21, 2, 11, 12, and 10) by more than 50% of pathologists and 22 cases were classified as ‘borderline’ or ‘NASH’ by more than 50% of pathologists. The remaining four cases (case Nos. 3, 20, 37, and 28) had no dominant diagnosis. Consensus made classification clearer than before consensus. Kappa values for interobserver agreement for pre-consensus and post-consensus diagnoses are summarized in Table 1. Pre-consensus kappa values were fair grade, and below 0.4 in all categories. Post-consensus kappa values were still fair except in the ‘NASH’ group (0.41) and were increased in all categories compared to the pre-consensus kappa values. Post-consensus kappa values increased from 0.35 to 0.41 compared to the pre-consensus kappa values in the ‘NASH’ group (n = 22). Agreement rates of NASH after consensus were 60.72%, a slight increase relative to before consensus (overall agreement rate 56.93%). Increase of agreement rates was more pronounced in the ‘not-NASH’ category, from 33.59% to 49.49%. Histologic pictures of representative cases, ‘not-NASH’ (case 11), ‘borderline’ (case 17), and ‘NASH’ (case 30) after consensus are illustrated in Fig. 2.
Selection of histological parameters for decision modelling
Twelve histological features in 31 cases that were diagnosed by 13 pathologists are summarized in Table 2 by final diagnosis. Significantly different histological parameters among diagnoses (chi-square p < .05) were fibrosis, lobular inflammation, microgranuloma, portal inflammation, ballooning change, Mallory body, and glycogenated nuclei. Multivariate logistic regression analysis showed fibrosis (except 1C), ballooning change, and microgranuloma were significant discriminators among the three groups; lobular inflammation, portal inflammation, Mallory body, and glycogenated nuclei were significant discriminators between ‘NASH’ and ‘not-NASH’ or ‘borderline.’ Considering the incidence of parameters, rare parameters, such as portal inflammation and Mallory body, were excluded. Ballooning change and fibrosis (except 1C) were selected as major factors; lobular inflammation, microgranuloma, and glycogenated nuclei were selected as minor factors to construct a diagnostic model.
Decision models and accuracy
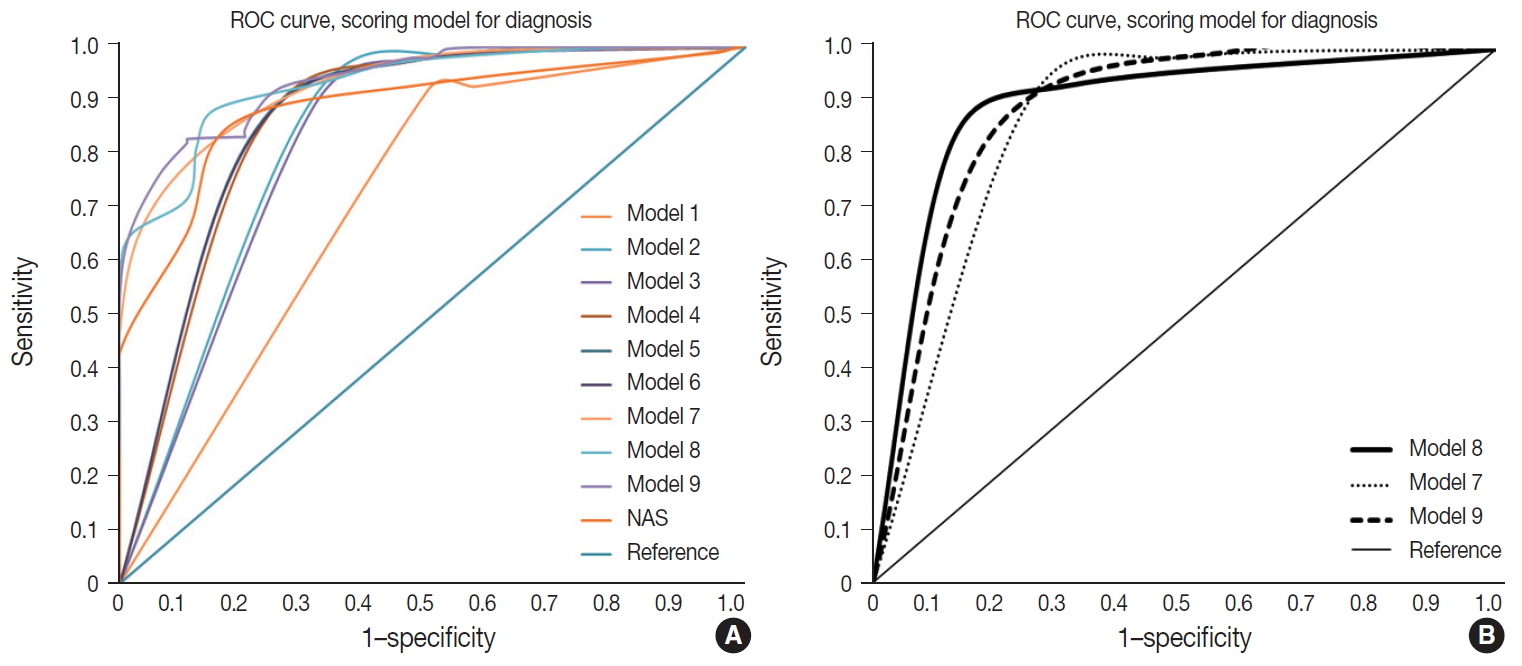
Nine models were constructed for quantitative diagnosis and are described in Table 3. Models 1–6 were non-weighted models that depended on the presence of major or minor factors to diagnose, and the severity of factors was not considered (Table 3). Models 7–9 were weighted models which considered the grade of major and minor factors (Table 3). Model 7 used only major factors. Model 8 weighted major factors twice and minor factors were stratified into two groups to reduce the ambiguity of equivocal findings. None to mild grade was scored as 0, and moderate to severe was scored as 1. Model 9 basically adds 9 points to the major factors, which corresponds to the total sum of the minor factors and was the only model that used the degree of steatosis in calculations (Table 3). Table 4 and Fig. 3 summarize the diagnostic accuracy referenced with the post-consensus diagnosis as the gold standard, agreement rates, and area under the curve (AUC) calculated by the ROC curve. Four cases with no consensus diagnosis were excluded. Concordance rates were higher in all scoring models than post-consensus diagnoses (κ = 0.52–0.69 vs. 0.33). Sensitivity, rate of borderline cases, Kappa rates, and overall agreement rates of quantitative models were superior to the NAFLD Activity Score (NAS) system (Table 4). Specificity and false negative rates were similar or higher than the NAS system. Based on the AUC, model 8 showed the best performance (AUC, 0.88) (Fig. 3). Model 9 had lower false-positive and false-negative rates than other models.
Recommendation of decision model
Weighted model 8 and model 9 were the finalists for recommendation. Overall accuracy was better for model 9 than model 8; however, model 9 had higher borderline rates than model 8, and model 8 had a higher AUC curve than model 9. The scoring numbers of model 9 were large, ranging from 0 to 88; therefore, model 8 would be more practical for clinical use. External validation is required to confirm the efficacy of the scoring system for diagnosis.
NAFLD is a disease spectrum ranging from simple steatosis to steatohepatitis. A major difference between simple steatosis and steatohepatitis is the presence of cellular injury induced by fat accumulation, which is apparent by the ballooning change of hepatocytes, inflammation, and fibrosis. Many scoring systems have been published by Ludwig since 1980, but the purpose of these systems is to assess the severity of steatohepatitis, not to diagnose [9]. The NAS system is a scoring system using steatosis, ballooning change, and lobular inflammation, but diagnosis should be made before scoring. The reference range for diagnosis is 0–2 for not diagnostic of NASH, 5–8 for diagnostic of NASH, but scores of 3–4 are evenly distributed in not diagnostic, borderline, or positive for NASH groups [2]. Low agreement rates of NASH in histological diagnosis are well known because the evaluation of each diagnostic feature is subjective and has low concordance rates [3,6]. Another limitation of the NAS system as diagnostic criteria is the severity of steatosis that can obscure other grades, such as ballooning change and inflammation.
In the present study, we attempted to construct a scoring system for diagnosis to reduce inter-observer variation based on the 13 pathologists’ subjective assessment of 31 liver biopsies. Concordance rates of subjective assessment were fair before and after consensus, but quantitative scoring increased concordance rates up to a moderate to substantial level in all models (κ = 0.33 vs. 0.52–0.69). Decreased inter-observer variation in a semiquantitative scoring system was reported by the Fatty Liver Inhibition of Progression (FLIP) Pathology Consortium in 2014 [3]. They proposed a NASH diagnostic algorithm and Steatosis, Activity, and Fibrosis score (SAF score) based on the presence of steatosis and grade of ballooning-change and lobular inflammation. Grade 1 or 2 ballooning change, and grade 1 or 2 lobular inflammation were the minimum diagnostic criteria used in the FLIP algorithm [3]. Concordance rates increased from 77% to 97% after using the FLIP algorithm and the kappa value also increased from moderate grade to substantial grade (κ = 0.54–0.66) [3].
The diagnostic components of our study were based on the key discriminators of post-consensus diagnosis that were selected by multivariate logistic regression analysis and the chi-square test. Ballooning change and lobular inflammation were the same histological factors of other grading systems discriminating NASH from NAFLD. The different component from other grading systems was fibrosis. Generally, many scoring systems for hepatitis and NAFLD use the concepts of grade and stage. Fibrosis is the key feature of liver injury progression and is separately assessed from necroinflammatory activity. Lobular inflammation, portal inflammation, and presence of confluent necrosis are examples of activity. High activity grade means the current status of hepatic injury and stage of fibrosis predict the progression of liver disease. The FLIP algorithm uses ballooning change and lobular inflammation as diagnostic factors but not fibrosis, which is used to assess the severity of NASH [10].
Our study showed that pathologists considered the presence of fibrosis as a major histological feature of NASH. Our study enrolled adult NAFLD cases without other causes of hepatitis, such as virus, alcohol, or autoimmune disease. The pathologists were aware of these conditions beforehand and only assessed the diagnosis of NAFLD according to three categories. As fibrosis with steatosis was presenting as irreversible hepatic injury by steatosis, pathologists easily diagnosed NASH in this situation. Interestingly, grade 1C fibrosis, which is portal fibrosis and is usually observed in pediatric patients, did not affect the diagnosis of ‘not-NASH,’ ‘borderline,’ or ‘NASH.’ As the fibrosis grade increased, the tendency to diagnose NASH increased. The three-tiered scoring system for fibrosis (0, 1A, 1B-4 except 1C) was applied considering practicality, reproducibility of grade 1A, and the smothering effect of a high fibrosis score over other diagnostic factors. Our previous report on the reproducibility of pathologic features of NAFLD mentioned ambiguity between the normal framework of the perivenular area and obvious pericellular collagen deposition [6]. Ballooning change is a mandatory feature of NASH, but inter-observer agreement was not so high (κ-value after consensus = 0.34); therefore, we adopted three levels for fibrosis grade and ballooning change [6] to prevent ambiguous scores affecting NASH diagnosis.
A common feature of our proposed model and the FLIP algorithm is that the amount of fat deposition was dismissed for diagnosis and fat deposition is considered as a minimum requirement of NASH. Grade of steatosis is a major factor in the NAS system [11]. Different features between our proposed model and the FLIP algorithm are (1) presence of the borderline category in the diagnostic group (steatosis vs. NASH in FLIP; ‘not-NASH,’ ‘borderline,’ and ‘NASH’ in our model), (2) cutoff level of ballooning and lobular inflammation for definite NASH, and (3) adaption of fibrosis as a diagnostic component. In the FLIP criteria, grade 1 ballooning and grade 1 lobular inflammation is the minimum requirement for NASH, but this category might be included as borderline by our model because the cut off value for lobular inflammation in our model was higher than that of the FLIP algorithm/SAF score (2–4 foci/200 × field vs. <2 foci per lobule) [3]. Borderline cases defined by our model might be defined as NASH by the FLIP algorithm. A relatively low NASH criteria by FLIP was reported in a comparative validation study of the NAS and SAF score [12]. Rastogi et al. [12] reported concordance of not-NASH and NASH by the NAS system and SAF algorithm, but 79.4%–94.4% of borderline-NASH diagnosed by NAS were diagnosed as NASH by the SAF algorithm.
Fibrosis is a major predictor for the progression of NAFLD; however, the NAS and FLIP algorithm/SAF score exclude fibrosis in the decision scheme. Exclusion of fibrosis in the score risks missing the fibrotic inactive NAFLD cases. Rastogi and colleagues reported that 76.39% diagnosed by NASH and 78.63% diagnosed by the FLIP algorithm/SAF score, who were not-NASH, showed the presence of fibrosis [12]. Only the fibrosis stage, but no other histological feature, was found to be independently associated with long-term overall mortality, liver transplantation, and liver-related events in a retrospective study of 619 NAFLD patients [13]. Inclusion of fibrosis as a diagnostic criterion may risk narrowing the range of definite NASH; however, considering the low progression rates of simple steatosis without fibrosis and low inter-observer reproducibility of perivenular fibrosis and ballooning change, a borderline category with equivocal features can be a buffering group between not-NASH and definite NASH.
The limitations of our study are that the performance of the model was not verified in external datasets and clinicopathologic analysis was not performed due to the small size of the cohort. Further study including external validation of the model and risk prediction for disease progression of each diagnostic group could provide valuable information.
In summary, a semi-quantitative scoring system increased the diagnostic reproducibility of NASH, and subjective assessment and summation of two major factors (× 2; ballooning and fibrosis, range 0–2) and minor factors (lobular inflammation, glycogenated nuclei, and microgranuloma, range 0–1) are proposed as a practical NASH diagnostic criteria (diagnostic range: 0–3, ‘not-NASH’; 4–5, ‘borderline’; 6–11, ‘NASH’).
We are grateful to all members of the Gastrointestinal Pathology Study Group of the Korean Society of Pathologists, particularly Eunsil Yu for scanning the virtual slides.
Fig. 1.
Distribution of 13 pathologist diagnoses before and after consensus. ‘NASH_pre’, ‘Borderline_pre’ and ‘Not NASH_pre’ are diagnoses before consensus (bar graph), and ‘NASH_post’ and ‘Borderline & NASH_post’ are diagnoses after consensus (line graph). The level of ‘borderline NASH’ decreased in the not-NASH group and increased in the NASH group after consensus. NASH, non-alcoholic steatohepatitis.
jptm-2020-03-07f1.jpg
Fig. 2.
Representative pictures of ‘not-NASH,’ ‘borderline,’ and ‘NASH’ cases after consensus. (A, D) ‘Not-NASH’ (case 11) shows steatosis with minimal lobular inflammation, no ballooning and stage 1a fibrosis in Masson-trichrome (MT) staining (B, E). ‘Borderline’ (case 17) shows steatosis with mild lobular inflammation, rare ballooned cells and stage 1b fibrosis in MT staining. (C, F) ‘NASH’ (case 20) shows steatosis with moderate lobular inflammation, some ballooned cells and stage 1b fibrosis in MT staining (D-F, MT staining). NASH, non-alcoholic steatohepatitis.
jptm-2020-03-07f2.jpg
Fig. 3.
Receiver operating characteristic (ROC) curve of models. (A) ROC of 10 models. (B) ROC of three weighted models (models 7, 8, and 9).
jptm-2020-03-07f3.jpg
Table 1.
Inter-observer agreement of diagnosis before and after consensus
Free-marginal kappa (95% CI) Overall agreement rates (%)
Pre-consensus
 Total (n = 31) 0.25 (0.14 to 0.36) 50.08
 NASH (n = 22) 0.35 (0.23 to 0.48) 56.93
 Not-NASH (n = 5) 0.00 (–0.04 to 0.05) 33.59
Post-consensus
 Total (n = 31) 0.33 (0.22 to 0.44) 55.38
 NASH (n = 22) 0.41 (0.27 to 0.55) 60.72
 Not-NASH (n = 5) 0.24 (0.16 to 0.33) 49.49

CI, confidence interval; NASH, non-alcoholic steatohepatitis.

Table 2.
Histological parameters among disease groups
Histological parameter Frequency of tests
p-value of chi-square test
p-value of logistic regression analysis
NASH (n = 228) Borderline (n = 78) Not-NASH (n = 97) p-value NASH vs. not-NASH NASH vs. borderline Borderline vs. not-NASH NASH vs. not-NASH NASH vs. borderline Borderline vs. not-NASH
Steatosis grade
3: > 66% 49 14 24 .094 .038 .272 .487 .374 .444 .059
2: 34%–66% 96 26 25
1: 5–33% 72 34 40
0: < 5% 11 4 8
Steatosis location
1: Zone 1 0 0 0 .096 .027 .078 .287 .155 NA NA
2: Zone 3 44 17 32
3: Azonal 111 39 41
4: Panacinar 73 20 24
Microvesicular fatty change
Absent 134 52 63 .354 .297 .218 .812 .024 .353 .755
Present 94 26 34
Fibrosis
None 2 13 51 < .001 < .001 < .001 < .001 < .001 < .001 < .001
1A: Mild, zone 3, perisinusoidal 67 36 25
1B: Moderate, zone 3, perisinusoidal 54 6 1
1C: Portal/periportal 2 3 5
2: Perisinusoidal and portal/periportal 64 16 4
3: Bridging fibrosis 39 4 11
4: Cirrhosis
Lobular inflammation
0: 0/200 × 0 2 5 < .001 < .001 < .001 .640 < .001 < .001 .493
1: 1/200 × 53 53 68
2: 2-4/200 × 95 14 12
3: 5/200 × 80 9 12
Microgranuloma
0: Absent 75 30 54 .001 < .001 .002 .302 < .001 .007 .005
1: Present 153 48 43
Lipogranuloma
0: Absent 195 67 78 .467 .025 .936 .339 .133 .943 .407
1: Present 33 11 19
Portal inflammation
0: None to minimal 143 64 85 < .001 < .001 .002 .302 < .001 .007 .336
1: Greater than minimal 85 14 12
Ballooning change
0: None 14 17 66 < .001 < .001 < .001 < .001 < .001 < .001 <.001
1: Few 17 31 30
2: Many 157 58 13
Acidophilic body
0: None to rare 199 69 91 .220 .082 .785 .209 .410 .723 .380
1: Many 29 9 6
Mallory body
0: None to rare 159 74 89 < .001 < .001 < .001 .417 .007 < .001 .271
1: Many 69 4 8
Glycogenated nuclei
0: None to rare 100 45 68 < .001 < .001 .035 .088 < .001 .033 .130
1: Many 128 33 29

NASH, non-alcoholic steatohepatitis; NA, not applicable.

Table 3.
Final histologic criteria for modeling
Criteria Parameter Score Model No. NASH Borderline Not-NASH
Non-weighted method
Essential requirement Steatosis > 5%, any location Mo. 1 Major ≥ 1, any minor No major & minor ≥ 2 No major & minor ≤ 1
Major factors (1) Any fibrosis except 1C Mo. 2 Major ≥ 2, any minor Major 1 & minor ≤ 1 No major & minor ≤ 1
(2) Any ballooning change Major ≥ 1 & minor ≥ 2
Minor factors (1) Lobular inflammation ≥ 2/200 × Mo. 3 Major ≥ 2, any minor Major 1 & minor ≤ 1 No major & minor ≤ 1
(2) Many microgranuloma Major ≥ 1 & minor ≥ 2 No major & minor ≥ 2
(3) Many glycogenated nuclei Mo. 4 Major ≥ 2, any minor Major 1 & minor ≤ 2 No major & minor ≤ 2
Major ≥ 1 & minor 3 No major & minor 3
Mo. 5 Major 2, any minor Major 1, any minor No major & minor ≤ 2
No major & minor 3
Mo. 6 Major 2, any minor Major 1, any minor No major, any minor
Weighted method 1
Essential requirement Steatosis > 5%, any location - - - -
Major factors (1) Fibrosis except 1C stage 0: None Mo. 7 = Sum of major score [0–4]
1: 1A 2 1 0
2: 1B, 2, 3, 4 Mo. 8 = 2 × Sum of major score + minor [0–11]
(2) Ballooning change 0: None 6-11 4-5 0-3
1: Few - - - -
2: Many - - - -
Minor factors (1) Lobular inflammation 0: 0–1/200 × - - - -
1: 2 ≥/200 × - - - -
(2) Microgranuloma 0: None to rare - - - -
1: Many - - - -
(3) Glycogenated nuclei 0: None to rare - - - -
1: Many - - - -
Weighted method 2
Essential requirement Steatosis > 5%, any location 1: 5%–33% Mo. 9 = Sum of all scores [0–88]
2: 34%–66% 20–88 19–4 0–3
3: > 67% NAS = Steatosis + lobular inflammation+ballooning change [0–8]
Major factors (1) Fibrosis stage 0: None 5–8 3–4 0–2
9: Stage 1A - - - -
10: Stage 1B & 1C - - - -
11: Stage 3 - - - -
12: Stage 4 - - - -
(2) Ballooning change 0: None - - - -
9 [1]a: Few - - - -
10 [2]a: Many - - - -
Minor factors (1) Lobular inflammation 0: 0/200 × - - - -
1: < 2/200 × - - - -
2: 2–4 foci/200 × - - - -
3: > 4 foci/200 × - - - -
(2) Microgranuloma 0: None to rare - - - -
1: Many - - - -
(3) Glycogenated nuclei 0: None to rare - - - -
1: Many - - - -

NASH, non-alcoholic steatohepatitis.

aScore for NAFLD Activity Score (NAS).

Table 4.
Diagnostic accuracy of diagnostic models
Sensitivity Specificity Borderline rate False-positive rate False-negative rate Free-marginal kappa rate (95% CI) Overall agreement rate AUC (ROC)
Model 1 0.92 0.43 0.02 0.11 0.43 0.69 (0.55–0.82) 79.24 0.71
Model 2 0.90 0.43 0.12 0.07 0.31 0.62 (0.46–0.77) 74.48 0.81
Model 3 0.92 0.51 0.11 0.07 0.51 0.59 (0.45–0.74) 72.95 0.81
Model 4 0.93 0.51 0.17 0.06 0.51 0.54 (0.38–0.69) 69.23 0.84
Model 5 0.91 0.51 0.19 0.05 0.51 0.52 (0.37–0.67) 68.20 0.85
Model 6 0.90 0.51 0.01 0.04 0.44 0.52 (0.37–0.66) 67.70 0.85
Model 7 1.00 0.09 0.12 0.06 0.47 0.61 (0.45–0.77) 74.19 0.85
Model 8 0.90 0.68 0.13 0.03 0.57 0.56 (0.40–0.71) 70.55 0.88
Model 9 0.92 0.40 0.21 0.05 0.00 0.60 (0.46–0.74) 73.33 0.86
NAS 0.75 0.49 0.30 0.04 0.41 0.40 (0.28–0.51) 59.84 0.83

CI, confidence interval; AUC (ROC), area under receiver operating characteristic curve; NAS, NAFLD Activity Score.

  • 1. Brunt EM, Janney CG, Di Bisceglie AM, Neuschwander-Tetri BA, Bacon BR. Nonalcoholic steatohepatitis: a proposal for grading and staging the histological lesions. Am J Gastroenterol 1999; 94: 2467-74. ArticlePubMed
  • 2. Kleiner DE, Brunt EM, Van Natta M, et al. Design and validation of a histological scoring system for non-alcoholic fatty liver disease. Hepatology 2005; 41: 1313-21. ArticlePubMed
  • 3. Bedossa P, Consortium FP. Utility and appropriateness of the fatty liver inhibition of progression (FLIP) algorithm and steatosis, activity, and fibrosis (SAF) score in the evaluation of biopsies of nonalcoholic fatty liver disease. Hepatology 2014; 60: 565-75. ArticlePubMed
  • 4. Bedossa P, Poitou C, Veyrie N, et al. Histopathological algorithm and scoring system for evaluation of liver lesions in morbidly obese patients. Hepatology 2012; 56: 1751-9. ArticlePubMed
  • 5. Alkhouri N, De Vito R, Alisi A, et al. Development and validation of a new histological score for pediatric non-alcoholic fatty liver disease. J Hepatol 2012; 57: 1312-8. ArticlePubMed
  • 6. Jung ES, Lee K, Yu E, et al. Interobserver agreement on pathologic features of liver biopsy tissue in patients with nonalcoholic fatty liver disease. J Pathol Transl Med 2016; 50: 190-6. ArticlePubMedPMCPDF
  • 7. Randolph JJ. Free-marginal multirater kappa (multirater κfree): an alternative to Fleiss fixed-marginal multirater kappa. Joensuu Learning and Learning Symposium; 2005 Oct 14-15; Joensuu, Finland. Article
  • 8. Randolph JJ. Online kappa calculator [Internet] Justus Randolph, 2008 [cited 2019 Dec 10]. Available from: http://justus.randolph.name/kappa. Article
  • 9. Ludwig J, Viggiano TR, McGill DB, Oh BJ. Nonalcoholic steatohepatitis: Mayo Clinic experiences with a hitherto unnamed disease. Mayo Clin Proc 1980; 55: 434-8. ArticlePubMed
  • 10. Pournik O, Alavian SM, Ghalichi L, et al. Inter-observer and intraobserver agreement in pathological evaluation of non-alcoholic fatty liver disease suspected liver biopsies. Hepat Mon 2014; 14: e15167. ArticlePubMedPMC
  • 11. Hjelkrem M, Stauch C, Shaw J, Harrison SA. Validation of the nonalcoholic fatty liver disease activity score. Aliment Pharmacol Ther 2011; 34: 214-8. ArticlePubMed
  • 12. Rastogi A, Shasthry SM, Agarwal A, et al. Non-alcoholic fatty liver disease: histological scoring systems: a large cohort single-center, evaluation study. APMIS 2017; 125: 962-73. ArticlePubMed
  • 13. Angulo P, Kleiner DE, Dam-Larsen S, et al. Liver fibrosis, but no other histologic features, is associated with long-term outcomes of patients with nonalcoholic fatty liver disease. Gastroenterology 2015; 149: 389-97. ArticlePubMedPMC

Figure & Data

References

    Citations

    Citations to this article as recorded by  
    • Presurgery health influences outcomes following vertical sleeve gastrectomy in adolescents
      Debi Swertfeger, Ahlee Kim, Hannah Sexmith, Maria E. Moreno‐Fernandez, W. Sean Davidson, Michael Helmrath, Todd Jenkins, Tsuyoshi Okura, Esmond Geh, Stavra A. Xanthakos, Sara Szabo, Takahisa Nakamura, Senad Divanovic, Amy Sanghavi Shah
      Obesity.2024; 32(6): 1187.     CrossRef
    • Immunobiotic Bacteria Attenuate Hepatic Fibrosis through the Modulation of Gut Microbiota and the Activation of Aryl‐Hydrocarbon Receptors Pathway in Non‐Alcoholic Steatohepatitis Mice
      Paulraj Kanmani, Julio Villena, Soo‐kyoung Lim, Eun‐Ji Song, Young‐Do Nam, Hojun Kim
      Molecular Nutrition & Food Research.2024;[Epub]     CrossRef
    • Lipid nanoparticle-mediated hepatocyte delivery of siRNA and silibinin in metabolic dysfunction-associated steatotic liver disease
      Yifu Lyu, Xiuyi Yang, Lei Yang, Jinyu Dai, Huanyu Qin, Yunuo Zhou, Yunan Huang, Yanmei Wang, Di Wu, Qindai Shuai, Qilong Li, Xiaofei Xin, Lifang Yin
      Journal of Controlled Release.2024; 373: 385.     CrossRef
    • Enhanced hepatoprotective effects of empagliflozin and vitamin D dual therapy against metabolic dysfunction‐associated steatohepatitis in mice by boosted modulation of metabolic, oxidative stress, and inflammatory pathways
      Wesam F. Farrash, Shakir Idris, Mohamed E. Elzubier, Elshiekh B. A. Khidir, Akhmed Aslam, Abdulrahman Mujalli, Riyad A. Almaimani, Ahmad A. Obaid, Mahmoud Z. El‐Readi, Mohammad A. Alobaidy, Afnan Salaka, Afnan M. Shakoori, Alaa M. Saleh, Faisal Minshawi,
      International Journal of Experimental Pathology.2024; 105(6): 219.     CrossRef
    • Changes in indications for outpatient percutaneous liver biopsy over 5 years: from hepatitis C to fatty liver disease
      Marlone Cunha-Silva, Luíza D. Torres, Mariana F. Fernandes, Tirzah de M. Lopes Secundo, Marina C.G. Moreira, Ademar Yamanaka, Leonardo T. Monici, Larissa B. Eloy da Costa, Daniel F. Mazo, Tiago Sevá-Pereira
      Gastroenterología y Hepatología.2022; 45(8): 579.     CrossRef
    • Changes in indications for outpatient percutaneous liver biopsy over 5 years: from hepatitis C to fatty liver disease
      Marlone Cunha-Silva, Luíza D. Torres, Mariana F. Fernandes, Tirzah de M. Lopes Secundo, Marina C.G. Moreira, Ademar Yamanaka, Leonardo T. Monici, Larissa B. Eloy da Costa, Daniel F. Mazo, Tiago Sevá-Pereira
      Gastroenterología y Hepatología (English Edition).2022; 45(8): 579.     CrossRef

    • PubReader PubReader
    • ePub LinkePub Link
    • Cite this Article
      Cite this Article
      export Copy Download
      Close
      Download Citation
      Download a citation file in RIS format that can be imported by all major citation management software, including EndNote, ProCite, RefWorks, and Reference Manager.

      Format:
      • RIS — For EndNote, ProCite, RefWorks, and most other reference management software
      • BibTeX — For JabRef, BibDesk, and other BibTeX-specific software
      Include:
      • Citation for the content below
      A scoring system for the diagnosis of non-alcoholic steatohepatitis from liver biopsy
      J Pathol Transl Med. 2020;54(3):228-236.   Published online April 15, 2020
      Close
    • XML DownloadXML Download
    Figure
    • 0
    • 1
    • 2
    A scoring system for the diagnosis of non-alcoholic steatohepatitis from liver biopsy
    Image Image Image
    Fig. 1. Distribution of 13 pathologist diagnoses before and after consensus. ‘NASH_pre’, ‘Borderline_pre’ and ‘Not NASH_pre’ are diagnoses before consensus (bar graph), and ‘NASH_post’ and ‘Borderline & NASH_post’ are diagnoses after consensus (line graph). The level of ‘borderline NASH’ decreased in the not-NASH group and increased in the NASH group after consensus. NASH, non-alcoholic steatohepatitis.
    Fig. 2. Representative pictures of ‘not-NASH,’ ‘borderline,’ and ‘NASH’ cases after consensus. (A, D) ‘Not-NASH’ (case 11) shows steatosis with minimal lobular inflammation, no ballooning and stage 1a fibrosis in Masson-trichrome (MT) staining (B, E). ‘Borderline’ (case 17) shows steatosis with mild lobular inflammation, rare ballooned cells and stage 1b fibrosis in MT staining. (C, F) ‘NASH’ (case 20) shows steatosis with moderate lobular inflammation, some ballooned cells and stage 1b fibrosis in MT staining (D-F, MT staining). NASH, non-alcoholic steatohepatitis.
    Fig. 3. Receiver operating characteristic (ROC) curve of models. (A) ROC of 10 models. (B) ROC of three weighted models (models 7, 8, and 9).
    A scoring system for the diagnosis of non-alcoholic steatohepatitis from liver biopsy
    Free-marginal kappa (95% CI) Overall agreement rates (%)
    Pre-consensus
     Total (n = 31) 0.25 (0.14 to 0.36) 50.08
     NASH (n = 22) 0.35 (0.23 to 0.48) 56.93
     Not-NASH (n = 5) 0.00 (–0.04 to 0.05) 33.59
    Post-consensus
     Total (n = 31) 0.33 (0.22 to 0.44) 55.38
     NASH (n = 22) 0.41 (0.27 to 0.55) 60.72
     Not-NASH (n = 5) 0.24 (0.16 to 0.33) 49.49
    Histological parameter Frequency of tests
    p-value of chi-square test
    p-value of logistic regression analysis
    NASH (n = 228) Borderline (n = 78) Not-NASH (n = 97) p-value NASH vs. not-NASH NASH vs. borderline Borderline vs. not-NASH NASH vs. not-NASH NASH vs. borderline Borderline vs. not-NASH
    Steatosis grade
    3: > 66% 49 14 24 .094 .038 .272 .487 .374 .444 .059
    2: 34%–66% 96 26 25
    1: 5–33% 72 34 40
    0: < 5% 11 4 8
    Steatosis location
    1: Zone 1 0 0 0 .096 .027 .078 .287 .155 NA NA
    2: Zone 3 44 17 32
    3: Azonal 111 39 41
    4: Panacinar 73 20 24
    Microvesicular fatty change
    Absent 134 52 63 .354 .297 .218 .812 .024 .353 .755
    Present 94 26 34
    Fibrosis
    None 2 13 51 < .001 < .001 < .001 < .001 < .001 < .001 < .001
    1A: Mild, zone 3, perisinusoidal 67 36 25
    1B: Moderate, zone 3, perisinusoidal 54 6 1
    1C: Portal/periportal 2 3 5
    2: Perisinusoidal and portal/periportal 64 16 4
    3: Bridging fibrosis 39 4 11
    4: Cirrhosis
    Lobular inflammation
    0: 0/200 × 0 2 5 < .001 < .001 < .001 .640 < .001 < .001 .493
    1: 1/200 × 53 53 68
    2: 2-4/200 × 95 14 12
    3: 5/200 × 80 9 12
    Microgranuloma
    0: Absent 75 30 54 .001 < .001 .002 .302 < .001 .007 .005
    1: Present 153 48 43
    Lipogranuloma
    0: Absent 195 67 78 .467 .025 .936 .339 .133 .943 .407
    1: Present 33 11 19
    Portal inflammation
    0: None to minimal 143 64 85 < .001 < .001 .002 .302 < .001 .007 .336
    1: Greater than minimal 85 14 12
    Ballooning change
    0: None 14 17 66 < .001 < .001 < .001 < .001 < .001 < .001 <.001
    1: Few 17 31 30
    2: Many 157 58 13
    Acidophilic body
    0: None to rare 199 69 91 .220 .082 .785 .209 .410 .723 .380
    1: Many 29 9 6
    Mallory body
    0: None to rare 159 74 89 < .001 < .001 < .001 .417 .007 < .001 .271
    1: Many 69 4 8
    Glycogenated nuclei
    0: None to rare 100 45 68 < .001 < .001 .035 .088 < .001 .033 .130
    1: Many 128 33 29
    Criteria Parameter Score Model No. NASH Borderline Not-NASH
    Non-weighted method
    Essential requirement Steatosis > 5%, any location Mo. 1 Major ≥ 1, any minor No major & minor ≥ 2 No major & minor ≤ 1
    Major factors (1) Any fibrosis except 1C Mo. 2 Major ≥ 2, any minor Major 1 & minor ≤ 1 No major & minor ≤ 1
    (2) Any ballooning change Major ≥ 1 & minor ≥ 2
    Minor factors (1) Lobular inflammation ≥ 2/200 × Mo. 3 Major ≥ 2, any minor Major 1 & minor ≤ 1 No major & minor ≤ 1
    (2) Many microgranuloma Major ≥ 1 & minor ≥ 2 No major & minor ≥ 2
    (3) Many glycogenated nuclei Mo. 4 Major ≥ 2, any minor Major 1 & minor ≤ 2 No major & minor ≤ 2
    Major ≥ 1 & minor 3 No major & minor 3
    Mo. 5 Major 2, any minor Major 1, any minor No major & minor ≤ 2
    No major & minor 3
    Mo. 6 Major 2, any minor Major 1, any minor No major, any minor
    Weighted method 1
    Essential requirement Steatosis > 5%, any location - - - -
    Major factors (1) Fibrosis except 1C stage 0: None Mo. 7 = Sum of major score [0–4]
    1: 1A 2 1 0
    2: 1B, 2, 3, 4 Mo. 8 = 2 × Sum of major score + minor [0–11]
    (2) Ballooning change 0: None 6-11 4-5 0-3
    1: Few - - - -
    2: Many - - - -
    Minor factors (1) Lobular inflammation 0: 0–1/200 × - - - -
    1: 2 ≥/200 × - - - -
    (2) Microgranuloma 0: None to rare - - - -
    1: Many - - - -
    (3) Glycogenated nuclei 0: None to rare - - - -
    1: Many - - - -
    Weighted method 2
    Essential requirement Steatosis > 5%, any location 1: 5%–33% Mo. 9 = Sum of all scores [0–88]
    2: 34%–66% 20–88 19–4 0–3
    3: > 67% NAS = Steatosis + lobular inflammation+ballooning change [0–8]
    Major factors (1) Fibrosis stage 0: None 5–8 3–4 0–2
    9: Stage 1A - - - -
    10: Stage 1B & 1C - - - -
    11: Stage 3 - - - -
    12: Stage 4 - - - -
    (2) Ballooning change 0: None - - - -
    9 [1]a: Few - - - -
    10 [2]a: Many - - - -
    Minor factors (1) Lobular inflammation 0: 0/200 × - - - -
    1: < 2/200 × - - - -
    2: 2–4 foci/200 × - - - -
    3: > 4 foci/200 × - - - -
    (2) Microgranuloma 0: None to rare - - - -
    1: Many - - - -
    (3) Glycogenated nuclei 0: None to rare - - - -
    1: Many - - - -
    Sensitivity Specificity Borderline rate False-positive rate False-negative rate Free-marginal kappa rate (95% CI) Overall agreement rate AUC (ROC)
    Model 1 0.92 0.43 0.02 0.11 0.43 0.69 (0.55–0.82) 79.24 0.71
    Model 2 0.90 0.43 0.12 0.07 0.31 0.62 (0.46–0.77) 74.48 0.81
    Model 3 0.92 0.51 0.11 0.07 0.51 0.59 (0.45–0.74) 72.95 0.81
    Model 4 0.93 0.51 0.17 0.06 0.51 0.54 (0.38–0.69) 69.23 0.84
    Model 5 0.91 0.51 0.19 0.05 0.51 0.52 (0.37–0.67) 68.20 0.85
    Model 6 0.90 0.51 0.01 0.04 0.44 0.52 (0.37–0.66) 67.70 0.85
    Model 7 1.00 0.09 0.12 0.06 0.47 0.61 (0.45–0.77) 74.19 0.85
    Model 8 0.90 0.68 0.13 0.03 0.57 0.56 (0.40–0.71) 70.55 0.88
    Model 9 0.92 0.40 0.21 0.05 0.00 0.60 (0.46–0.74) 73.33 0.86
    NAS 0.75 0.49 0.30 0.04 0.41 0.40 (0.28–0.51) 59.84 0.83
    Table 1. Inter-observer agreement of diagnosis before and after consensus

    CI, confidence interval; NASH, non-alcoholic steatohepatitis.

    Table 2. Histological parameters among disease groups

    NASH, non-alcoholic steatohepatitis; NA, not applicable.

    Table 3. Final histologic criteria for modeling

    NASH, non-alcoholic steatohepatitis.

    Score for NAFLD Activity Score (NAS).

    Table 4. Diagnostic accuracy of diagnostic models

    CI, confidence interval; AUC (ROC), area under receiver operating characteristic curve; NAS, NAFLD Activity Score.


    J Pathol Transl Med : Journal of Pathology and Translational Medicine
    TOP