Articles
- Page Path
- HOME > J Pathol Transl Med > Volume 47(4); 2013 > Article
-
Original Article
The Expression of CD10 and CD15 Is Progressively Increased during Colorectal Cancer Development - Tae Jung Jang, Jeong Bae Park1, Jong Im Lee
-
Korean Journal of Pathology 2013;47(4):340-347.
DOI: https://doi.org/10.4132/KoreanJPathol.2013.47.4.340
Published online: August 26, 2013
Department of Pathology, Dongguk University College of Medicine, Gyeongju, Korea.
1Department of Internal Medicine, Dongguk University College of Medicine, Gyeongju, Korea.
- Corresponding Author: Tae Jung Jang, M.D. Department of Pathology, Dongguk University College of Medicine, 123 Dongdae-ro, Gyeongju 780-714, Korea. Tel: +82-54-770-2410, Fax: +82-54-770-2431, taejung@mail.dongguk.ac.kr
• Received: May 7, 2013 • Revised: July 10, 2013 • Accepted: July 12, 2013
© 2013 The Korean Society of Pathologists/The Korean Society for Cytopathology
This is an Open Access article distributed under the terms of the Creative Commons Attribution Non-Commercial License (http://creativecommons.org/licenses/by-nc/3.0/) which permits unrestricted non-commercial use, distribution, and reproduction in any medium, provided the original work is properly cited.
Figure & Data
References
Citations
Citations to this article as recorded by 

- From Ulcerative Colitis to Metastatic Colorectal Cancer
Iliana I. León-Vega, Reyna Oregon, Michael Schnoor, Eduardo Vadillo
The American Journal of Pathology.2025; 195(5): 814. CrossRef - CD10 Expression Correlates with Earlier Tumour Stages and Left-Sided Tumour Location in Colorectal Cancer but Has No Prognostic Impact in a European Cohort
Julia-Kristin Grass, Katharina Grupp, Martina Kluth, Claudia Hube-Magg, Ronald Simon, Marius Kemper, Jakob R. Izbicki, Guido Sauter, Nathaniel Melling
Cancers.2024; 16(8): 1473. CrossRef - Exploring cell-derived extracellular vesicles in peripheral blood and bone marrow of B-cell acute lymphoblastic leukemia pediatric patients: proof-of-concept study
Fábio Magalhães-Gama, Marina Malheiros Araújo Silvestrini, Juliana Costa Ferreira Neves, Nilberto Dias Araújo, Fabíola Silva Alves-Hanna, Marlon Wendell Athaydes Kerr, Maria Perpétuo Socorro Sampaio Carvalho, Andréa Monteiro Tarragô, Gemilson Soares Ponte
Frontiers in Immunology.2024;[Epub] CrossRef - Pathophysiological roles and applications of glycosphingolipids in the diagnosis and treatment of cancer diseases
Xuefeng Jin, Guang-Yu Yang
Progress in Lipid Research.2023; 91: 101241. CrossRef - Expression of CD10 and CD15 in colorectal mucinous and signet ring adenocarcinomas and its relation to clinicopathological features and prognosis
Abd AlRahman Mohammad Foda, Haitham Abdulkarem Alamer, Nadeem Ikram, Hadi Abdulhadi Helali, Fayza Sami Fayad, Sara Waleed Hussian, Khaled Abdelwahab, Tamer Akl, Ziad Emarah, Ahmed M. Ramez
Cancer Biomarkers.2022; 33(1): 143. CrossRef -
A Defucosylated Mouse Anti-CD10 Monoclonal Antibody (31-mG
2a
-f) Exerts Antitumor Activity in a Mouse Xenograft Model of Renal Cell Cancers
Hiroki Kawabata, Tomokazu Ohishi, Hiroyuki Suzuki, Teizo Asano, Manabu Kawada, Hiroyoshi Suzuki, Mika K. Kaneko, Yukinari Kato
Monoclonal Antibodies in Immunodiagnosis & Immunotherapy.2022; 41(6): 320. CrossRef - Single-cell proteomics defines the cellular heterogeneity of localized prostate cancer
Laura De Vargas Roditi, Andrea Jacobs, Jan H. Rueschoff, Pete Bankhead, Stéphane Chevrier, Hartland W. Jackson, Thomas Hermanns, Christian D. Fankhauser, Cedric Poyet, Felix Chun, Niels J. Rupp, Alexandra Tschaebunin, Bernd Bodenmiller, Peter J. Wild
Cell Reports Medicine.2022; 3(4): 100604. CrossRef - Targeting CD10 on B-Cell Leukemia Using the Universal CAR T-Cell Platform (UniCAR)
Nicola Mitwasi, Claudia Arndt, Liliana R. Loureiro, Alexandra Kegler, Frederick Fasslrinner, Nicole Berndt, Ralf Bergmann, Vaclav Hořejší, Claudia Rössig, Michael Bachmann, Anja Feldmann
International Journal of Molecular Sciences.2022; 23(9): 4920. CrossRef - Prognostic and Therapeutic Role of CD15 and CD15s in Cancer
Wojciech Szlasa, Karol Wilk, Klaudia Knecht-Gurwin, Adam Gurwin, Anita Froń, Natalia Sauer, Wojciech Krajewski, Jolanta Saczko, Tomasz Szydełko, Julita Kulbacka, Bartosz Małkiewicz
Cancers.2022; 14(9): 2203. CrossRef - Expression Profile of CD10, BCL-2, p63, and EMA in the Normal Skin and Basal Cell Carcinomas: An Immunohistochemical Reappraisal
M.R. Hussein, A.M. Ahmed
Actas Dermo-Sifiliográficas.2022; 113(9): 848. CrossRef - Targeting Aberrantly Elevated Sialyl Lewis A as a Potential Therapy for Impaired Endometrial Selection Ability in Unexplained Recurrent Miscarriage
Zhi Ma, Huixia Yang, Mirjana Kessler, Markus Sperandio, Sven Mahner, Udo Jeschke, Viktoria von Schönfeldt
Frontiers in Immunology.2022;[Epub] CrossRef - [Artículo traducido] Perfil de expresión de CD10, BCL-2, p63 y EMA en los carcinomas normales de piel y de células basales: Revaloración inmunohistoquímica
M.R. Hussein, A.M. Ahmed
Actas Dermo-Sifiliográficas.2022; 113(9): T848. CrossRef - Multiomics surface receptor profiling of the NCI-60 tumor cell panel uncovers novel theranostics for cancer immunotherapy
Simon Heumos, Sandra Dehn, Konstantin Bräutigam, Marius C. Codrea, Christian M. Schürch, Ulrich M. Lauer, Sven Nahnsen, Michael Schindler
Cancer Cell International.2022;[Epub] CrossRef - High level of CD10 expression is associated with poor overall survival in patients with head and neck cancer
Q. Li, Y. Wang, L. Xu, L. Wang, Y. Guo, C. Guo
International Journal of Oral and Maxillofacial Surgery.2021; 50(7): 857. CrossRef - Expression of the Carbohydrate Lewis Antigen, Sialyl Lewis A, Sialyl Lewis X, Lewis X, and Lewis Y in the Placental Villi of Patients With Unexplained Miscarriages
Zhi Ma, Huixia Yang, Lin Peng, Christina Kuhn, Anca Chelariu-Raicu, Sven Mahner, Udo Jeschke, Viktoria von Schönfeldt
Frontiers in Immunology.2021;[Epub] CrossRef - CD15+ tumor infiltrating granulocytic cells can predict recurrence and their depletion is accompanied by good responses to S‐1 with oral cancer
Mai Seki‐Soda, Takaaki Sano, Masaru Ogawa, Satoshi Yokoo, Tetsunari Oyama
Head & Neck.2021; 43(8): 2457. CrossRef - Relationship between Immunophenotype and Clinicopathological Findings for Superficial Nonampullary Duodenal Epithelial Tumor
Shigeki Fukusada, Takaya Shimura, Hiroyasu Iwasaki, Yusuke Okuda, Takahito Katano, Ruriko Nishigaki, Takanori Ozeki, Mika Kitagawa, Hirotada Nishie, Mamoru Tanaka, Keiji Ozeki, Eiji Kubota, Satoshi Tanida, Hiromi Kataoka
Digestion.2021; 102(6): 870. CrossRef - Relationship between inflammation and the severity of Recurrent Respiratory Papillomatosis
Vivian Narana Ribeiro El Achkar, Andressa Duarte, Román Carlos, Jorge Esquiche León, Alfredo Ribeiro-Silva, Shirley Shizue Nagata Pignatari, Estela Kaminagakura
American Journal of Otolaryngology.2020; 41(2): 102321. CrossRef - Broad and thematic remodeling of the surfaceome and glycoproteome on isogenic cells transformed with driving proliferative oncogenes
Kevin K. Leung, Gary M. Wilson, Lisa L. Kirkemo, Nicholas M. Riley, Joshua J. Coon, James A. Wells
Proceedings of the National Academy of Sciences.2020; 117(14): 7764. CrossRef - Prognostic Implications of CD10 and CD15 Expression in Papillary Thyroid Carcinoma
Eun Ji Oh, Andrey Bychkov, Haejin Cho, Tae-Min Kim, Ja Seong Bae, Dong-Jun Lim, Chan Kwon Jung
Cancers.2020; 12(6): 1413. CrossRef - Is There Such a Thing as a Genuine Cancer Stem Cell Marker? Perspectives from the Gut, the Brain and the Dental Pulp
Crende Olatz, García-Gallastegui Patricia, Luzuriaga Jon, Badiola Iker, de la Hoz Carmen, Unda Fernando, Ibarretxe Gaskon, Pineda Jose Ramon
Biology.2020; 9(12): 426. CrossRef - Neprilysin expression and functions in development, ageing and disease
NN Nalivaeva, IA Zhuravin, AJ Turner
Mechanisms of Ageing and Development.2020; 192: 111363. CrossRef - A Risk Signature With Inflammatory and T Immune Cells Infiltration in Colorectal Cancer Predicting Distant Metastases and Efficiency of Chemotherapy
Xiang Hu, Ya-Qi Li, Xiao-ji Ma, Long Zhang, San-Jun Cai, Jun-Jie Peng
Frontiers in Oncology.2019;[Epub] CrossRef - Tumor-infiltrating Neutrophils is Prognostic and Predictive for Postoperative Adjuvant Chemotherapy Benefit in Patients With Gastric Cancer
Heng Zhang, Hao Liu, Zhenbin Shen, Chao Lin, Xuefei Wang, Jing Qin, Xinyu Qin, Jiejie Xu, Yihong Sun
Annals of Surgery.2018; 267(2): 311. CrossRef - Fucosylated Antigens in Cancer: An Alliance toward Tumor Progression, Metastasis, and Resistance to Chemotherapy
Athanasios Blanas, Neha M. Sahasrabudhe, Ernesto Rodríguez, Yvette van Kooyk, Sandra J. van Vliet
Frontiers in Oncology.2018;[Epub] CrossRef - Biomarkers in Urachal Cancer and Adenocarcinomas in the Bladder: A Comprehensive Review Supplemented by Own Data
Henning Reis, Ulrich Krafft, Christian Niedworok, Orsolya Módos, Thomas Herold, Mark Behrendt, Hikmat Al-Ahmadie, Boris Hadaschik, Peter Nyirady, Tibor Szarvas
Disease Markers.2018; 2018: 1. CrossRef - CD10 inhibits cell motility but expression is associated with advanced stage disease in colorectal cancer
Teresa P. Raposo, Mireia Sueca Comes, Adeyemi Idowu, Bora Agit, James Hassall, Wakkas Fadhil, Robert Nica, Rupert Ecker, Takashi Yao, Mohammad Ilyas
Experimental and Molecular Pathology.2018; 104(3): 190. CrossRef - High levels of tumor-associated neutrophils are associated with improved overall survival in patients with stage II colorectal cancer
Ryan S. Berry, Meng-Jun Xiong, Alissa Greenbaum, Parisa Mortaji, Robert A. Nofchissey, Fred Schultz, Cathleen Martinez, Li Luo, Katherine T. Morris, Joshua A. Hanson, Masaru Katoh
PLOS ONE.2017; 12(12): e0188799. CrossRef - Tissue expression of CD10 and CD15 proteins in gastric lesions
Omneya Y. Bassyoni, Sarah N. Nasif
Egyptian Journal of Pathology.2017; 37(2): 321. CrossRef - Menin and Daxx Interact to Suppress Neuroendocrine Tumors through Epigenetic Control of the Membrane Metallo-Endopeptidase
Zijie Feng, Lei Wang, Yanmei Sun, Zongzhe Jiang, John Domsic, Chiying An, Bowen Xing, Jingjing Tian, Xiuheng Liu, David C. Metz, Xiaolu Yang, Ronen Marmorstein, Xiaosong Ma, Xianxin Hua
Cancer Research.2017; 77(2): 401. CrossRef - Does CD10 Expression Predict Lymph Node Metastasis in Colorectal Cancer?
Irina Bernescu, Ari C. Reichstein, Martin Luchtefeld, James W. Ogilvie
Diseases of the Colon & Rectum.2016; 59(1): 22. CrossRef - Epigenetic suppression of neprilysin regulates breast cancer invasion
H M Stephen, R J Khoury, P R Majmudar, T Blaylock, K Hawkins, M S Salama, M D Scott, B Cosminsky, N K Utreja, J Britt, R E Conway
Oncogenesis.2016; 5(3): e207. CrossRef - Substance P and thiorphan synergically enhance angiogenesis in wound healing
Jihyun Um, Jinyeong Yu, Maria Jose Dubon, Ki-Sook Park
Tissue Engineering and Regenerative Medicine.2016; 13(2): 149. CrossRef - Neutral endopeptidase (NEP) is differentially involved in biological activities and cell signaling of colon cancer cell lines derived from various stages of tumor development
Magdalena Mizerska-Kowalska, Agnieszka Bojarska-Junak, Joanna Jakubowicz-Gil, Martyna Kandefer-Szerszeń
Tumor Biology.2016; 37(10): 13355. CrossRef - Stage-Specific Embryonic Antigen-1 (SSEA-1) Expression in Thyroid Tissues
Jin Xu, Heather Hardin, Ranran Zhang, Kaitlin Sundling, Darya Buehler, Ricardo V. Lloyd
Endocrine Pathology.2016; 27(4): 271. CrossRef - Role of B Cell Development Marker CD10 in Cancer Progression and Prognosis
Deepshikha Mishra, Sunita Singh, Gopeshwar Narayan
Molecular Biology International.2016; 2016: 1. CrossRef - Increase in Both CD14-Positive and CD15-Positive Myeloid-Derived Suppressor Cell Subpopulations in the Blood of Patients With Glioma But Predominance of CD15-Positive Myeloid-Derived Suppressor Cells in Glioma Tissue
Paul R. Gielen, Barbara M. Schulte, Esther D. Kers-Rebel, Kiek Verrijp, Harriëtte M.J.M. Petersen-Baltussen, Mark ter Laan, Pieter Wesseling, Gosse J. Adema
Journal of Neuropathology & Experimental Neurology.2015; 74(5): 390. CrossRef - Immunohistochemical Characterization of Large Intestinal Adenocarcinoma in the Rhesus Macaque (Macaca mulatta)
C. E. Harbison, F. Taheri, H. Knight, A. D. Miller
Veterinary Pathology.2015; 52(4): 732. CrossRef - Tumor-Associated Neutrophils as a New Prognostic Factor in Cancer: A Systematic Review and Meta-Analysis
Meixiao Shen, Pingping Hu, Frede Donskov, Guanghui Wang, Qi Liu, Jiajun Du, William B. Coleman
PLoS ONE.2014; 9(6): e98259. CrossRef
 PubReader
 ePub Link
-
 Cite this Article
- Cite this Article
-
- Close
- Download Citation
- Close
- Figure
The Expression of CD10 and CD15 Is Progressively Increased during Colorectal Cancer Development


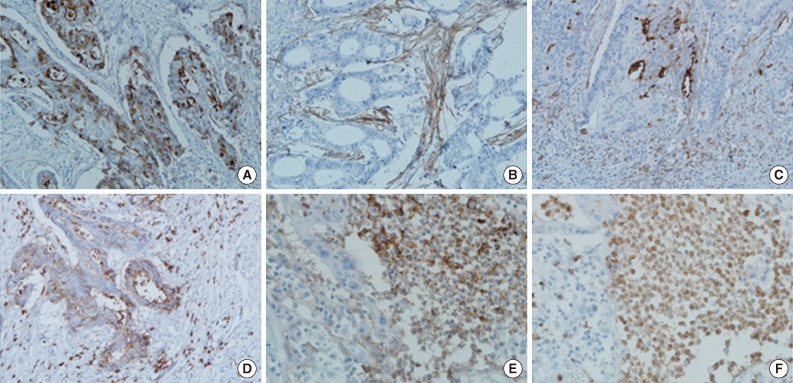
Fig. 1 Immunohistochemical staining of CD10 (A-C, E) and CD15 (D, F) in representative invasive colorectal carcinoma. CD10 is expressed in tumor cells (A), stromal cells (B), and infiltrating inflammatory cells (C). (D) CD15 is also expressed in tumor cells and infiltrating inflammatory cells. The corresponding area is examined for CD10 (E) and CD15 (F) in inflammatory cells. CD10-expressing inflammatory cells (E) are mainly neutrophils and also show CD15 expression (F).
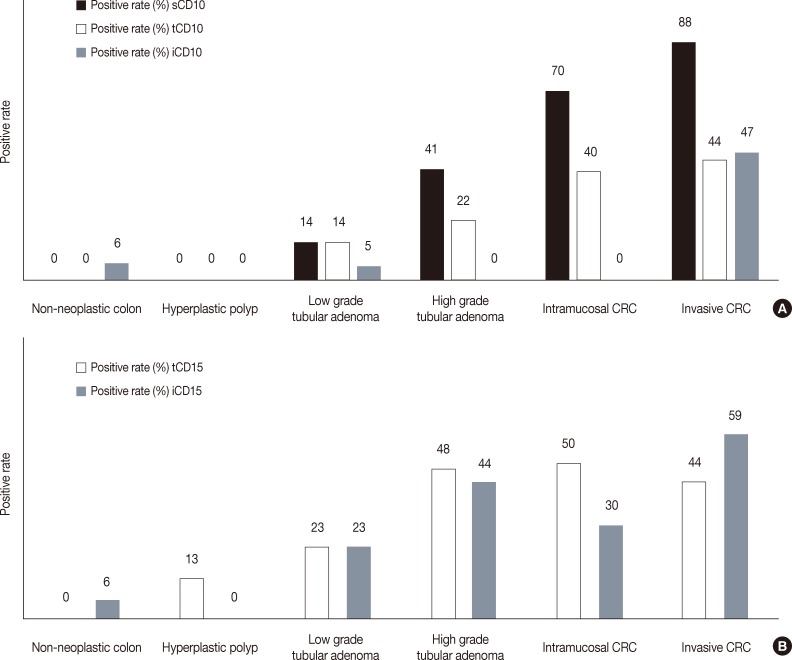
Fig. 2 The analysis of CD10 (A) and CD15 (B) expression during colorectal carcinoma (CRC) development. tCD10 expression level in invasive CRC is significantly higher than that of non-neoplastic diseases and low grade tubular adenomas (p<0.05), and there is an insignificant difference in its expression level among high grade tubular adenoma, intramucosal and invasive CRC. sCD10 expression level is significantly higher in invasive CRC compared to other diseases except for intramucosal CRC (p<0.05) and there is an insignificant difference in its expression level between high grade tubular adenoma and intramucosal CRC. In addition, both tCD10 and sCD10 in adenoma is not related to the degree of dysplasia. iCD10 expression is the highest in invasive CRC (p<0.05). tCD15 expression level is significantly higher in high grade tubular adenoma, intramucosal and invasive CRC than in non-neoplastic colon (p<0.05), and there is an insignificant difference in its expression level among neoplastic diseases. iCD15 expression level is significantly higher in invasive CRC than in non-neoplastic diseases and low grade tubular adenoma (p<0.05), there is an insignificant difference in its expression level among high grade tubular adenoma, intramucosal and invasive CRC. The numbers on the bar graphs indicate percentage.
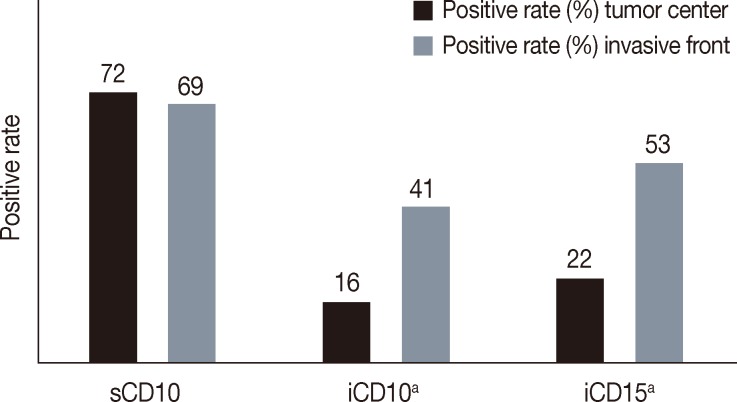
Fig. 3 An analysis for the expression of sCD10, iCD10, and iCD15 in the tumor center and invasive front. The expression level of iCD10 and iCD15 is significantly higher in the invasive front than in the tumor center (ap<0.05), however there is no significant difference in sCD10. Numbers on the bar graphs indicate percentage.
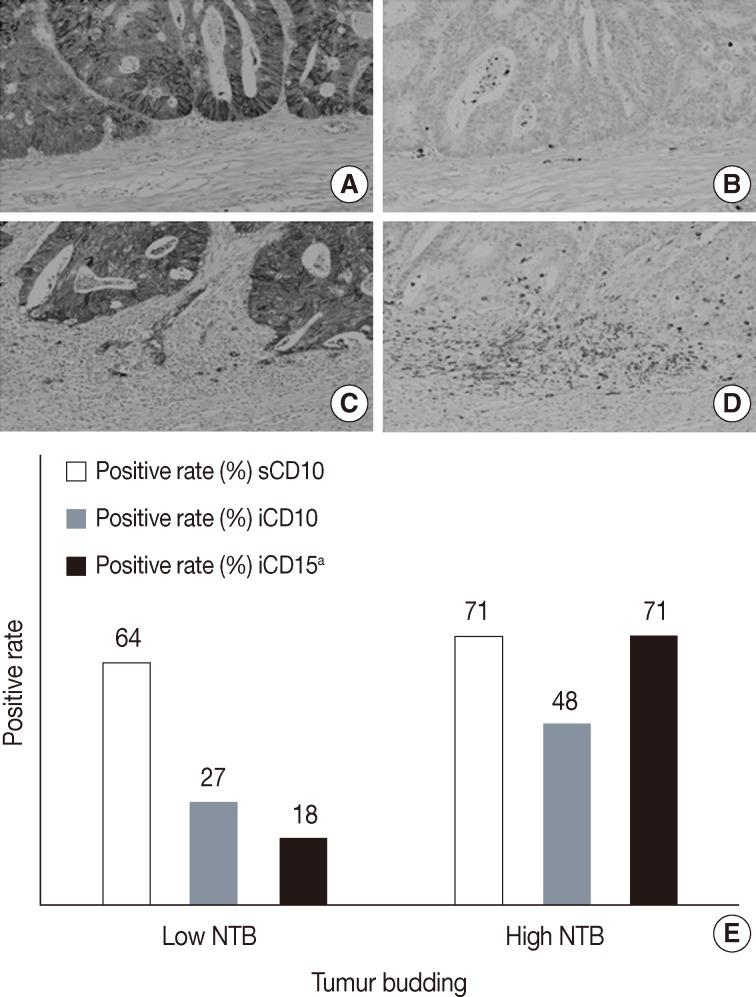
Fig. 4 Immunohistochemical staining of E-cadherin (A, C) and CD15 (B, D) in corresponding areas of invasive front in invasive colorectal cancer (CRC) and the relationship between tumor budding and the expression of sCD10, iCD10, and iCD15 in invasive CRC (E). Tumor infiltrating inflammatory cells with CD15 expression are more frequently seen in the invasive front with a high degree of tumor budding. There is a significant correlation between the number of tumor budding (NTB) and iCD15 expression of the invasive front (ap<0.05). Numbers on the bar graphs indicate percentage.
Fig. 1
Fig. 2
Fig. 3
Fig. 4
The Expression of CD10 and CD15 Is Progressively Increased during Colorectal Cancer Development
| No. of cases | Age distribution (yr) | Gender (male:female) | |
|---|---|---|---|
| Non-neoplastic colon | 17 | 43-76 | 11:6 |
| Hyperplasitc polyp | 15 | 22-67 | 9:6 |
| Low grade tubular adenoma | 22 | 35-78 | 12:10 |
| High grade tubular adenoma | 27 | 42-82 | 20:7 |
| Intramucosal CRC | 10 | 52-78 | 5:5 |
| Invasive CRC | 32 | 57-87 | 20:12 |
| No. of cases | Positive, n (%) |
|||||
|---|---|---|---|---|---|---|
| sCD10 | tCD10 | iCD10 | iCD15 | tCD15 | ||
| Gender | ||||||
| Male | 20 | 18 (90) | 10 (50) | 9 (45) | 10 (50) | 10 (50) |
| Female | 12 | 10 (83) | 4 (33) | 6 (50) | 9 (75) | 4 (12) |
| Differentiation | ||||||
| Well | 5 | 4 (80) | 2 (40) | 4 (80) | 4 (80) | 1 (20) |
| Moderate to poor | 27 | 24 (89) | 12 (44) | 11 (41) | 15 (56) | 13 (48) |
| Location | ||||||
| Right and transverse | 13 | 11 (85) | 6 (46) | 7 (54) | 8 (62) | 6 (46) |
| Left | 19 | 17 (89) | 8 (42) | 8 (42) | 11 (58) | 8 (42) |
| Depth | ||||||
| T2 | 5 | 5 (100) | 3 (60) | 4 (80) | 4 (80) | 0 (0) |
| T3 | 27 | 23 (85) | 11 (41) | 11 (41) | 15 (56) | 14 (52) |
| Node metastasis | ||||||
| Absence | 21 | 17 (81) | 8 (38) | 10 (21) | 14 (67) | 8 (38) |
| Presence | 11 | 11 (100) | 6 (55) | 5 (11) | 5 (45) | 6 (55) |
Table 1. Patient characteristics
CRC, colorectal carcinoma.
Table 2. Relationship between clinicopathological parameters and the expression of CD10 and CD15 in whole tissue sections of invasive colorectal carcinoma
p<0.05.

 E-submission


